A Direct Probe of Electronic Nematic Order; Symmetry Information in Scanning Tunneling Microscope Images
Abstract
An electronic nematic state spontaneously breaks a point-group symmetry of an underlying lattice. As a result, the nematic-isotropic transition accompanies a Fermi surface distortion. However, the anisotropic nature of the nematic state at a macroscopic scale can be easily wiped out when domains of different orientations of nematic order exist. We suggest that a spatial pattern of local density of states (LDOS) in the presence of a non-magnetic impurity can be a direct probe of the nematic order. We study various patterns of LDOS across the quantum phase transition between the isotropic and nematic phases. Especially the Fourier transformed local density of states (FT-LDOS), which can be deduced from scanning tunneling microscope images, represent a transparent symmetry of an electronic structure. The application of our results to the bilayer ruthenate, Sr3Ru2O7 is also discussed.
pacs:
71.10.Hf,71.20.-b,71.55.-i,73.22.Gk,73.43.NqIntroduction:
Recently, the existence of an intermediate form of matter dubbed the electronic nematic liquid was proposed to explain novel features observed in ultra-pure Sr3Ru2O7.Borzi et al. (2007) Especially, a large magnetoresistive anisotropy in the close vicinity of a metamagnetic quantum critical point shows a striking similarity to those reported in ultra-clean two-dimensional electron systems in high magnetic fieldsLilly et al. (1999); Du et al. (1999), where the electronic nematic phase was also suggested. The metamagnetic transition in Sr3Ru2O7 possesses a critical end point at a finite temperature, and it was proposed that a quantum critical point can be achieved by tilting the magnetic field towards the direction perpendicular to the Ru-O plane.Grigera et al. (2001) However, when the system gets close to the putative quantum critical point, a new phase bounded by two successive metamagnetic transitions was found in an ultra-clean sample.Grigera et al. (2004) The emergent phase is characterized by a high residual resistivity compared to the phases nearby, and it was suggested that a formation of the electronic nematic phase leads to these remarkable phenomena of consecutive metamagnetic transitions and the high residual resistivity.Grigera et al. (2004); Kee and Kim (2005); Doh et al. (2006b)
The electronic nematic phase is characterized as an anisotropic metallic state with a broken point-group symmetry of an underlying lattice.Yamase et al. (2000a); Halboth and Metzner (2000); Kivelson et al. (2003); Kee et al. (2003); Khavkine et al. (2004); Yamase et al. (2005a) For example, on a square lattice, there are two distinct nematic phases depending on how the rotational symmetry is broken.Doh et al. (2006a) A consequence of the broken symmetry is a spontaneous Fermi surface distortion, which leads to an anisotropy between two directions of the longitudinal resistivity. Indeed, a large magnetoresistive anisotropy was observed in Sr3Ru2O7 consistent with a formation of nematic phase. On the other hand, when the field is perpendicular to the Ru-O plane, the anisotropy is no longer present, but the high residual resistivity becomes pronounced. It was proposed that the nematic domain formation results in the high resistivity in the emergent phase, which involves two different orientations of the nematic order in the square lattice system.Doh et al. (2006b) In the presence of the nematic domains, the nature of the broken rotational symmetry can be hardly observable in any bulk measurement.
In this paper, we suggest that a spatial pattern of the LDOS as measured by scanning tunneling microscopy (STM) provides a direct probe of the nematic order. Note that the nematic-isotropic transition is first order, thus the insignificant effect of order parameter fluctuation on the Fermi surface measurement is in contrast to the case near the nematic quantum critical point.Lawler et al. (2006a) We show that the Friedel oscillations around an impurity show visible anisotropic patterns between and directions in the nematic phase, as one expected. In particular, the FT-LDOS shows a transparent difference between the nematic and isotropic phases across the transition by the magnetic field. Therefore, STM on the bi-layer ruthenate is highly desirable for the confirmation of the nematic phase emerging near the vicinity of the putative quantum critical point.
Phenomenological Model:
The essential physics of the broken symmetry possessed in LDOS is insensitive to the choice of a Hamiltonian, as long as the nematic-isotropic transition is captured in the Hamiltonian. On the other hand, the detailed patterns of the LDOS depend on the interactions as well as band structure. To capture an electronic structure symmetry embedded in spatial patterns of LDOS across the transition, we use a phenomenological Hamiltonian with a quadrupole interactionOganesyan et al. (2001); Kee et al. (2003), which successfully described the phenomena of the metamagnetic transitions, high resistivity, and anisotropic magnetoresistivity in the bilayer ruthenate.Kee and Kim (2005); Doh et al. (2006b); Puetter et al. (2007)
Since the nematic phase contains a broken rotational symmetry, an analog of the order parameter of the nematic liquid crystal is the first step towards the construction of a phenomenological model.Oganesyan et al. (2001); Kee et al. (2003); Khavkine et al. (2004) We defined , a quadrupole tensor on the square lattice as
| (1) |
where and . We can write down the Hamiltonian as follows using the quadrupole tensor, which leads to the nematic order within the mean-field theory.
| (2) |
where is the electronic dispersion of the tight-binding model on the square lattice, and is a chemical potential. is a Zeeman term, where for up-spin and for down-spin. represents the strength of the quadrupole-quadrupole interaction, which can be viewed as the Landu quasiparticle interaction of angular momentum channel.Pomeranchuk (1958); Oganesyan et al. (2001); Lawler et al. (2006a); Nilsson and Neto (2005); Quintanilla and Schofield (2006)
There are two types of the Fermi surface distortion associated with and which represent the Fermi surface elongations along the directions parallel to the axis and diagonal to the axis, respectively. The previous mean-field results showed that for a given value of , the diagonal distortion does not occur, so we focus on the nematic phase with a Fermi surface distorted along the or -axis of the square lattice. The mean field equation for the uniform nematic order can be written as
| (3) |
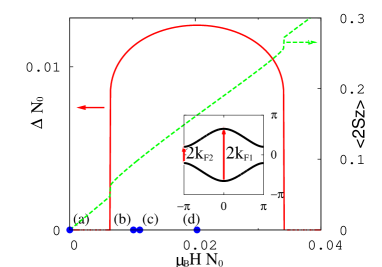
where the nematic order parameter is defined as The order parameter as a function of magnetic field for a given chemical potential was studied in Ref.Kee and Kim, 2005. The strongly first order nature of transition is originated from the van Hove singularity, and the density of up(or down)-spin as a function of Zeeman field jumps at the transitions, which results in two consecutive metamagnetic transitions. In Fig. 1, we showed the earlier result of the order parameter to indicate the locations in the phase diagram where we present LDOS. We set and , where . (a) represents the isotropic phase with , and (b)-(d) the nematic phase with and , respectively. We carried out the standard T-matrix formalism to compute FT-LDOS and show the results for (a) -(d) cases below.
Local density of states with a single impurity:
The FT-LDOS, with a single impurity is obtained using the standard T-matrix formalism.
| (4) |
with the T-matrix, where represents the strength of the impurity, and we set . The single particle retarded Green’s function, modified by the nematic order self-consistently can be written as follows.
| (5) |
Here we ignore effects of the impurity on the nematic order, so our results are valid only when the strength of an impurity and the bias voltage is smaller than the energy scale of nematic order. We use 2-dimensional adaptive integration to compute shown in Fig. 2.
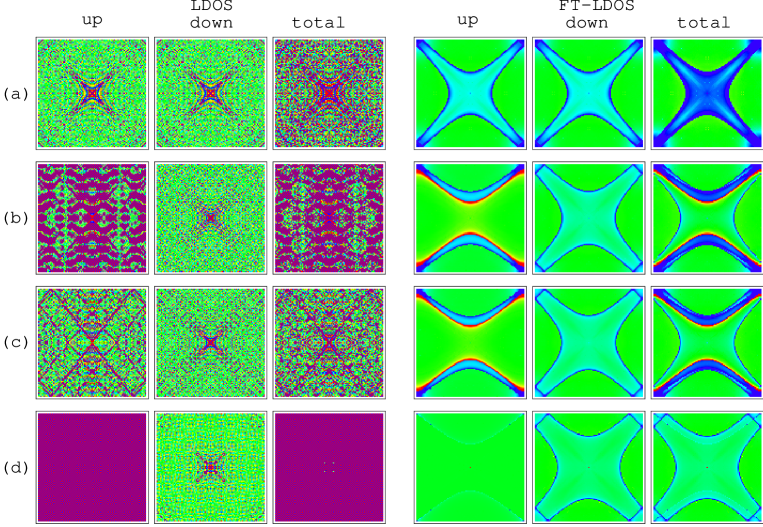
Fig. 2 shows LDOS and FT-LDOS at the Fermi energy () for various strengths of nematic order corresponding to (a)-(d) indicated in Fig. 1. The left three columns show LDOS in real space for up-spin, down-spin, and sum of both spins from left to right, respectively. FT-LDOS images are also shown in the next three columns. Each row corresponds to (a) to (d) cases in Fig. 1 from top to bottom. The color represents a relative strength of LDOS (FT-LDOS) induced by the impurity. The Friedel oscillations around the impurity located at the center show visible anisotropic patterns between and directions. The peak structures in FT-LDOS are associated with the Fermi surface nesting vectors. In the isotropic phase of (a), the peaks of the FT-LDOS form an asteroidal shape with the strongest peak near (,) which is the nesting vector of the half-filled tight-binding dispersion. In the nematic states, (b) and (c), the asteroidal peak structure abruptly changes to a sandglass-like shape due to the opening of the Fermi surface along the -axis. The anisotropic shape in the nematic phase is mainly due to the extreme vectors of and as shown in the inset of Fig. 1. These extreme vectors also determine the wave length of the Friedel oscillations which will be further discussed below. While the nematic order is maximized in (d), we found that both FT-LDOS and LDOS do not show a significant signal of the nematic phase because of the destructive interference between two extreme vectors of and . However, the nematic order signals at finite bias voltages represented by the dashed and dotted lines in the bottom of Fig. 3.
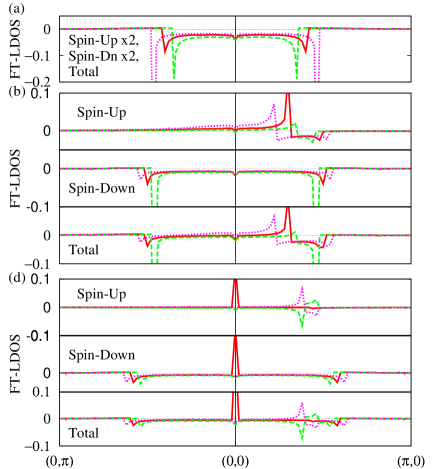
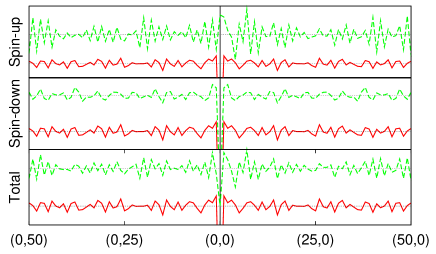
FT-LDOS along - and -axis for finite are shown in Fig. 3. The dramatic changes in FT-LDOS occur across the transition. FT-LDOS along the direction lose their weight, while additional structures develop along the direction. One is originated from the extreme vector of connecting , while the other from the extreme vector of connecting , of the Fermi surface shown in Fig. 1. These peaks along the direction give a unique pattern of Friedel oscillation in LDOS. LDOS along and -axis shown in Fig. 4 also reflect the broken symmetry in the nematic state. For example, LDOS represented by the dashed line clearly show different amplitude variations along the -direction, which roughly correspond to the wave length .
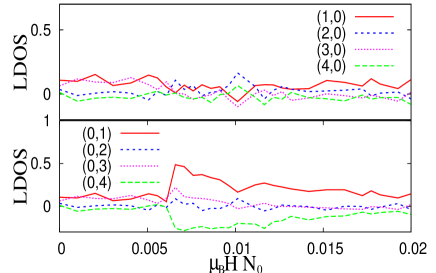
The magnetic field dependence of LDOS is shown in Fig. 5. At the isotropic-nematic transition occurring around , LDOS at impurity site shows a sudden decrease (increase) for an attractive (repulsive) impurity potential (not shown here). It is interesting note that LDOS at neighboring sites such as (in unit of the lattice spacing ), show a dramatic change across the transition, while LDOS at does not show any significant change across the transition. The field dependence of LDOS also possesses the strong anisotropic nature of the nematic phase.
Discussion and Summary:
Strongly correlated electron systems with or -electrons have demonstrated rich phase diagrams with many different phases. When the transition temperature between two different phases is driven to zero by the application of a magnetic field, pressure, or via chemical doping, we can achieve the quantum critical point (QCP). The behavior of the system close to the QCP is very different from the behavior in the vicinity of the classical phase transition, and it has been an intensive research area. Along the journey of searching for QCP, we often discovered that a novel phase emerges at the vicinity of the desired QCP.
The emergent phase at the vicinity of the QCP in the bilayer ruthenate is characterized by the anisotropic magnetoresistivity, when the field is tilted from c-axis. On the other hand, the high resistivity without anisotropy was reported, when the field is along c-axis, . It was proposed that the nematic domain formation is responsible for the high resistivity for . These imply that the nematic domain may align when the field is tilted from c-axis mostly due to the in-plane component of magnetic field, and results in the anisotropic magnetoresistivity. At present, we do not have a microscopic picture which describes interplay between the nematic domain formation and the direction of magnetic field, which needs to be further investigated in future.
Here we proposed that a local probe such as STM is insensitive to a macroscopic inhomogeneity, and therefore it can directly confirm an existence of the nematic order. We studied FT-LDOS and LDOS in the presence of a nonmagnetic impurity across the nematic-isotropic transition tuned by the external magnetic field, and found the followings. (1) FT-LDOS as well as the Friedel oscillations in real space show a transparent indication of the broken rotational symmetry. In particular, the Fourier transformed image of LDOS which can be deduced from STM data gives direct information on the topology of a Fermi surface associated with the electronic nematic order. (2) Across the transition, the change of the Fermi surface volume accompanies a sudden change in LDOS. Therefore, LDOS at the impurity and neighboring sites show significant and anisotropic changes across the transition. (3) In the nematic phase, it is possible that the anisotropic signal can be washed out, when the signals from two extreme vectors have destructive interference. However, anisotropic properties are still detectable at finite .
Acknowledgements.
We thank J. C. Davis for encouraging us to present the current work. This work was supported by NSERC of Canada, Canada Research Chair, Canadian Institute for Advanced Research, and Alfred P. Sloan Foundation.References
- Borzi et al. (2007) R. A. Borzi, S. A. Grigera, J. Farrell, R. S. Perry, S. J. S. Lister, S. L. Lee, D. A. Tennant, Y. Maeno, and A. P. Mackenzie, Science 315, 214 (2007).
- Lilly et al. (1999) M. P. Lilly, K. B. Cooper, J. P. Eisenstein, L. N. Pfeiffer, and K. W. West, Phys. Rev. Lett. 82, 394 (1999).
- Du et al. (1999) R. R Du, D. C. Tsui, H. L. Stormer, L. N. Pfeiffer, K. W. Baldwin, and K. W. West, Solid State Comm. 109, 389 (1999).
- Grigera et al. (2001) S. A. Grigera, R. S. Perry, A. J. Schofield, M. Chiao, S. R. Julian, G. G. Lonzarich, S. I. Ikeda, Y. Maeno, A. J. Millis, and A. P. Mackenzie, Science 294, 329 (2001).
- Grigera et al. (2004) S. A. Grigera, P. Gegenwart, R. A. Borzi, F. Weickert, A. J. Schofield, R. S. Perry, T. Tayama, T. Sakakibara, Y. Maeno, A. G. Green, Science 306, 1154 (2004).
- Kee and Kim (2005) H.-Y. Kee and Y. B. Kim, Phys. Rev. B 71, 184402 (2005).
- Doh et al. (2006b) H. Doh, Y. B. Kim, and K. H. Ahn (2006b), cond-mat/0604425.
- Yamase et al. (2000a) H. Yamase, and H. Kohno J. Phys. Soc. Jpn. 69, 332 (2000).
- Halboth and Metzner (2000) C. J. Halboth and W. Metzner, Phys. Rev. Lett. 85, 5162 (2000).
- Kivelson et al. (2003) S. A. Kivelson, E. Fradkin, V. Oganesyan, I. P. Bindloss, J. M. Tranquada, A. Kapitulnik, and C. Howald, Rev. Mod. Phys. 75, 1201 (2003).
- Kee et al. (2003) H.-Y. Kee, E. H. Kim, and C.-H. Chung, Phys. Rev. B 68, 245109 (2003).
- Khavkine et al. (2004) I. Khavkine, C.-H. Chung, V. Oganesyan, and H.-Y. Kee, Phys. Rev. B 70, 155110 (2004).
- Yamase et al. (2005a) H. Yamase, V. Oganesyan, and W. Metzner Phys. Rev. B 72, 35114 (2005).
- Doh et al. (2006a) H. Doh, N. Friedman, and H.-Y. Kee, Phys. Rev. B 73, 125117 (2006a).
- Lawler et al. (2006a) M. Lawler, and E. Fradkin, Phys. Rev. B 75, 033304 (2006a).
- Oganesyan et al. (2001) V. Oganesyan, S. A. Kivelson, and E. Fradkin, Phys. Rev. B 64, 195109 (2001).
- Puetter et al. (2007) C. Puetter, H. Doh, and H.-Y. Kee (2007), unpublished.
- Pomeranchuk (1958) I. J. Pomeranchuk, Sov. Phys. JETP 8, 361 (1958).
- Lawler et al. (2006a) M. Lawler, V. Fernandez, D. Barci, E. Fradkin, and L. Oxman, Phys. Rev. B 73, 085101 (2006a).
- Nilsson and Neto (2005) J. Nilsson and A. H. C. Neto, Phys. Rev. B 72, 195104 (2005).
- Quintanilla and Schofield (2006) J. Quintanilla and A. J. Schofield, Phys. Rev. B 74, 115126 (2006).