Dispersive microwave bifurcation of a superconducting resonator cavity incorporating a Josephson junction
Abstract
We have observed the dynamical bistability of a microwave superconducting Fabry-Perot cavity incorporating a non-linear element in the form of Josephson tunnel junction. The effect, which is the analog of optical bistability, manifests itself in the transmission and reflection characteristics of the cavity and is governed by a competition between the wave amplitude dependence of the resonant frequency and the finite residence time of the field energy inside the cavity. This finite residence time is solely due to extraction of radiation from the cavity by the measurement process. The tight quantitative agreement with a simple model based on the Duffing oscillator equation shows that the nonlinearity, and hence the bifurcation phenomenon, is solely dispersive.
pacs:
74.70.Ad, 74.25.Fy, 74.25.Qt, 74.25.JbAmplifying in the microwave frequency domain signals whose energy are at or close to the quantum limit constitute an experimental challenge whose pursuit is justified both by the fundamental understanding of amplification mechanisms in general quantum_amplification and by applications in radioastronomy radioastronomy and quantum information processing quantum_information . One practical, minimal noise amplification mechanism involves pumping a purely dispersive non-linear medium in the vicinity of a bifurcation between two dynamical states. The weak input signals can then be detected either in the non-hysteretic regime for continuous, phase preserving operation or in the hysteresis regime where the medium provides latching by switching from one state to the other.
In this Letter, we demonstrate that a microwave superconducting cavity incorporating a Josephson junction can display a bistable regime of operation suitable for ultra-low noise amplification. The bifurcation associated with this bistability involves a dispersive non-linear dynamical evolution of the fields of the cavity on time scales given by its quality factor rather than a slow change in its parameters due to dissipation induced heating of the cavity material. Importantly, we show that the strength of the non-linearity depends on the combination of simple electrical characteristics of the junction and the cavity, both being entirely controllable by fabrication. The abscence of dissipation inside the cavity ensures that a minimal number of modes are involved in the amplification process, a necessary condition for amplification at the quantum limit Caves
A Josephson tunnel junction constitutes the only radio-frequency (RF) electrical element which is both non-dissipative and non-linear at low temperatures and whose characteristics are engineerable in a wide parameter range. This property makes it unique for applications in ultra-low noise amplifiers, particle detectors, and more recently, quantum information processing. The pioneering work on squeezing of Yurke et. al. in the 80’s yurke1 had already showed that the Josephson junction could achieve for microwave radiation in the quantum regime what non-linear media could achieve for quantum optics. Since then, recent works in which a Josephson circuit is coupled to a superconducting microwave cavity have demonstrated that the strong-coupling regime of cavity QED in atomic physics could be attained wallraff . Here, we are showing that the cavity can become so non-linear that the analog of dispersive optical bistability with atomic ensembles kimble can be observed.
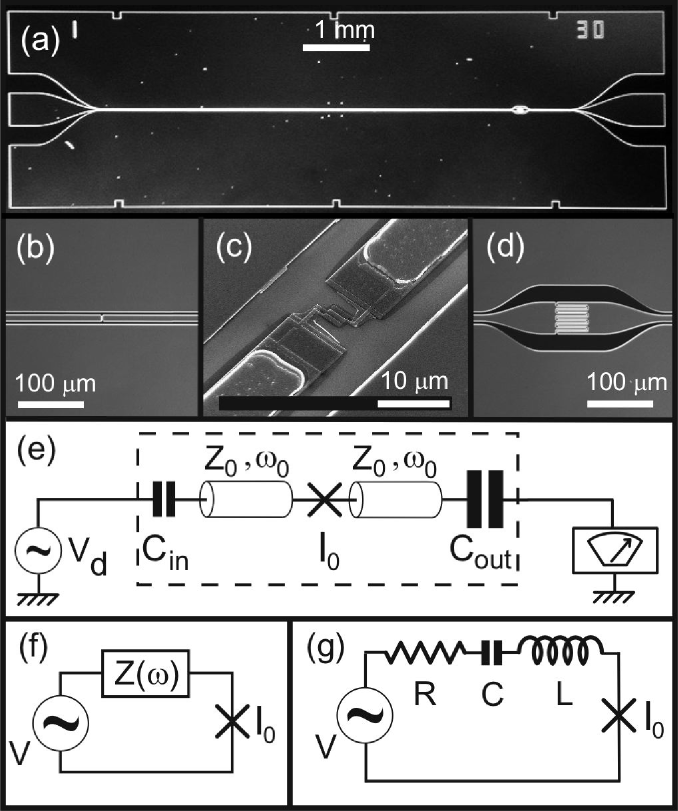
In Fig. 1a we show our superconducting Fabry-Perot cavity constructed from a coplanar waveguide transmission line by interrupting the conductor with two in-plane capacitors playing the role of partially transparent mirrors (see Fig. 1b, d). The geometric distance between the capacitors determines the lowest resonance frequency of this resonator. In our experiments, by varying the length of the transmission line, the frequency is tuned between 1.5 and 10 GHz. The quality factor of the cavity was in the 400-2500 range and was entirely determined by the loading through the coupling capacitances. In a separate experimentLuigi we have demonstrated that the contribution of intrinsic dissipation to for this type of resonator at our working temperatures ( mK) were negligible. In the middle of the cavity, the central conductor of the transmission line is interrupted with a gap into which a Al-AlOx-Al Josephson junction is inserted (see Fig. 1c), ensuring maximum coupling between the junction and odd cavity modes. Fabrication of the junction involves standard e-beam lithography, shadow mask evaporation and lift-off. Good metallic contacts between the leads of the junction and the Nb resonator were obtained with ion beam cleaning prior to the e-beam evaporation of aluminium films. In the following, we will concentrate on the lowest order mode for which the analysis developed in cond-mat 0612576 applies.
The circuit diagram of our experiment is given in Fig. 1e where the two sections of loss-less coaxial transmission lines represent the coplanar waveguide on each side of the junction. The transmission lines are parametrized by a characteristic impedance () and a frequency corresponding to their (fundamental) resonance. The small input capacitor couples in a source signal from a microwave generator while the large output capacitor couples out the transmitted signal to the first stage of our amplifier chain. A factor of 20 to 35 in capacitor asymmetry ensures that all the power escaping from the resonator is collected on the amplifier side. This maximizes the signal to noise ratio of the experiment since it prevents the input port to participate in the dissipation. Applying the Norton-Thevenin theorem, our microwave circuit can be seen from the junction as an ideal RF voltage generator connected to a series combination of the junction and a finite linear embedding impedance (see Fig. 1f). For drive frequencies in the vicinity of the fundamental mode the system is very well described by the model shown on Fig. 1g, where is now a series LCR circuit. When combined with the junction non-linear inductance governed by the parameter , where , this circuit yields an equation, analogous to the Bloch-Maxwell equations described in ref Mabuchi_theory , and which can be analyzed in detail cond-mat 0612576 . In the asymmetric mirrors limit parameters of the circuit from Fig. 1 are given by , , , where is the 50 load resistance. Note that absorbs a slight renormalization by the coupling capacitors. The quality factor is given by . We will come back to this model after examining the data.
The basic principle of our experiment is to measure the transmission characteristics of the cavity as a function of both frequency and power. We studied three different chip samples for which the relevant parameters are given in Table 1. They were anchored to the final T=300 mK stage of a 3He refrigerator. While we have mainly conducted CW measurements, we have also conducted measurements in which, keeping the frequency fixed, the power is ramped sufficiently rapidly to probe the internal dynamics of the cavity. Since we would like to demonstrate that the cavity is strongly non-linear even for small radiative energies stored inside it, the challenge of the experiment is to perform precise transmission measurements at very low power. A vector network analyzer sends a CW microwave signal on the small capacitor side and analyzes the transmitted signal coming out from the large capacitor side, after they have passed through the amplifier chain which includes one cryogenic HEMT amplifier at 4 K and two circulators placed at 300 mK and 4 K.
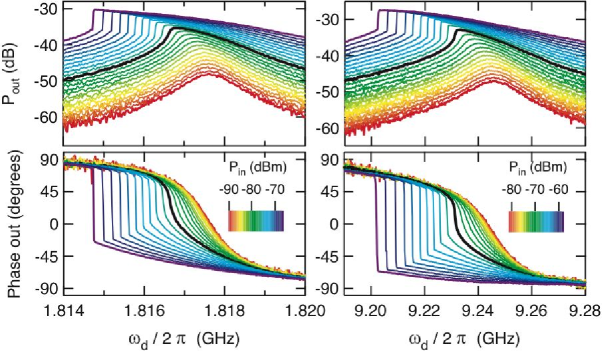
In Fig. 2 we show the typical transmitted signal amplitude (top panels) and phase (bottom panels) as a function of drive frequency for different input drive power and for two resonator frequencies (samples 2 and 3). The drive frequency was swept in 800 ms. At low drive power the response of the resonator is a Lorentzian centered on the resonator frequency. As drive power is increased, the resonant response sharpens on the low frequency side and softens on the high frequency side. At a critical drive power , the maximum slope on the low frequency side diverges. Upon increasing the drive power further, a abrupt transition develops, whose position shifts to lower frequency with increasing power. The two panels of Fig. 2 demonstrate that the phenomenon presents itself in identical manners for two resonators despite their different resonant frequencies and quality factors. For clarity the response at the critical power is highlighted in black. At even higher drive power (data not shown), the system becomes chaotic as described elsewhere JBA1 .
| sample 1 | sample 2 | sample 3 | ||
|---|---|---|---|---|
| measured | (GHz) | |||
| (pF) | ||||
| (dBm) | ||||
| inferred | (nH) | |||
| (pF) | ||||
| (A) | ||||
| expected | (A) |
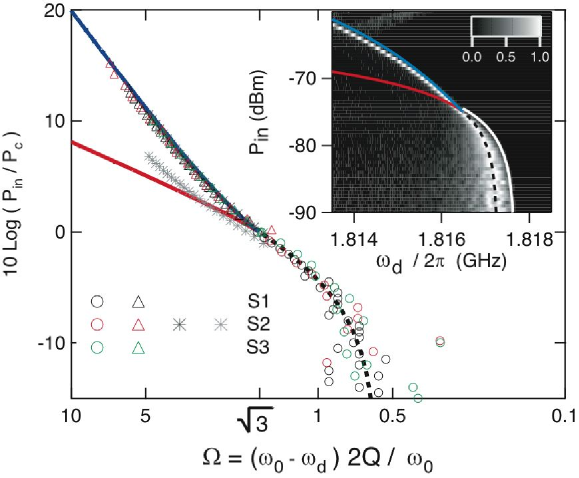
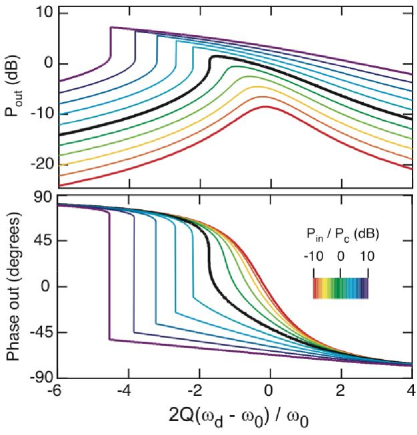
These results should be fully governed by the static solutions of the Duffing oscillator as described in cond-mat 0612576 . Indeed, simple analytical relations for the transmitted power and phase at different drive powers show excellent qualitative agreement with the measurements as shown in Fig. 3. We now focus on the locations in the plane where the susceptibility is maximum, i.e. locations where is maximum. When , these should correspond with the bifurcation points. We will also follow the point of maximum . These results are plotted for the three samples and three different values of the DC critical current of the Josephson junctions patterned in our samples. We plot them against the reduced frequency and , both obtained independently for each sample. As expected, the various experimental points fall on a universal theoretical curve when properly scaled. Based on cond-mat 0612576 we expect the bifurcation power to be given by (blue and red lines respectively) and the power of highest derivative below to be (dashed line). They are also shown on a plot of the output power in the inset of Fig. 4. There, is normalized to its maximum and plotted as a function of the drive frequency and power. The maximum output power (below ) is shown as a white line defined by and coincides with the change of sign of . Note that these measurements do not probe the hysteresis since the frequency is swept only in the forward direction. To verify the hysteretic behavior of the phenomenon, we used triangular power sweeps for several frequencies. We were able to probe the power and frequency dependence of both bifurcation points. The resulting data is shown as stars on Fig. 4. The deviation from predictions is most likely due to the proximity of the lower bifurcation current amplitude to , situation not well addressed by the Duffing model. Note that the upper and lower bifurcation current in this RF experiment correspond to the switching and retrapping current, respectively, in DC Josephson IV measurement.
We now discuss how, from the measured value of the critical power, we can infer . In contrast to a DC experiment, where one can characterize the biasing circuit with great precision, an absolute calibration of the environmental impedance at RF frequencies is arduous. From the values of , , and obtained from the low power (linear) measurements, as well as the relations and , we extract from the measured value of . In table 1 we show that obtained in this way is consistent with the normal resistance test of junctions fabricated in the same batch. We can thus verify that the Duffing model hypothesis for the RF critical current amplitude is well satisfied cond-mat 0612576 .
Other experiments on an AC biased Josephson junction have been realized yurke1 ; JBA2 ; janicelee ; lupascu , albeit with a lower degree of control over the electrodynamic environment. Nonlinear effects involving superconducting weak links in resonators have been reported Nbweaklinkres ; Buks ; Haviland . Moreover, the Duffing oscillator physics has been shown to appear in several other systems including nanomechanical resonators mechanical and relativistic electrons Gabrielse . However, our realization offers an unprecedented opportunity to study dynamical driven systems in the regime where quantum fluctuations are dominant Mabuchi_theory , dykman . This regime is yet unexplored experimentally.
The excellent overall agreement between experimental results and theoretical predictions allows us to eliminate non-linear dissipative effects as the cause for the bifurcation. For instance, if the dissipation in the resonator would increase with power the resonance would become broader, its maximum would decrease and the resonance curves will eventually cross each other, an effect never observed in our experiment.
The main application we envisage in the short term for this phenomenon is parametric amplification at microwave frequency which would reach the quantum limit at the practical level, not simply at the proof-of-principle level. It could also used as a superconducting quantum bit readout JBAqubit . Because the cavity frequency is mainly determined by geometry, we can stage in the frequency domain several cavities and multiplex the measurement or readout of a collection of entities.
In conclusion, we have observed the dynamical bifurcation of a superconducting microwave cavity incorporating a non-linear element in the form a Josephson tunnel junction. This bifurcation is analogous to the optical bistability observed with atoms in a Fabry-Perot in QED experiments. Our system is therefore at the crossroads between the physics of dynamical systems and quantum optics. Our level of control on the various parameters of this bistable phenomenon opens the door to amplification at the quantum limit, squeezing and other analog quantum information processing functions in the strong and ultra-strong coupling regimes.
The authors are grateful to Daniel Esteve, Denis Vion and Steve Girvin for helpful discussions. This work was supported by NSA through ARO Grant No. W911NF-05-1-0365, the Keck Foundation, and the NSF through Grant No. DMR-0325580.
References
- (1) A. D. Clerk PRL, S. M. Girvin and A. D. Stone, Phys. Rev. B 67, 165324 (2003); U. Gavish, B. Yurke and Y. Imry, Phys. Rev. Lett. 93, 250601 (2004).
- (2) P. K. Day et. al., Nature 425, 817 (2003) and references therein.
- (3) M. H. Devoret and R. J. Schoelkopf, Nature, 406, 1039 (2000)
- (4) C. M. Caves, Phys. Rev. D 26, 1817 (1982)
- (5) B. Yurke et. al., Phys. Rev. A 39, 2519 (1989).
- (6) A. Wallraff et. al., Nature 431, 162, (2004).
- (7) G. Rempe et. al., Phys. Rev. Lett. 67, 1727 (1991).
- (8) L. Frunzio et. al., IEEE Trans. Appl. Supercon. 15, 860 (2005)
- (9) M. A. Armen and H. Mabuchi, Phys. Rev. A 73, 063801 (2006)
- (10) I. Siddiqi et. al., Phys. Rev. Lett., 94, 027005 (2005).
- (11) V.E. Manucharyan, et. al., cond-mat 0612576
- (12) I. Siddiqi et. al., Phys. Rev. Lett. 93, 207002 (2004).
- (13) A. Lupascu et. al., Phys. Rev. Lett. 96, 127003 (2006).
- (14) Janice C. Lee et. al., IEEE. Trans. Appl. Supercon. 15, 841 (2005).
- (15) C.C. Chin et. al., Phys. Rev. B 45, 4788 (1992).
- (16) B. Abdo et. al., Phys. Rev. B 73, 134513 (2006).
- (17) E. A. Tholen et. al., cond-mat 0702280
- (18) J.S. Aldridge and A.N. Cleland, Phys. Rev. Lett. 94, 156403 (2005); Stav Zaitsev et. al., cond-mat/0503130.
- (19) C.H. Tseng et. al., Phys. Rev. A 59, 2094 (1999).
- (20) M.I. Dykman and V.N. Smelyanskii, Zh. Eksp. Teor. Fiz. 94, 61 (1988).
- (21) I. Siddiqi et. al., Phys. Rev. B 73, 054510 (2006).