Current address: ]Department of Physics, University of California, San Diego, La Jolla, CA 92093
Crystalline Surface Phases of the Liquid Au-Si Eutectic Alloy
Abstract
A two dimensional crystalline layer is found at the surface of the liquid eutectic Au82Si18 alloy above its melting point C. Underlying this crystalline layer we find a layered structure, 6-7 atomic layers thick. This surface layer undergoes a first-order solid-solid phase transition occurring at C. The crystalline phase observed for T371 ∘C is stable up to at least 430 ∘C. Grazing Incidence X-ray Diffraction data at T371 ∘C imply lateral order comprising two coexisting phases of different oblique unit cells, in stark contrast with the single phase with a rectangular unit cell found for low-temperature crystalline phase CC.
pacs:
68.03.-g, 61.66.Dk, 68.35.Bs, 61.25.MvI Introduction
Liquid bulks exhibit short range order, extending to a few molecular diameters only. In certain liquids, however, a free surface induces ordering of the near-surface molecules into well-defined layers that typically extend into the bulk to depths of the order of the bulk correlation length. For liquid crystals this can be several tens of molecular lengths; however, for more typical atomic liquids layering extends only 3 or 4 molecular diameters.Magnussen95 ; Regan95 ; Lei96 ; Lei97 ; Regan97 ; Dimasi98 ; Tostmann98 ; Tostmann99 ; Yang99 ; Yang00 ; Tostmann00 ; Dimasi00 ; Dimasi01 ; Huber02a ; Huber02 ; Huber03 ; Li02 ; Yang03 ; Shpyrko03 ; Shpyrko04 ; Li05 ; Shpyrko05 ; Balagurusamy07 For all pure metals and non-dilute alloys, atoms within each surface-induced layer were found to exhibit only liquid-like short range order in the surface-parallel directions.
This general observation differs strikingly from our recent discovery of a two-dimensional crystalline surface phase in the Au82Si18 liquid eutectic alloy.Shpyrko06 Prior to this discovery observation of laterally ordered phases in metallic liquids has been limited to binary dilute systems at concentrations close to the phase boundary for coexistence with the 3D solid crystal. In those cases, the dilute, higher melting point component segregated to the surface to form a complete surface monolayer.Yang99 ; Yang00 ; Yang03 The observation of a surface-crystalline monolayer in a non-dilute system, which is far from the phase boundaries of the bulk solid phase, is, therefore, quite unusual and very unexpected. The formation of a crystalline surface phase in Au82Si18 alloy is also accompanied by a surface layering enhancement of 6-7 well-defined atomic layers, manifested by an 30-fold enhancement of the intensity of the Bragg-like layering peak in the x-ray specular reflectivity, as compared to that observed for all other metallic liquids measured to date.
At T=C the x-ray reflectivity curve was found to undergo an abrupt change to a different profile, in which the intensity of the reflectivity peak was reduced by a factor of about 5, indicating a first-order surface phase transition. Here we present evidence revealing that at C the quasi-2D crystalline layer undergoes a phase transition into a different crystalline surface phase.
Interest in the Au82Si18 eutectic alloy is due to a number of factors. AuSi has an unusually deep eutectic point: typically the melting point for the eutectic composition is lower by 100-200C than the melting points of its individual pure components. For AuSi the eutectic point (359C) is many hundreds of degrees below the melting points of Au (1063C) or Si (1412C).Massalski The reasons for such an unusually deep eutectic point are still not fully understood and attract, therefore, considerable attention. Remarkably, AuSi also does not form thermodynamically stable crystalline intermetallic compounds for any temperature or composition and this has been speculated to be related to the deep eutectic point. Upon cooling below the eutectic point, Au82Si18 either phase separates into pure Au and pure Si regions, or, if quenched rapidly enough it forms an amorphous solid. AuSi was the first discovered metallic glassDuwez60 and amorphous AuSi can be produced with a variety of techniques, including splat-quenching and evaporation.Weis92
In addition to the fundamentally important questions of its unusual bonding properties, AuSi eutectic has found a variety of practical applications. Both Au and Si are crucial to the electronics industry, and thin gold wires are commonly used to interconnect silicon-based devices. The low melting point of the eutectic alloy, the eutectic’s deep and narrow shape in the phase diagram, and the lack of intermetallic crystalline compounds have resulted in AuSi being used as a low-melting solder for Micro- and Nano-Electro-Mechanical Systems (MEMS and NEMS).Cohn96 ; Cheng00 The same properties are employed to manufacture high-purity Si nanowires and other nanostructures from AuSi alloys through a vapor-solid-liquid growth mechanism. Wagner64 ; Plass97 ; Hu99 ; Hannon06 ; Kodambaka07 Finally, extensive work has been done over the last 20 years on thin solid films of AuSi, among other metal-semiconductor compounds, in connection with Schottky barrier diode devices.
Despite of the large amount of research performed on solid bulk and thin solid films of amorphous AuSi phases, remarkably little is known about the properties of the liquid AuSi eutectic alloy, in particular about atomic structure and the compositional variations in the near-surface region. The Gibbs segregation rule predicts a significant enhancement (65-85 at. %) of Si in the surface monolayer,Gibbs which would result in a local composition that is far from the eutectic composition of 18 at. % of Si. The high brightness of the x-ray beams generated by modern synchrotron sources, in combination with the high-precision liquid surface reflectometers available at some at these sources,Lin03 make possible detailed, atomic resolution, investigations of the near-surface structure of liquids. These methods are employed here to determine the surface structure of the AuSi eutectic over an extended temperature range from its melting point up.
II Experiment
X-ray measurements were carried out at ChemMatCARS, APS, Argonne National Laboratory, and at beamline X22B, NSLS, Brookhaven National Laboratory, using x-rays of a wavelengths Å and Å, respectively. A number of measurements were carried out on each of the two different samples used, yielding highly reproducible data.
Each AuSi sample was prepared from 100 g Au82Si18 ingots of 99.99 purity (Goodfellow) melted under UHV conditions (P Torr) in a Mo sample pan. The resultant liquid sample had a diameter of 20 mm, a thickness of 5 mm and a surface radius of curvature of 20 m. Macroscopic surface oxides were scraped off by an in-vacuum Mo scraper. Several hours of Ar+ ion sputtering removed the remaining microscopic oxide traces. The sample temperature was electronically controlled to 0.01 ∘C. Pickup of acoustic noise and mechanical vibrations was eliminated by placing the UHV sample chamber on an active vibration isolation unit mounted on the liquid surface reflectometer.
It is important to describe the experimental steps that were undertaken to guarantee that the signatures of the crystalline surface phase observed in the x-ray diffraction and reflectivity measurements are indeed due to the intrinsic surface structure of the AuSi alloy, rather than being an experimental artifact, such as the formation of an oxide or chemical impurities segregated at the surface. The presence of even minute concentrations of surface impurities would have been detected by surface-sensitive probes, such as x-ray photoemission spectroscopy (XPS) and x-ray fluorescence (XF) measurements performed in grazing incidence geometry. However, no signature of any impurity was, in fact, detected by these techniques. Since these surface probes are capable of detecting even a small fraction of a monolayer of another species, the crystalline monolayer reported here is not likely to be due to impurities. Reproducibility of the data for two AuSi samples make an artifact due to contamination even less likely.
Additional evidence for lack of contamination or oxidation at the surface comes from Ar+ ion sputtering that was applied to the surface during the experiments. Measurements performed while sputtering, immediately after the end of the sputtering session (typically lasting several hours), and a long time (24 hrs) after the sputtering has ended, have produced identical and highly reproducible results. Re-formation of a sputtered-off surface layer by surface segregation of impurities from the bulk or oxidation of the surface under UHV conditions (partial pressure of oxygen and water was less than 10-12 Torr according to in-situ residual gas analysis of the chamber’s contents) should occur within something of the order of an hour (or more), which would have stood out clearly during the series of measurements that were carried out.
Details of the x-ray scattering geometry of the experiments have been previously described in detail.Tostmann99 ; Shpyrko03 ; Shpyrko04a ; Shpyrko_Thesis The x-ray reflectivity, , is the fraction of the intensity of the incident x-rays reflected by a surface, for a grazing angle of incidence . is the surface-normal wavevector transfer, and Å-1 is the critical for total external reflection in our case.AlsNielsen94
For an ideal case of sharply terminated, static, structureless interface, where the electron density profile normal to the surface is a step function, reflectivity is described by the Fresnel law:
| (1) |
where is the critical wavevector, Å is the classical electron radius and is the electron density at the surface. Reflectivity from a real liquid surface deviates from in two significant ways. First, the free surfaces are never ideal, and exhibit a monotonic or a non-monotonic variation of the electron density across the interface between the (constant) value of the vapour and the (constant) value of the bulk. Second, at any finite temperature the surface of every liquid is roughened by thermally excited capillary waves. These waves partially destroy the constructive interference between x-rays reflected from different points on the surface, leading to a Debye-Waller-like reduction of the specularly reflected intensities, the magnitude of which is determined by the liquid’s surface tension, temperature, and the portion of the capillary waves’ spectrum sampled by the reflectometer.Sinha88 ; Pershan99 ; Pershan00
For , is well approximated by:
| (2) |
where is a surface roughness term due to the capillary waves Sinha88 , and is the surface structure factor, given by:Braslau88
| (3) |
Since is a universal function, depending only on the measured , and is obtained from measurements of the off-specular diffuse scattering,Tostmann99 ; Shpyrko03 ; Shpyrko04a can be determined, within a phase factor, AlsNielsen94 from the measured through Eq. (2). This, in turn, allows a determination of the laterally-averaged surface-normal electron density profile from Eq. (3) by a fit to a physically-motivated model for .
For liquid metals a surface-induced layering is observed. Similar to Bragg diffraction from a crystal, constructive interference between x-rays reflected from these well-defined surface-induced atomic layers leads to a significant enhancement of the reflected signal at where Å is the spacing of the atomic layers. In the case of the standard layering observed for most liquid metals, the electron density is typically described by a semi-infinite sum of equidistantly spaced gaussians, normalized to the bulk density :
| (4) |
The widths of the gaussians are defined by , where and are adjustable fit parameters. This form for produces a gradual increase in the Gaussian width with distance below the surface, and a corresponding decrease in their height. Since they are equally spaced, this leads to their gradual merging, yielding eventually a constant density for large . Thus, is inversely related to the decay length for the surface layering. In all liquid metals studied to date the typical layering extends to 3-4 well-defined layers before density oscillations decay to .
The density profile that had to be used to fit the measured AuSi reflectivity curves included N additional layer-representing Gaussians (where usually N=4 or 5), with adjustable densities (), positions () and widths ():
| (5) |
Finally, the properties of the thermally excited capillary waves are governed by the competition between the thermal energy, described by the temperature and the restoring force, provided by the surface tension . Capillary waves induce surface roughness that gives rise to diffuse scattering away from the specular condition, thus reducing . Detailed analysis of the lineshape of the off-specular diffuse scattering intensity allows one to determine the term in Eq. 2.Tostmann99 ; Shpyrko03 ; Shpyrko04a In practice any specular reflectivity measurement involves integration of the off-specular diffuse scattering contributions over the finite resolution function of the detector. Details of the capillary wave theory and the resolution effects on capillary contribution are described elsewhere.Sinha88 ; Tostmann99 ; Shpyrko03 ; Shpyrko04a
III Results
III.1 X-ray Reflectivity
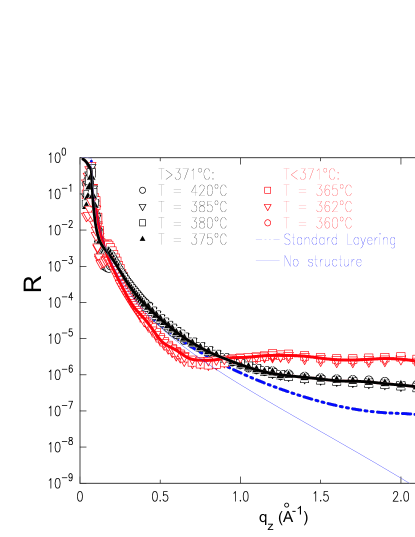
The as-measured and the Fresnel-nomalized x-ray reflectivity curves are shown at five different temperatures in Fig. 1 and Fig. 2, respectively. Two features stand out immediately. The first feature is the bimodal temperature dependence, with a sharp division between the shapes of the low-temperature (T371 ∘C, red symbols) and the high-temperature (T371 ∘C, black symbols) , but with practically no shape variation within each temperature range. The second feature is that in both regimes are much higher than that expected on the basis of the conventional layering that was observed in almost all liquid metals and alloys studied to date. The low- , in particular, exhibits an 30-fold increase over the standard layering peak. The transition temperature between the two regimes, ∘C, was determined by measuring at a fixed while varying , and found to be hysteresis-free to within our ∘C -resolution Shpyrko06 .
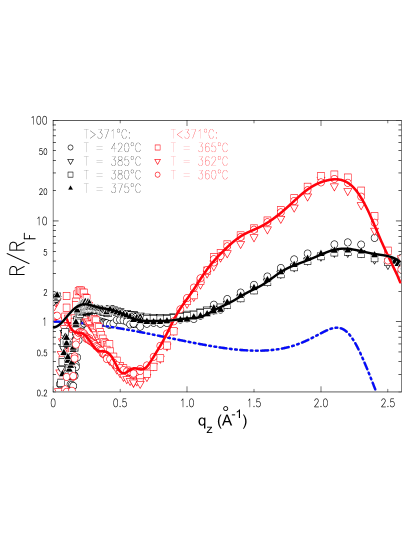
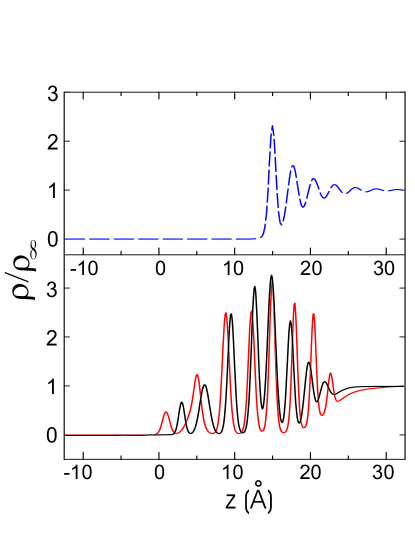
The model fits shown in lines in Figs. 1 and 2, yield the electron density profiles plotted in Fig. 3, along with that expected from conventional layering in AuSi. It should be noted that some specific details of the density profile cannot be determined uniquely from such fits, due primarily to the relatively large number of the adjustable parameters in using density model in Eq. 5. This model includes N=4-5 adjustable layers in addition to 3-4 layers employed in fitting conventional surface layering. Specifically, the precise positions, relative intensities and widths of the layers are correlated, albeit weakly, and fits of similar quality could be obtained by correlated variations in the values of several of these parameters within restricted ranges of values. Some of these ambiguities can be lifted by taking into account the physical details of the density model - for example, a layer cannot be narrower than the diameter of the atom, and the density can not rise above that of a close-packed layer of atoms. Despite this uncertainty, the main physical features of the fits, such as the existence of at least 6-7 well-defined, atomically sharp, almost periodically ordered layers are essential for reproducing the measured shown in Figs. 1 and 2. These features are, therefore, strongly supported by the measured curves. As Fig. 3 demonstrates, both low- and high- density profiles show a similarly well-ordered surface-normal structure. However, the high- profile exhibits a higher degree of disorder, reflected in fewer and lower layering peaks in Fig. 3. The increased disorder in the high- phase results in a lower intensity of the corresponding quasi-Bragg layering peak of the high- phase curves in Fig. 2 as compared to that of the low- phase . Both low- and high- layering peaks in Fig. 2 are significantly broader than the conventional layering peak, shown in a dash-dot-dot line. This effect is likely due to a slight aperiodicity of the layering, that is also apparent in the density profiles in Fig. 3.
As the electron densities of Au and of Si are, respectively, much higher and much lower than the average density of the alloy, , the relative density of the top surface layer in Fig. 3 implies a Si enrichment relative to the bulk’s composition. Using the fitted density profile and assuming closed-packed homogeneous layers of Au and Si atoms of known diameters, a simple calculation yields a atomic % of Si atoms in the topmost surface layer, in good agreement with the 65-85 atomic % of Si predicted by the Gibbs adsorption rule for an ideal binary solution of AuSi.Gibbs
III.2 Grazing-incidence diffraction
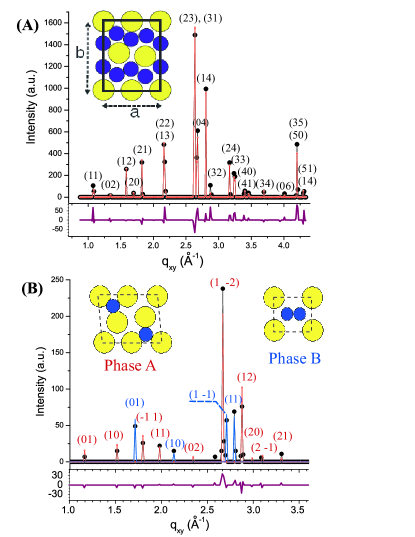
The surface-parallel ordering was explored by grazing-incidence X-ray diffraction (GIXD).Dosch92 ; AlsNielsen94 ; Daillant00 ; Dutta00 X-rays incident on the surface below the critical angle generate an evanescent wave which travels along the surface, and has an amplitude which decays exponentially with depth below the surface, with a 1/e decay length of Å. Thus, the x-rays sample only the top few atomic layers. Scattering by surface-parallel order present in these layers gives rise to GIXD patterns. Such patterns measured for the low- and the high- phases are shown in Fig. 4. In addition to the broad peak arising from the short-range order of the underlying bulk liquid, one can clearly see a number of sharp diffraction peaks indicating existence of long-range in-plane order. This is the first, and so far only, liquid metal or non-dilute alloy to show surface-parallel order. All previous GIXD measurements on liquid metals and non-dilute alloys revealed only a broad liquid-like peak, indicating that despite the increased order in the surface-normal direction, i.e. the surface-induced layering, the order within each layer in the surface-parallel directions remained liquid-like.
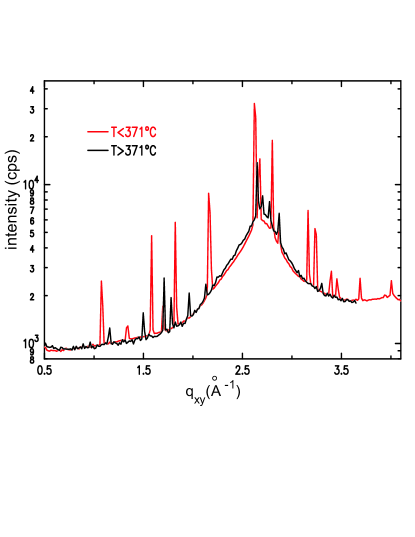
As observed in Fig. 4, the GIXD patterns found above and below ∘C are not identical, implying a change in the lateral order of the surface. This confirms that the sharp structural transition detected in the reflectivity measurements, discussed above, is indeed a first-order solid-solid surface phase transition. We now discus the order in the two phases, as revealed by the GIXD measurements.
Indexing of the GIXD pattern for the low- surface phase has been previously reportedShpyrko06 within a 2D rectangular Å2 unit cell, with a Au4Si8 stoichiometry. This composition is in quantitative agreement with the electron density derived from the fit. The unit cell dimensions, which determine the positions of the peaks observed in the GIXD pattern, were determined using the CRYSFIRE Crysfire powder indexing software. The automatic exhaustive search for the crystallographic structure allowed indexing all observed peaks in a single two-dimensional unit cell. The simplest Bravais lattice symmetry was rectangular, and attempts to fit the data by an oblique Bravais lattice invariably resulted in a primitive unit cell with . A nearly perfect match was obtained for 22 Bragg peaks that were within our measurable range of GIXD measurements, even though some peaks (for example (23) and (31), or (22) and (13) pairs) could not be resolved with resolution provided by the soller slit setup. Positions of atoms within the unit cell were refined using the GSAS, GSAS PowderCell PowderCell and CaRine CaRine software packages. The initial composition was varied from pure Au to pure Si, including Au4Si, Au2Si, AuSi, AuSi2 stoichiometries. While during the diffraction pattern refinement the number of atoms within the unit cell was defined roughly by the requirement of close packing, in principle it is also conceivable that various atoms of quasi-2D crystalline structure are displaced up or down, and are not strictly in the same horizontal (liquid surface-parallel) plane. In fact, such ”puckering” may also be one of the reasons why formation of crystalline 2D layer does not result in the nucleation of a 3D bulk phase. The distribution of the atoms along the surface-normal direction can be obtained, in principle, from a detailed analysis of the intensity distribution along the Bragg rods of the different GIXD peaksRobinson92 , a complete measurement of which has not been done in the present study.
Extensive attempts to index the high- GIXD pattern failed to produce a single unit cell which reproduces all observed peaks without producing additional strong peaks that were not observed experimentally. However, in Fig. 5(B) we show that the pattern is reproduced well by two coexisting oblique two-dimensional unit cells, shown in the inset. Phase A produces 10 GIXD peaks shown in Fig. 5(B) in red. It has a unit cell of Å2 and , containing 4 Au atoms and 2 Si atoms. Phase B (4 GIXD peaks shown in blue) has a smaller unit cell of Å2 and , containing 1 Au atom and 2 Si atoms.
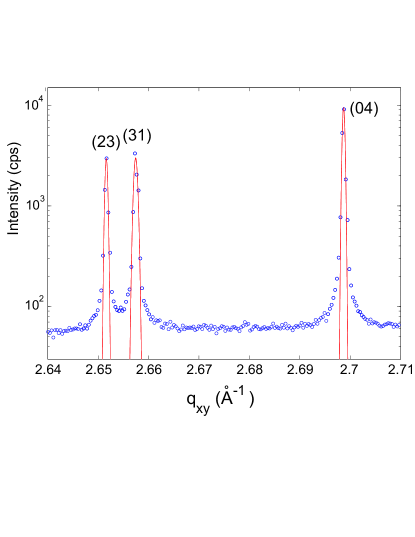
The GIXD data discussed so far was collected with a Soller slit analyzer in front of the detector, providing an in-plane resolution of Å-1.With this resolution, the widths of the diffraction peaks were resolution-limited. The GIXD peaks were remeasured using a double-bounce Bonse-Hart Si(111) analyzer, Bonse having a resolution of Å-1. High-resolution scans of selected peaks are shown in Fig. 6. Application of the Debye-Scherrer formula to the linewidths of low- and high-resolution GIXD lines, as well as stability of GIXD peak intensity during sample rotation imply micron-size crystallites.
The intensities of the GIXD peaks in the high- phase were found to fluctuate with time. This could be assigned to fluctuations in the orientation of the smaller number of larger (Lm) crystallites in this phase. These fluctuations would then bring a randomly varying number of crystallites into and out of the Bragg condition, resulting in peak intensity fluctuations.
The thickness of the quasi-2D crystalline phase can be estimated from the ratio of the integrated intensities of the sharp diffraction peaks to that of the broad liquid bulk peak. This ratio, 0.18, should be approximately equal to the ratio of the thickness of the crystalline phase to the decay length of the evanescent wave. For the Å obtained above, this yields a Å thick crystalline phase, or about a single atomic layer.
III.3 Bragg rod measurements
A more precise estimate of the thickness of the crystalline phase comes from a measurement of the Bragg rods, Robinson92 which are the intensity distributions along at the GIXD peak positions.
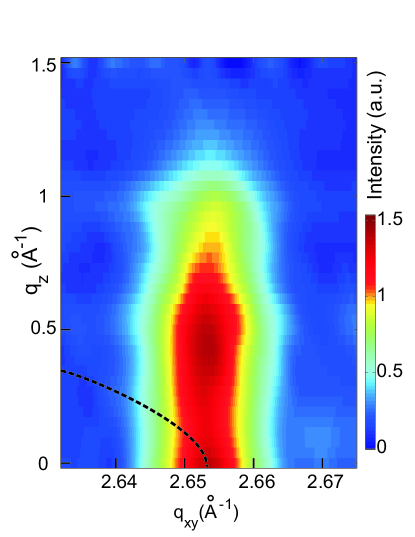
The Bragg rod of the combined (23) and (31) GIXD peaks, observed with the low-resolution setup at Å-1, was measured by employing a fixed incidence angles , and performing a series of scans at several (fixed) exit angles relative to the surface. As observed in Fig. 7, the Bragg rod is oriented along surface-normal () direction, indicating that it originates in a 2D crystal and not in a 3D powder. Had the GIXD peak originated in a 3D powder, a circular ”powder ring”, shown in a dashed line in Fig. 7, would have been observed in the plane. This powder ring is the locus of the Ewald sphere for which the modulus of the scattering vector is a constant value . Clearly, the measured rod does not follow this trajectory, and thus does not originate in a 3D powder.
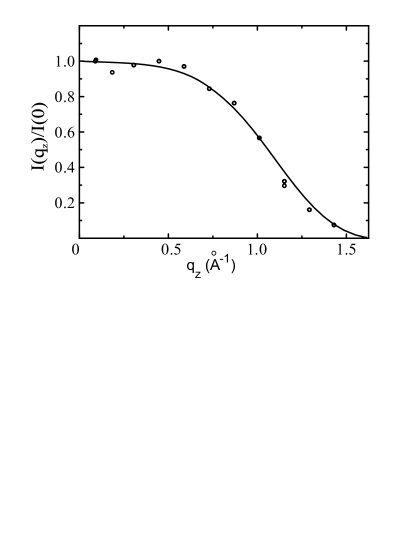
The intensity distribution along the Bragg rod ( direction) is shown in Fig. 8 for the highest-intensity GIXD peak of the low- phase observed at low resolution at Å-1. Had this rod originated in a single, ideally flat planar monolayer the intensity distribution along would have followed the form of the square of the atomic scattering factor of Au. In fact, the atomic scattering factor of Au does not vary by more than a few percent over the 1.5 Å-1 range shown in Fig. 8. However, even for an intrinsically sharp density profile, the surface roughening due to capillary waves would have induced an exponential fall-off in the Bragg rod intensity around Å-1, consistent with the fall-off observed in Fig. 8. It is also possible that the fall-off near 1.5 Å-1 arises from a combination of the capillary roughening and a destructive interference between waves diffracted by the 2D order in two atomic layers. The condition for a destructive interference of waves diffracted from two layers separated by a distance , , yields, in our case, a distance of Å-1. This is about 2/3 of the mean layering distance (i.e. the distance between atomic layers measured along surface normal) observed in the reflectivity measurements discussed above. Moreover, this is also consistent with the Å thickness of the crystalline layer derived at the end of the previous section from the intensity ratio of the sharp GIXD peaks and the broad liquid peak of the bulk. A similar estimation of the layer thickness from the intensity ratios for the high- phase is complicated by the intensity fluctuations of the GIXD peaks, mentioned above. Nevertheless, the crystalline layer thickness of that phase seems to be comparable to that of the low- phase. Clearly, Bragg rod measurements to larger values, and for additional GIXD peaks, are required to elucidate the details of the 2D surface-parallel order in both low- and high- phases, and, in particular, their surface-normal variation.
IV Discussion
Detailed reasons for the formation of quasi-2D crystalline surface layers in the eutectic AuSi alloy have not yet been established. Surface melting (also known as pre-melting), i.e. a formation of a quasi-liquid layer at the surface of a crystal below its bulk melting point is a common and well-documented behavior for a wide range of materials from metals and semiconductors to dielectrics.Frenken85 ; Dash85 The existence of such a liquid-like layer is the main reason for ice being slippery Rosenberg05 as has been first proposed in 1859 by Michael Faraday.Faraday Upon approaching the bulk melting point from below the crystalline structure at the surface starts disordering because of the increased entropy due to the lower number of near-neighbor atoms at the surface. This coexistence of a disordered surface with an ordered bulk is, thus, quite common. By contrast, the reverse effect of the coexistence of a long-range ordered surface with a disordered (liquid) bulk at a high temperature, as observed here, is quite unusual.
Surface freezing, i.e. long-range crystalline in-plane ordering of a surface layer in coexistence with an underlying liquid bulk, has been previously reported in systems composed of long chain molecules.Wu93 ; Dogic03 Several theoretical explanations have been suggested for this effect, all of which (but one) are based on the highly anisotropic shape of the molecules and their large, Å, lengths.Tkachenko96 A different type of surface ordering effect involves crystallization of the higher melting point dilute chemical component in a binary metallic alloy, when it is segregated to the surface, for example the crystallization of a surface-adsorbed monolayer of Pb and of Tl in Ga99.948Pb0.052 Yang99 and Ga99.986Tl0.014 Yang03 alloys, respectively. This phenomenon differs substantially in several respects from the crystalline phase reported here for Au82Si18 in several respects. As our (unpublished) studies of the freezing of a surface-segregated phase in a non-dilute alloy (GaBi) show, the frozen layer (Bi in this case) is a macroscopically thick crystalline surface film. This is not surprising, since once the surface monolayer of pure Bi crystallizes, it serves as a nucleating center for further crystal growth. Second, the crystalline surface phase in eutectic AuSi is not the pure chemical species, as is the case in GaPb and GaTl, and in fact is not a phase that is stable in the bulk at any composition or temperature. Finally, the solid-solid surface phase transition observed in AuSi 12 ∘C above the eutectic point, combined with the stability of the high-temperature crystalline surface phase up to at least 430 ∘C, 70 ∘C above the melting point, are difficult to reconcile within the basic thermodynamics of the AuSi phase diagram.
An intriguing question posed by this study is the underlying reason for the formation of the crystalline monolayer phase at the surface when such crystalline phase are not stable in the bulk. The unusually deep eutectic observed in AuSi, combined with the relative ease of formation of a supercooled liquid and of glassy phases Duwez60 , implies an increase resistance to, and a substantial degree of frustration against, crystal formation in this alloy. The existence of supercooling in liquid metals dates to observations by Turnbull.Turnbull50 Based on these results, Frank proposed Frank52 the existence of a nucleation barrier due to the icosahedral short-range order of the liquid. This prediction was recently confirmed by neutron Schenk02 and x-ray Kelton03 scattering studies on electrostatically levitated supercooled metals and alloys.
Even though it is impossible to construct a long-range periodically ordered 3D bulk phase based on close packing of polytetrahedral structures due to the associated five-fold symmetry, this topological frustration may be lifted at quasi-2D surfaces and interfaces. For example, x-ray studies of liquid-solid interfaces have demonstrated that liquid five-fold symmetry can be observed in monatomic liquid Pb when it is aligned by the crystalline Si substrate.Reichert00 Packing configuration consisting of two different kinds of atoms with substantial size mismatch, as is the case of AuSi eutectic, results in a far more complex topological problem compared to monatomic liquids. However, one can draw an interesting parallel between the low-temperature crystalline phase unit cell structure shown in the inset of Fig.5(A) and the proposed local structure in binary metallic glasses that is based on the idea of overlapping, or interpenetrating clustersMiracle04 ; Sheng06 (compare the inset of Fig.5 (A) with Fig. 3 in Ref. Miracle04 ). Because atoms within the surface layer have the additional freedom of moving slightly up or down (puckering, buckling or relaxation type effects), it is plausible that an otherwise metastable 2D crystalline structure based on the interpenetrating cluster model can be stabilized at the free surface, even if long-range order cannot be extended into the 3D bulk. Aside from these purely topological considerations, surface and bulk electronic properties of the AuSi eutectic alloy are likely to play a crucial role in the formation of the crystalline structure as well. Changes in local chemical composition due to Gibbs adsorption effects are expected to influence the short-range order as well as the electronic behavior in the near surface region. Amorphous AuSi alloys vary from semiconductors for Si-rich compositions, characterized by continuous random network of covalently bonded Si atoms, low packing density and a low atomic coordination number (4 to 5), to metallic-like Au-rich AuSi glasses of a high density due to random hard-sphere packing (high coordination number of 8-9).Weis92 Since Si is expected to have a lower surface tension than that of Au,Gibbs the chemical composition of liquid AuSi alloys evolves from Si-rich at the surface to Au-rich in the bulk, resulting in a non-trivial evolution of the electronic and the structural properties.Filonenko69
Thin solid films composed of metal-semiconductor alloys have been an active area of research because of their interest for Schottky diode devices.Xie88 ; Cros92 The crystalline surface phase reported here does not resemble those of pure Au, pure Si or any of the reported metastable bulk intermetalics.Okamoto83 Because of the metastable nature of solid gold silicides, details of reported intermetallic structures strongly depend on the methods of the film deposition method, substrate surface type and preparation, annealing temperature and duration, as well as other variables. An additional difficulty is the accurate characterization of sub-nanometer thick layers sandwiched between a solid substrate and a thick film of pure Au or Si. However, crystalline phases with unit cell dimensions Å2, similar to our low-T phase, were reported in thin Au films deposited on a Si(111) surface.Green76 ; Green81 While no reliable thicknesses could be deduced for these phases from the low-energy electron diffraction (LEED) and Auger electron spectroscopy techniques that were used, sputtering studies indicate that the thickness of crystalline gold silicide phases is in the range of 2-9 Å.Green81
Our investigations of other eutectic binary alloys involving Au and elements of the IV semiconductor group, namely AuSn Balagurusamy07 and AuGe (unpublished data) do not exhibit any evidence for surface freezing effects akin to those reported here for AuSi. For these alloys the layering peak in the x-ray reflectivity signal is considerably weaker than that for AuSi, and is consistent with a simple layering model comprising 3-4 atomic layers. Their GIXD shows no sharp diffraction peaks that would indicate the existence of a long-range crystalline in-plane order in the near-surface region of the liquid alloy. It is notable that the Au72Ge28 eutectic shows nearly the same melting point (C) as the Au82Si18 eutectic. Melting point of pure Ge, 938 ∘C, is however much lower than that of Si (1410 ∘C). The size mismatch between Au and Si is much greater than that between Au and Ge. While both AuGe and AuSi exhibit no stable intermetalic compounds, Au and Si are not mutually soluble in solid form, but solid Ge is weakly soluble in solid Au.Massalski These properties imply that the mismatch between atomic size is greater and the bonding of unlike species weaker in AuSi (evidenced by strong covalent Si-Si bond Chen67 ) than in AuGe.
Further insight into the detailed reasons for the formation of these unusual quasi-2D crystalline surface phases in coexistence with the underlying liquid bulk might be ascertained from theoretical and computer simulations of the evolution of the electronic, chemical and structural properties of the near-surface region of the AuSi eutectic, as well as future experimental studies of the atomic structure of related liquid metal alloys. Because of the close proximity of the eutectic temperatures and Au compositions of AuSi and AuGe alloys, one of the very promising approaches is the study of the evolution of surface order in liquid ternary eutectic AuSiGe alloys upon variation of Ge composition from zero up.
Finally, we note that the recent electron microscopy studies of the atomic structure of liquid metals at their interface with a solidDonnelly02 ; Oh05 , detailed investigation of the chemistry of the vapor-liquid-solidHannon06 and the vapor-solid-solid Kodambaka07 Si and Ge nanowire growth mechanisms, as well as direct visualization of alternative crystallization pathways in nanoscopic metallic droplets of AuGe alloys Sutter07 are related to the present study and our results might provide a better basis for understanding this rich phenomena.
Acknowledgements.
This work was supported by the U.S. Department of Energy (DOE) grant DE-FG02-88-ER45379 and the U.S.-Israel Binational Science Foundation, Jerusalem. Work at Brookhaven National Laboratory is supported by U.S. DOE contract DE-AC02-98CH10886. ChemMatCARS Sector 15 is principally supported by NSF/DOE grant CHE0087817. The Advanced Photon Source is supported by the U.S. DOE contract W-31-109-Eng-38. Authors would like to acknowledge Jeff Gebhardt and Frank Westferro for their contribution in making and testing of the crystal analyzer. Discussions with Dr Stefan Mechler (Harvard)are gratefully acknowledged.References
- [1] O. M. Magnussen, B. M. Ocko, M.J. Regan, K. Penanen, P.S. Pershan, and M. Deutsch, Phys. Rev. Lett. 74, 4444 (1995).
- [2] M. J. Regan, E. H. Kawamoto, S. Lee, P. S. Pershan, N. Maskil, M. Deutsch, O. M. Magnussen, and B. M. Ocko, Phys. Rev. Lett. 75, 2498 (1995).
- [3] N. Lei, Z. Q. Huang, and S. A. Rice, J. Chem. Phys. 104, 4802 (1996).
- [4] N. Lei, Z. Huang, and S. A. Rice, J. Chem. Phys. 107, 4051 (1997).
- [5] M. J. Regan, P. S. Pershan, O. M. Magnussen, B. M. Ocko, M. Deutsch, and L. E. Berman, Phys. Rev. B 55, 15874 (1997).
- [6] H. Tostmann, E. DiMasi, O. G. Shpyrko, P. S. Pershan, B. M. Ocko, and M. Deutsch, Ber. Bunsenges. Phys. Chem. 102, 1136 (1998).
- [7] E. Dimasi, H. Tostmann, B. M. Ocko, P. S. Pershan, and M. Deutsch, Phys. Rev. B 58, 13419 (1998).
- [8] H. Tostmann, E. DiMasi, P. S. Pershan, B. M. Ocko, O. G. Shpyrko, and M. Deutsch, Phys. Rev. B 59, 783 (1999).
- [9] B. Yang, D. Gidalevitz, D. Li, Z-q. Huang, and S. A. Rice Proc. Natl. Acad. Sci. U.S.A. 96, 13009 (1999).
- [10] B. Yang, D. Li, Z. Huang, and S. A. Rice, hys. Rev. B 62, 13111 (2000).
- [11] H. Tostmann, E. DiMasi, O. G. Shpyrko, P. S. Pershan, B. M. Ocko, and M. Deutsch, Phys. Rev. Lett. 84, 4385 (2000).
- [12] E. DiMasi, H. Tostmann, O. G. Shpyrko, M. Deutsch, P. S. Pershan, and B. M. Ocko, J. Phys. Cond. Mat. 12, 209 (2000).
- [13] E. DiMasi, H. Tostmann, O. G. Shpyrko, P. Huber, B. M. Ocko, P. S. Pershan, M. Deutsch, and L. E. Berman, Phys. Rev. Lett. 86, 1538 (2001).
- [14] P. Huber, O. Shpyrko, P.S. Pershan, E. DiMasi, B.M. Ocko, H. Tostmann, and M. Deutsch, Colloids Surf. A 206, 515 (2002).
- [15] P. Huber, O. G. Shpyrko, P. S. Pershan, B. M. Ocko, E. DiMasi, and M. Deutsch, Phys. Rev. Lett. 89, 035502 (2002).
- [16] P. Huber, O. G. Shpyrko, P. S. Pershan, B. M. Ocko, E. DiMasi, and M. Deutsch Phys. Rev. B 68, 085409 (2003).
- [17] D. X. Li, B. Yang, and S. A. Rice, Phys. Rev. B 65, 224202 (2002).
- [18] B. Yang, D. X. Li, and S. A. Rice, Phys. Rev. B 67, 054203 (2003).
- [19] O. G. Shpyrko, P. Huber, P. S. Pershan, B. M. Ocko, H. Tostmann, A. Grigoriev, and M. Deutsch, Phys. Rev. B 67, 115405 (2003).
- [20] O. G. Shpyrko, A. Yu. Grigoriev, C. Steimer, P. S. Pershan, B. Lin, M. Meron, T. Graber, J. Gebhardt, B. Ocko, and M. Deutsch, Phys. Rev. B 70, 224206 (2004).
- [21] D. X. Li, B. Yang, and S. A. Rice, J. Chem. Phys. 122, 224702 (2005).
- [22] O. G. Shpyrko, A. Yu. Grigoriev, R. Streitel, D. Pontoni, P. S. Pershan, B. M. Ocko, and M. Deutsch, Phys. Rev. Lett. 95, 106103 (2005).
- [23] V. S. K. Balagurusamy, R. Streitel, O. G. Shpyrko, P. S. Pershan, M. Meron, and B. Lin, Phys. Rev. B 75, 104209 (2007).
- [24] O. G. Shpyrko, R. Streitel, V. S. K. Balagurusamy, A. Y. Grigoriev, M. Deutsch, B. M. Ocko, M. Meron, B. Lin, and P. S. Pershan, Science 313, 77 (2006).
- [25] T. B. Massalski, ed., Binary Phase Diagrams, (American Society for Metals, Metals Park, Ohio, 1987).
- [26] W. Klement Jr., R. H. Willens, and P. Duwez, Nature 187, 869 (1960).
- [27] J. Weissmüller, J. Non-Cryst. Solids 142, 70 (1992).
- [28] M. B. Cohn, Y. Liang, R. T. Howe, and A. P. Pisano, Proc. IEEE Solid-State Sensor Actuator Workshop, 32 (1996).
- [29] Y. T. Cheng, L. W. Lin, and K. Najafi, J. Microelectromech. Syst. 9, 3 (2000).
- [30] R. S. Wagner and W. C. Ellis, Appl. Phys. Lett. 4, 89 (1964).
- [31] R. Plass and L. D. Marks, Surf. Sci. 380, 497 (1997).
- [32] J. Hu, T. W. Odom, C. M. Lieber, Acc. Chem. Res. 32, 435 (1999).
- [33] J. B. Hannon, S. Kodambaka, F. M. Ross, and R. M. Tromp, Nature 440, 69 (2006).
- [34] S. Kodambaka, J. Tersoff, M. C. Reuter, and F. M. Ross, Science 316, 729 (2007).
- [35] Surface tension values of Au and Si at 370 ∘C were extrapolated to 1270-1300 mN/m for Au and 860-1000 mN/m for Si. Such large uncertainty is due to a large temperature range over which extrapolation from melting points of pure metals was carried out (700 ∘C and 1030 ∘C for Au and Si, respectively). Application of Guggenheim equation, assuming interaction parameter set to zero results in 65-85 at. of Si in the near-surface monolayer, in contrast with 19 at. of Si in the bulk.
- [36] B. Lin, M. Meron, J. Gebhardt, T. Graber, M. L. Schlossman, and P. J. Viccaro, Physica B 336, 75 (2003).
- [37] O. G. Shpyrko, M. Fukuto, P. S. Pershan, B. M. Ocko, M. Deutsch, and I. Kuzmenko, Phys. Rev. B 69, 245423 (2004).
- [38] O. G. Shpyrko, Ph.D. thesis, Harvard University, 2004 (unpublished).
- [39] S. K. Sinha, E. B. Sirota, S. Garoff, and H. B. Stanley, Phys. Rev. B 38, 2297 (1988).
- [40] P. S. Pershan, Synch. Rad. News 12, 10 (1999).
- [41] P. S. Pershan, Colloids Surf. A 171, 149 (2000).
- [42] A. Braslau, P. S. Pershan, G. Swislow, B. M. Ocko, and J. Als-Nielsen, Phys. Rev. A 38, 2457 (1988).
- [43] H. Dosch, Springer Tracts in Modern Physics 126, 1 (1992).
- [44] J. Als-Nielsen, D. Jacquemain, K. Kjaer, F. Leveiller, M. Lahav, and L. Leiserowitz, Phys. Rep. 246, 252 (1994).
- [45] J. Daillant and M. Alba, Rep. Prog. Phys. 63, 1725 (2000).
- [46] P. Dutta, Curr. Sci. 78, 1478 (2000).
- [47] R. Shirley, CRYSFIRE Suite (Lattice Press, Surrey, England, 1999); J.W. Visser, J. Appl. Crystallogr. 2, 89 (1969); R. Shirley and D. Louer, Acta Crystallogr. A34, S382 (1978).
- [48] A. C. Larson and R. B. Von Dreele, Los Alamos National Laboratory Report LAUR pp. 86-748 (2000); B. H. Toby, J. Appl. Cryst. 34, 210-213 (2001).
- [49] G. Nolze and W. Kraus, Powder Diffr. 13, 256 (1998).
- [50] CaRine Crystallography Computer Software Code, URL: http://pros.orange.fr/carine.crystallography
- [51] R. J. Birgeneau and J. D. Litster, J. Phys. Lett. (Paris) 39, 399 (1978).
- [52] U. Bonse and M. Hart, Appl. Phys. Lett. 7, 238 (1965).
- [53] see, e.g., A. Guinier, X-Ray Diffraction in Crystals, Imperfect Crystals, and Amorphous Bodies (Dover Publication, New York, 1994), pp. 121-125; B. E. Warren, X-Ray Diffraction (Dover, New York, 1990), pp. 251-253.
- [54] I. K. Robinson and D. J. Tweet, Rep. Prog. Phys. 55, 599 (1992).
- [55] J. W. M. Frenken and J. F. Van der Veen, Phys. Rev. Lett. 54, 134 (1985).
- [56] J. G. Dash, Phys. Today 38, 26 (1985); J. G. Dash, Contemp. Phys. 30, 89 (1989).
- [57] R. Rosenberg, Phys. Today 58, 50 (2005).
- [58] M. Faraday, Philos. Mag. Ser. 4 17, 162 (1859); M. Faraday, Proc. R. Soc. London 10, 440 (1860).
- [59] X. Z. Wu, B. M. Ocko, E. B. Sirota, S. K. Sinha, and M. Deutsch, Science 261, 1018 (1993); X. Z. Wu, E. B. Sirota, S. K. Sinha, B. M. Ocko, and M. Deutsch, Phys. Rev. Lett. 70, 958 (1993); E. Sloutskin, X.Z. Wu, T. B. Peterson, O. Gang, B. M. Ocko, E. B. Sirota, and M. Deutsch, Phys. Rev. E 68, 031605 (2003).
- [60] Z. Dogic, Phys. Rev. Lett. 91, 165701 (2003).
- [61] F. A. M. Leermakers and M. A. Cohen-Stuart, Phys. Rev. Lett. 76,82 (1996); E. B. Sirota, X. Z. Wu, B. M. Ocko, and M. Deutsch, Phys. Rev. Lett. 79, 531 (1997); A. V. Tkachenko and Y. Rabin, Phys. Rev. Lett. 76, 2527 (1996); A. J. Colussi, M. R. Hoffmann, and Y. Tang, Langmuir 16, 5213 (2000); M. Kawamata and T. Yamamoto, J. Phys. Soc. Jpn. 66, 2350 (1997); P. Smith, R. M. Lynden-Bell, J. C. Earnshaw, and W. Smith, Mol. Phys 96, 249 (1999).
- [62] D. Turnbull and R. E. Cech, J. Appl. Phys. 21, 804 (1950); D. Turnbull, J. Chem. Phys. 20, 411 (1952).
- [63] F. C. Frank, Proc. Royal Soc. London A 215, 43 (1952).
- [64] T. Schenk, D. Holland-Moritz, V. Simonet, R. Bellissent, and D. M. Herlach, Phys. Rev. Lett. 89, 075507 (2002).
- [65] K. F. Kelton, G. W. Lee, A. K. Gangopadhyay, R. W. Hyers, T. J. Rathz, J. R. Rogers, M. B. Robinson, and D. S. Robinson, Phys. Rev. Lett. 90, 195504 (2003).
- [66] H. Reichert, O. Klein, H. Dosch, M. Denk, V. Honkimäki, T. Lippmann, and G. Reiter, Nature 408, 839 (2000).
- [67] D. B. Miracle, Nature Mater. 3, 697 (2004).
- [68] H. W. Sheng, W. K. Luo, F. M. Alamgir, J. M. Bai, and E. Ma, Nature 439, 419 (2006).
- [69] V. A. Filonenko, Russ. J. Phys. Chem. 43, 874 (1969).
- [70] A. Cros and P. Muret, Mat. Sci. Rep 8, 271 (1992).
- [71] X. D. Xie and K. M. Zhang, Prog. Surf. Sci 28, 71 (1988).
- [72] H. Okamoto and T. B. Massalski, Bull. Alloy Phase Diagr. 4, 190 (1983); R. R. Chromik, L. Zavalij, M. D. Johnson, and E. J. Cotts, J. Appl. Phys. 91, 8992 (2002).
- [73] A. K. Green and E. Bauer, J. Appl. Phys. 47, 1284 (1976).
- [74] A. K. Green and E. Bauer, J. Appl. Phys. 52, 5098 (1981).
- [75] H. S. Chen and D. Turnbull, J. Appl. Phys. 38, 3646 (1967).
- [76] S. E. Donnelly, R. C. Birtcher, C. W. Allen, I. Morrison, K. Furuya, M. Song, K. Mitsuishi, and U. Dahmen, Science 296, 507(2002).
- [77] S. H. Oh, Y. Kauffmann, C. Scheu, W. D. Kaplan, and M. Rühle, Science 310, 661 (2005).
- [78] P. W. Sutter and E. A. Sutter, Nat. Mater. 6, 363 (2007).