Geometrical frustration in liquid Fe and Fe-based metallic glass
Abstract
We investigate short range order in liquid and supercooled liquid Fe and Fe-based metallic glass using ab-initio simulation methods. We analyze the data to quantify the degree of local icosahedral and polytetrahedral order and to understand the role of alloying in controlling the degree of geometric frustration. Comparing elemental Fe to Cu Ganesh and Widom (2006) we find that the degree of icosahedral order is greater in Fe than in Cu, possibly because icosahedral disclination line defects are more easily incorporated into BCC environments than FCC. In Fe-based metallic glass-forming alloys (FeB and FeZrB) we find that introducing small concentrations of small B atoms and large Zr atoms controls the frustration of local icosahedral order.
pacs:
61.43.Dq,61.20.Ja,61.25.MvI Introduction
As noted by Frank Frank (1952), the local icosahedral clustering of 12 atoms about a sphere is energetically preferred because it is made up entirely of four-atom tetrahedra, the densest-packed cluster possible. However, local icosahedral order cannot be propagated throughout space without introducing defects. Frustration of packing icosahedra is relieved in a curved space, where a perfect 12-coordinated icosahedral packing exists Sadoc and Mosseri (1982); Nelson (1983); Sethna (1983). We adopt this structure as an ideal reference against which actual configurations will be compared.
Disclination line defects of type may be introduced into this icosahedral crystal and thereby control the curvature. In order to “flatten” the structure and embed it in ordinary three dimensional space an excess of disclinations is needed, and these cause increased coordination numbers of 14, 15 or 16. Large atoms, if present, would naturally assume high coordination numbers and aid in the formation of a disclination line network. Similarly, smaller atoms would naturally assume low coordination numbers of 8, 9 or 10, and have positive disclinations attached to them, increasing the frustration. For a particular coordination number, it may be possible to construct a cluster, known as a Kasper-Polyhedron (see Section III.3), made entirely of tetrahedrons.
Honeycutt and Andersen Honeycutt and Andersen (1987) introduced a method to count the number of tetrahedra surrounding an interatomic bond. This number is 5 for icosahedral order with no disclination, 6 for a disclination and 4 for a disclination. Steinhardt, Nelson and Ronchetti Steinhardt et al. (1983) introduced the orientational order parameter to demonstrate short range icosahedral order. We employ both methods to analyze icosahedral order in supercooled metals and metal alloys, in addition to conventional radial distribution functions, structure factors and Voronoi analysis.
Many simulations have been performed on pure elemental metals and metal alloys using model potentials, Tomida and Egami (1995); Kuiying et al. (1995); Sadigh and Grimvall (1996); Lee et al. (2003), but do not necessarily produce reliable structures owing to their imperfect description of interatomic interactions. First principles (ab-initio) calculations achieve the most realistic possible structures, unhindered by the intrinsic inaccuracy of phenomenological potentials and with the ability to accurately capture the chemical natures of different elements and alloys. The trade-off for increased accuracy is a decrease in the system sizes one can study, so only local order can be observed, not long range. Also runs are limited to short time scales. Early ab-initio studies on liquid Copper Pasquarello et al. (1992); Kresse and Hafner (1993); Valladares (2006) and Iron Alfe et al. (2000) were not analyzed from the perspective of icosahedral ordering. Recent ab-initio studies on Ni and Zr Jakse and Pasturel (2004, 2003) find that the degree of icosahedral ordering increases with supercooling in Ni, while in Zr BCC is more favored. Studies on binary metal alloys by Jakse et al. Jakse (2004); Jakse et al. (2005) and by Sheng et al Sheng et al. (2006) quantify local icosahedral order in the alloys. We previously Ganesh and Widom (2006) investigated icosahedral order in liquid and supercooled Cu.
Elemental metals crystallize so easily that they can hardly be made amorphous at any quench rate. Alloying can improve the ease of glass formation. For some special alloys, a bulk amorphous state can be reached by slow cooling. Pure elemental Fe is a poor glass former, but Fe-based compounds like FeB and especially FeZrB, show improved glass formability. We augment our molecular-dynamics simulation with another algorithm called ‘Tempering’ or ‘replica exchange method’ (REM) Swendsen and Wang (1986); Yamamoto and Kob (2000) for fast equilibration at low temperatures.
In comparison to liquid and supercooled liquid Copper Ganesh and Widom (2006) which show only weak icosahedral order and very little temperature variation, Fe showed a monotonic increase in icosahedral order, which became very pronounced when supercooled. Analysis of quenched Fe revealed a natural way of introducing 5-fold coordinated bonds plus a single -72∘ disclination line segment into an otherwise perfect BCC environment, without disturbing the surrounding structure. Addition of B to Fe decreased the icosahedral order, due to the positive disclinations centered on the smaller B atom which increased frustration. Further inclusion of larger Zr atoms to form FeZrB found an enhanced icosahedral order compared to FeB. This could possibly be explained by formation of negative disclination line defects Nelson and Widom (1984) anchored on the larger Zr atoms, which eases the frustration of icosahedral order on the Fe atoms.
At high temperatures all of our measured structural properties of liquid Cu Ganesh and Widom (2006) and liquid Fe resembled each other, and also resembled a maximally random jammed Torquato et al. (2000) hard sphere configuration. This suggests that a nearly universal structure exists for systems whose energetics are dominated by repulsive central forces.
II Tempering Molecular Dynamics (TMD) and other Simulation Details
One reason alloys form glass more easily is that chemical identity introduces a new configurational degree of freedom that evolves slowly Greer (1993); Desre (1995). Unfortunately, this makes simulation more difficult. It is especially difficult to equilibrate the system at very low temperatures, because the probability to cross an energy barrier drops, trapping it in particular configurations. For this reason we use a Monte-Carlo method, known as tempering or replica exchange Swendsen and Wang (1986); Yamamoto and Kob (2000) to augment our first-principles MD, allowing us to sample the configurational space more efficiently than conventional MD.
In the canonical ensemble, energy fluctuates at fixed temperature. A given configuration with energy can occur at any temperature with probability proportional to , (). Now consider a pair of configurations, and of energy and occurring in simulations at temperatures and . We can take as a member of the ensemble at , and as a member of the ensemble at , with a probability
| (1) |
without disturbing the temperature-dependent probability distributions of energy (or any other equilibrium property). Because each run remains in equilibrium at all times even though its temperature changes, we effectively simulate a vanishingly low quench rate.
In practice we perform several MD simulations at temperatures separated by 100K. We use ultrasoft pseudopotentials Vanderbilt (1990) as provided with VASP Kresse and Hafner (1994) to perform the MD simulation. All calculations are ’’ point calculations (a single ’k’ point). All runs use an MD time step of 2 fs, and reach total simulated time of order 1.5-1.8 ps (see Table 1) with a total of N=100 atoms. Every 10 MD steps we compare the energies of configurations at adjacent temperatures and swap them with the above probability. Eventually, configurations initially frozen at low temperature reach a higher temperature. The simulations then can carry the structure over energy barriers, after which the temperature can again drop.
| Chemical Species | Temperatures(K) | density (Å-3) | time (ps) |
|---|---|---|---|
| Fe100 | 800-1900 | 0.0756 | 1.5 |
| Fe80B20 | 800-1500 | 0.0814 | 1.8 |
| Fe70Zr10B20 | 800-1800 | 0.0787 | 1.8 |
In an effort to explore the structures of compounds with differing glass-forming ability we compare pure elemental Iron and two Iron-based glass-forming alloys. Tempering MD requires that we perform simulations at a constant density for all the temperatures, but we have no rigorous means of predicting the density at high temperature. For pure liquid Iron, the density is known experimentally Waseda (1980), and we use this value. For FeB and FeZrB, we took a high temperature liquid structure and quenched it, relaxing positions and cell lattice parameters, to predict a low temperature density. We then decreased the density of the relaxed structure by 6 percent to account for volume expansion, to arrive at the densities used in our liquid simulations.
Because of the efficient sampling of our tempering MD method, the structure of pure Fe partially crystallizes at low temperatures after about 1 ps. In the following discussion of our T=800K sample we will refer to different structural features before and after crystallization. We also performed several long (2.0ps) conventional first-principles MD at T=800K yielding results similar to the results of tempering MD prior to crystallization.
For all runs we employed spin polarization, reasoning that local magnetic moments exist even above the Curie point. These local moments have a significant influence on the short-range order because ferromagnetic Iron prefers a longer bond length than paramagnetic Iron Moroni et al. (1997). Of course, the ferromagnetic state of the liquid implies improper long-range correlations. Unfortunately, since our forces are calculated for electronic ground states, we cannot rigorously model the true paramagnetic state of liquid Iron and Iron-based alloys with these methods.
III Pure Fe
III.1 Radial Distribution Function
The radial distribution function, , is proportional to the density of atoms at a distance from another atom and is calculated here by forming a histogram of bond lengths. We use the repeated image method to obtain the bond lengths greater than half the box size and anticipate in this range may be influenced by finite size effects. Further, we smooth out the histogram with a gaussian of standard deviation 0.05Å.
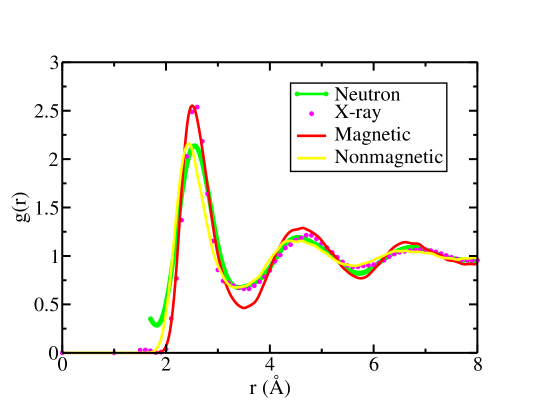
To evaluate the role of magnetism, Fig. 1 illustrates the radial distribution functions for liquid Fe simulated at T=1800K, just below melting (Tm=1833K). Evidently, the simulation with magnetism yields good agreement in the position and height of the first peak in with experimental X-ray Waseda (1980), while neglect of magnetic moments results in near neighbor bonds that are too short and too weak. However, magnetism overestimates the strength of long-range correlations beyond the nearest-neighbor peak, while neglecting magnetism yields reasonably accurate long-range . Nevertheless, for the present study of local order, it is necessary to make spin polarized calculations, to get the short range correlations and hence the local order correct. Strangely, a recent experimental neutron Schenk et al. (2002) has a shorter and broader first peak compared to both our magnetic and to the from the prior X-ray diffraction experiment Waseda (1980). The positions of the different maxima and minima in our simulated magnetic compare well with both the experiments. The position of the first peak in our magnetic is shifted by 0.05Å to the left of the neutron first peak. The X-ray experiment doesn’t have enough data points around the first maximum to determine the peak position accurately.
We calculate the coordination number by counting the number of atoms within a cutoff distance from a central atom. We choose the cutoff distance () at the first minimum of . For pure Fe the minimum is at =3.5 Å. The precise location of the minimum is difficult to locate, and its variation with temperature is smaller than the error in locating its position, so that we don’t change the value of with temperature. With this value of we find an average coordination number () of 13.2 which is nearly independent of temperature ( changes from 13.1 at high temperature to 13.3 with supercooling).
III.2 Liquid Structure Factor S(q)
The liquid structure factor is related to the radial distribution function of a liquid with density by,
| (2) |
One needs the radial distribution function up to large values of to get a good . In our first principles simulation, we are restricted to small values of , due to our small system sizes, so we need a method to get from our limited function. Baxter developed a method Baxter (1970); Jolly et al. (1976) to extend beyond the size of the simulation cell. The method exploits the short range nature of the direct correlation function , which has a range similar to the interatomic interactions Foiles and Ashcroft (1984), as opposed to which is long ranged.
Assuming that vanishes beyond a certain cutoff distance , we solve the Baxter’s equations iteratively to obtain the full direct correlation function for . From we calculate the structure factor by a standard Fourier Transform. The showed good convergence with different choices of . A choice of =5Å seemed appropriate because it was one half of our smallest simulation cell edge length. Even though in metals there are long range oscillatory Friedel oscillations, our ability to truncate at =5Å shows that these are weak compared with short range interactions. An application of this method to obtain of Cu Ganesh and Widom (2006) showed excellent agreement with the experimental .
The simulated for pure Fe at T=1800K (see Fig. 2) is compared to recent neutron scattering experiments at T=1830K. Even though the positions of the different peaks compare very well, there is serious discrepancy in their heights. Especially, the height of the first peak of our simulated is higher than that of the experiments. This discrepancy is expected because we include magnetism, which gives accurate short-range correlations while overestimating the long-range ones (see Fig. 1). But the cause of the discrepency is not entirely clear since a comparison of the simulated structure factor of Ni Jakse and Pasturel (2004) (done without including magnetism) with neutron scattering experiments Schenk et al. (2002) shows similar discrepancies between their ’s.
A sum rule can be obtained for Norman (1957); Krogh-Moe (1956). By inverting the fourier transform of Eq. 2 and then taking the limit, one gets
| (3) |
in the limit . Further, the integral is supposed to oscillate with about the limiting value as . Using our we observed that the integral is consistent with the sum rule and oscillates nicely about the limiting value for Å-1, while using the from the neutron scattering experiments Schenk et al. (2002), we observe a positive drift in the mean value about which the integral oscillates. Such a drift could indicate the presence of spurious background corrections. The from the X-ray experiment Waseda (1980) seems to be in good agreement with the ideal sum rule.
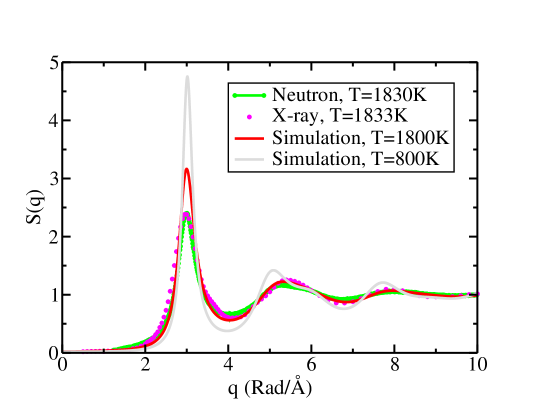
As we lower the temperature, the peak heights in grow, indicating an increase in short range order with supercooling. We also observe a slight shoulder in the second peak of the (Fig. 2), which grows with supercooling. The split second peak positions are in the ratios of 20:12 and 24:12 with respect to the first peak positions, just what one would ideally observe if there was icosahedral order Nelson and Widom (1984); Sachdev and Nelson (1984).
III.3 Bond Orientation Order Parameter
| Cluster | No. of atoms | Voronoi type | |
|---|---|---|---|
| HCP | 12 | (0,12,0) | -0.012 |
| FCC | 12 | (0,12,0) | -0.013 |
| BCC | 14 | (0,6,0,8) | +0.013 |
| Z8 | 8 | (0,4,4) | +0.010 |
| Z9 | 9 | (0,3,6) | -0.038 |
| Z10 | 10 | (0,2,8) | -0.093 |
| Z12 | 12 | (0,0,12) | -0.169 |
| Z14 | 14 | (0,0,12,2) | -0.093 |
| Z15 | 15 | (0,0,12,3) | -0.037 |
| Z16 | 16 | (0,0,12,4) | +0.013 |
Steinhardt, et al. Steinhardt et al. (1983) introduced the parameters as a measure of the local orientational order in liquids and undercooled liquids. To calculate , the orientations of bonds from an atom to its neighboring atoms are projected onto a basis of spherical harmonics. Rotationally invariant combinations of coefficients are then averaged over many atoms in an ensemble of configurations. The resulting measures of local orientational order can be used as order parameters to characterize the liquid structures. For an ideal icosahedral cluster, is the minimum value of for which . Table 2 enumerates values for different ideal clusters. The ideal icosahedral value of is far from other clusters, making it a good icosahedral order indicator.
Kasper-Polyhedrons Doye and Wales (1996); Nelson (1983); Frank and Kasper (1958) are polyhedrons which minimize the number of disclinations for a particular coordination number. The series Z8-Z16 in Table. 2 are such Kasper-Polyhedrons but with the added constraint that the surface atoms be triangulated with equilateral triangles. The icosahedron with a coordination of 12 is one such Kasper-Polyhedron with no disclinations. Adding disclinations to the icosahedron, one finds that each disclination increases the value by the same amount irrespective of its sign.
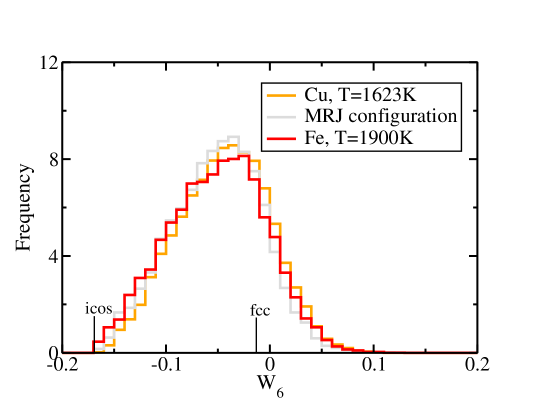
As before, we choose the cutoff distance to specify near neighbors as Å. For pure Fe at high temperatures, resembles that of high temperature liquid Cu Ganesh and Widom (2006), which in turn resembles the maximally random jammed configuration of hard spheres Torquato et al. (2000)(Fig. 3). On this basis we suggest that the MRJ configuration represents an idealized structure that is universal for strongly repulsive interactions. All pure metallic systems might approach this ideal structure at sufficiently high temperature.
However, as temperature drops the distribution shifts strongly to the left, with a pronounced increase in -0.1 (Fig. 4). This indicates a rather high concentration of nearly icosahedral clusters in supercooled liquid Fe. Even at very low percentages of supercooling of Cu ( 3% Ganesh and Widom (2006)) and Fe ( 2%, not shown), Fe shows a clear enhancement in the negative distribution as compared to Cu.
We checked the distribution of a non-magnetic simulation to see if it is strongly influenced by magnetism, and found a nearly identical result. In particular, we still found a strong enhancement of the nearly icosahedral clusters relative to liquid Cu or pure Fe at high temperature.
III.4 Voronoi Analysis
| Voronoi | Fe | FeB | FeZrB | |||
| type | supercooled | defective | supercooled | supercooled | ||
| liquid | crystal | liquid | liquid | |||
| 800K | relaxed | 800K | relaxed | 800K | 800K | |
| (0,0,12) | 8.3 | 11.0 | 5.0 | 0.0 | 0.6 | 1.4 |
| (0,0,12,2) | 2.1 | 3.6 | 2.0 | 2.0 | 0.5 | 0.3 |
| (0,2,10,{0,1}) | 6.2 | 6.8 | 2.0 | 0.0 | 4.4 | 7.1 |
| (0,1,10,2) | 3.6 | 5.4 | 3.0 | 0.0 | 2.1 | 3.1 |
| (0,4,8,{0,1,2,3}) | 7.9 | 4.8 | 10.0 | 6.0 | 8.6 | 9.4 |
| (0,3,8,{0,1,2,3}) | 6.8 | 6.0 | 12.0 | 0.0 | 4.3 | 8.3 |
| (0,2,8,{1,2,3,4}) | 3.0 | 3.0 | 3.0 | 0.0 | 0.0 | 0.0 |
| (0,3,6,4) | 2.1 | 2.2 | 2.0 | 6.0 | 0.0 | 0.0 |
| (0,5,4,4) | 1.5 | 1.2 | 3.0 | 18.0 | 0.0 | 0.0 |
| (0,6,0,8) | 0.0 | 0.4 | 0.0 | 56.0 | 0.0 | 0.0 |
To explain the origin of this low peak in pure Fe, we performed a Voronoi analysis Finney (1970) of the liquid before and during crystallization. A Voronoi polyhedron is described by indices where denotes the number of faces with edges. For example (0,0,12) denotes an icosahedron, while (0,0,12,2) denotes a 14-coordinated (Z14) atom, with 12 5-fold bonds and 2 6-fold bonds. The (0,0,12,2) is a characteristic TCP (tetragonal close-packed) structure of the Frank-Kasper type, with a disclination line running through an otherwise perfect icosahedron. In a body-centered cubic crystal all atoms are of Voronoi type (0,6,0,8), which is an alternate 14-coordinated structure.
Supercooled liquid Fe at T=800K (Table 3) contains a high fraction of icosahedral atoms of type (0,0,12) and (0,0,12,2) . Those with Voronoi type (0,2,10,{0,1}) and (0,1,10,2) also have very negative , so that they can be thought of as related to the icosahedron. Together, they explain the enhanced negative distribution. Supercooled Cu (which shows weak icosahedral order) and high temperature Fe (T=1900K), in contrast contain about 1.2% of (0,0,12) and no (0,0,12,2). The MRJ configuration contains 1.2% (0,0,12) but no (0,0,12,2).
Strikingly, the icosahedral clusters tend to join in pairs and strings of 3 atoms in length. An instantaneous quench of a particular liquid structure at 800K which had a high fraction of icosahedral units, using conjugate gradient relaxation of the atomic coordinates and lattice parameters, shows a clear enhancement of the icosahedral and other closely related units. The strings of icosahedral units found in the supercooled liquid connected to form networks. A quench starting from a different instantaneous supercooled liquid structure at 800K containing fewer icosahedral structures resulted in rapid crystallization. This indicates that the presence of icosahedrons may inhibit crystallization. Similar quenches, starting from instantaneous liquid structures at higher temperatures, also resulted in relaxed structures with some of them showing a high negative distribution comparable to the distribution at 800K. The quenches that partially crystallized showed a high fraction of BCC (0,6,0,8)’s ( 40%) and was always accompanied by a high fraction of (0,5,4,4)’s ( 25%), which are otherwise absent or very low in the liquid.
Under TMD the supercooled liquid at T=800K eventually crystallizes, with the distribution peaked strongly around zero consistent with the value for ordinary crystalline clusters, but retaining a subset of atoms with nearly icosahedral -0.14. Not surprisingly, these were precisely the atoms that had Voronoi type (0,0,12) prior to crystallization. The Z14 (0,0,12,2) atoms (with -0.093) were mutual near-neighbors, linked along their 6-fold () bonds, and also were neighbors of the nearly icosahedral atoms.
We quenched this sample by conjugate gradient relaxation of atomic coordinates and lattice parameters. After relaxation we found 56 atoms had BCC Voronoi type (0,6,0,8). Six icosahedral atoms became 12-coordinated (0,4,8) structures surrounding the bond connecting the two (0,0,12,2) disclinated icosahedral atoms, which retained their type. The remaining atoms served to link the cluster of icosahedron-related atoms to the surrounding defect-free BCC crystal.
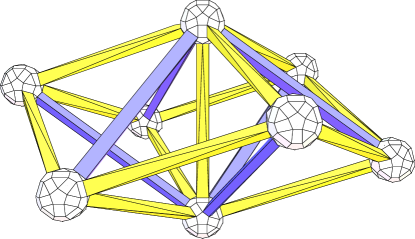
The icosahedron-related structure thus forms a point defect in an otherwise perfect BCC crystal. A simple way to create this defect is to take two consecutive triangles surrounding a near-neighbor bond along the BCC [1,1,1] direction (see Fig. 5), displace them into the perpendicular bisecting plane and rotate by 30∘. The atoms along the [1,1,1] bond are now connected to each other by a six-fold bond ( disclination) and are connected to the six displaced atoms by five-fold bonds. This scheme to transform a BCC rhombic dodecahedron into a Frank-Kasper Z14 polyhedron was described in Ref Kraposhin et al. (2002); Khmelevskaya et al. (1998) in an attempt to explain certain diffraction anamolies in iron and vanadium-based alloys under ion irradiation.
Manually removing the defect, by reversing the above procedure then relaxing, yields a perfect BCC crystal with all atoms in a (0,6,0,8) Voronoi environment. We also embedded the point defect in an otherwise perfect BCC crystal with 128 atoms in a cubic box. Relaxation showed that the defect was stable. The energy of the defect was 6.18eV and the fractional volume increase was 0.013.
Since tungsten, like Iron, crystallizes in BCC, we performed a separate first-principles simulation of liquid Tungsten. After supercooling by 13% to T=3200K, we found the histogram resembled that of Fe at 1600K (which is 15% supercooled). A Voronoi analysis revealed a similar percentage of (0,0,12)’s and (0,0,12,2)’s in both these elemental BCC-forming metals. Hence we believe the relationship between BCC and icosahedral structures may be linked to our observed high fraction of icosahedra in liquid Fe as compared to Cu. This may also explain the reason why we are able to supercool BCC Fe more deeply than FCC Cu in our simulations.
We also included an icosahedron point defect inside an otherwise perfect FCC crystal of Cu, with 256 atoms in a cubic box. Relaxation showed that the defect was stable. The energy cost of the defect was 4.69eV and the fractional volume increase was 0.012. Even though this FCC defect cost less energy than the point defect in BCC, and also needs little rearrangement of atoms as reflected by the slightly lower fractional density change, we do not see a significant icosahedral order in liquid Cu, when compared to liquid Fe. This could be because the number of icosahedrons that a single Z14 disclination can stabilize (up to six) is greater than one. So even an equal number of the two different defects in BCC and FCC would result in more icosahedral order in BCC than in FCC.
III.5 Honeycutt and Andersen analysis
Honeycutt and Andersen Honeycutt and Andersen (1987) introduced a useful assessment of local structure surrounding interatomic bonds. We employ a simplified form of their analysis, counting the number of common neighbors shared by a pair of near-neighbor atoms. This identifies the number of atoms surrounding the near-neighbor bond and usually equals the number of edge-sharing tetrahedra whose common edge is the near-neighbor bond. We assign a set of three indices to each bond. The first index is 1 if the root pair is bonded (separation less than or equal to ). The second index is the number of near-neighbor atoms common to the root pair, and the third index gives the number of near-neighbor bonds between these common neighbors. We take the same value of =3.5Å as mentioned before. Note that the Honeycutt and Andersen fractions depend sensitively on , making precise quantitative comparisons with other prior studies difficult.
In general, 142’s are characteristic of close packed structures (FCC and HCP) and 143’s are characteristic of distorted icosahedra Luo et al. (2004). They can also be considered as disclinations Sadoc and Mosseri (1982); Nelson (1983); Sethna (1983). Likewise, 15’s are characteristic of icosahedra, with 155’s characterizing perfect icosahedra while 154’s and 143’s characterize distorted ones. 16’s indicate disclinations. 166’s and 144’s are also characteristic of BCC.
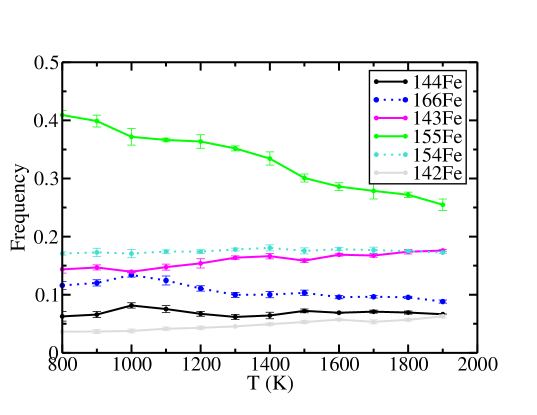
A Honeycutt and Andersen analysis for pure Fe, with an =3.5Å (Fig. 6), showed that with supercooling the fraction of 15 bonds rises from 0.46 at T=1900K to 0.59 at T=800K in the liquid before crystallization. The fraction of 155’s (characteristic of perfect icosahedra) was always larger than 154’s (characteristic of distorted icosahedra), and seemed to be steeply increasing with supercooling as opposed to 154’s, which were relatively flat. The fraction of 14 bonds drop from 0.32 to 0.30, with the icosahedral 143’s being always higher than the cubic 142’s. The 144’s, which are characteristic of BCC remain nearly flat, even though the 166’s show a slight increase. The ease of embedding a Z14 disclination in BCC Fe (see section III.4) might explain the slight increase in the 166’s.
IV Fe-B and Fe-Zr-B
IV.1 Radial Distribution Function
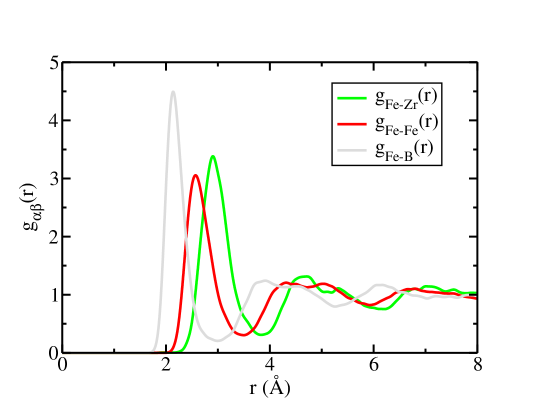
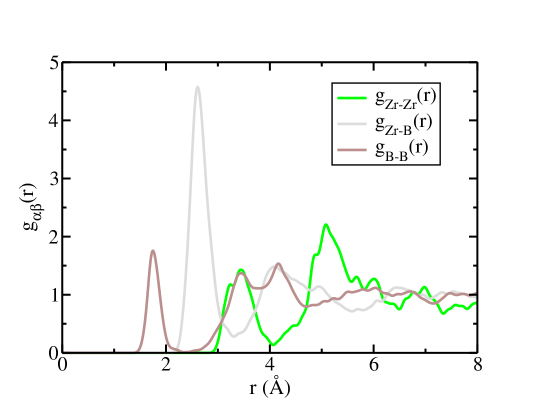
Fig. 7 shows the pair correlation functions of supercooled FeZrB at T=800K. From the heights of the first peaks, we see that the strongest bonds form between the metalloid (B) and the metal (Fe or Zr). The relative bond lengths reveal, as expected, that B behaves as a small atom, Fe is medium sized and Zr is large. Comparing simulations of FeZrB to pure Fe, we find that is reduced by alloying with B or ZrB, because Fe prefers to associate with B or Zr rather than with Fe.
| FeFe | FeB | BFe | BB | |
|---|---|---|---|---|
| 3.4 | 3.0 | 3.0 | 2.3 | |
| 12.0 | 2.2 | 8.9 | 0.4 |
| FeFe | FeZr | FeB | ZrFe | ZrZr | ZrB | BFe | BZr | BB | |
| 3.4 | 3.8 | 3.0 | 3.8 | 4.0 | 3.3 | 3.0 | 3.3 | 2.4 | |
| 9.5 | 2.0 | 2.0 | 14.0 | 0.9 | 2.8 | 6.8 | 1.4 | 0.4 |
To calculate the coordination number, define as the average number of atoms of type around an atom of type , We set at the first minima of the partial radial distribution functions (Fig. 7). We list the partial coordination numbers of FeB in Table. 4 and FeZrB in Table. 5 (averaged over all the temperatures since the temperature dependence is very weak and non-monotonic). The average value of decreases with alloying, due to decrease in the concentration of Fe and the preference to bind with B and Zr. Zr, being a large atom, has a larger coordination number. Also note that B and Zr favor each other more than themselves. We do find some B-B pairs in the liquid state.
IV.2 Liquid Structure Factor S(q)
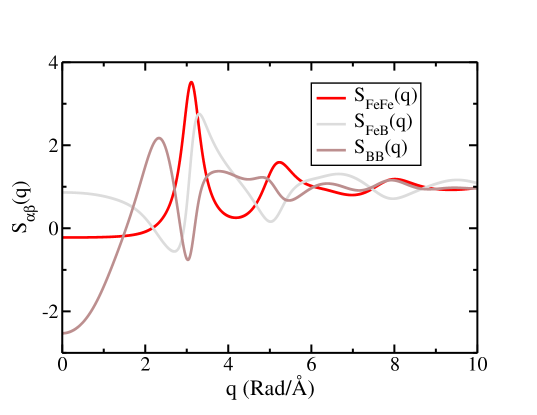
Fig. 8 shows the Faber-Ziman Fischer et al. (2006) partial structure factors of FeB at the lowest simulated temperature of T=800K, defined as,
| (4) |
The positions of the first and second peaks in partial is in very good agreement with the experimental results for amorphous FeB Nold et al. (181). Also, at the position of the splitting of the second peak in , as observed in the experiments, we observe a slight shoulder. Similarly, the positions of the different peaks in and are in agreement with the experiments.
For FeB, the limit of is comparable to the experimental value. The limit in the other two partials differ from the experiment, more seriously than . We think that this discrepancy in the long wavelength regime is probably due to the very low density of B in our system leading to poor statistics. Nevertheless, the excellent agreement in the positions of the different peaks in the partial structure factors shows that we have reasonably good representative structures of FeB at T=800K. Partial structure factors or partial pair distribution functions are not available experimentally to compare with FeZrB simulations.
IV.3 Bond Orientation Order Parameter
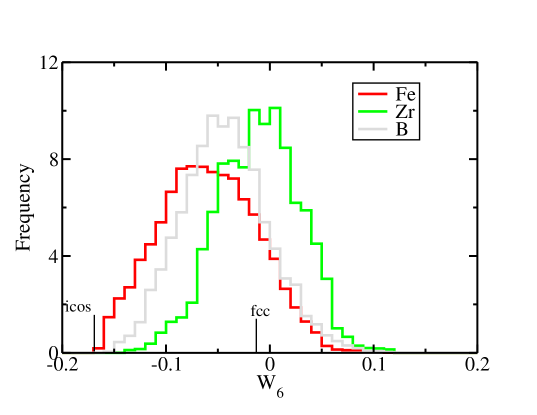
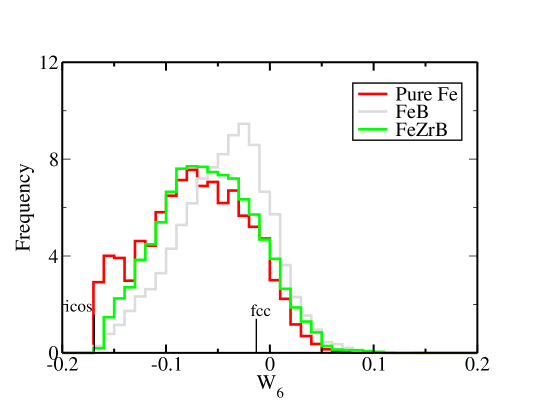
To define the distribution in an alloy, we concentrate on central atoms of some particular species (e.g. Fe) but consider the neighboring atoms of all species. We chose the near-neighbor cutoff distances as before. Compare the Fe-based distributions at their supercooled temperatures in Fig. 4. The origin of high negative values for pure Fe was previously explained in section III.4. Replacing a few medium sized Fe atoms with smaller B atoms causes negative disclination lines to concentrate on Fe, leading to a drop in the ideal icosahedral clustering on these Fe atoms and strongly reducing the extreme negative values of in FeB. On the contrary, inclusion of Zr in FeZrB causes negative disclinations to attach to Zr, easing frustration, leading to more Fe centered clusters with icosahedral ordering and increasing the negative region of , as compared to FeB. Inclusion of the big Zr atom enhances icosahedral order on the Fe atoms.
Fig. 9 shows the distributions for FeZrB with centers at Fe, Zr and B. The histogram with the center at Zr is almost symmetric about the value of zero. This suggests that the local environment about Zr atoms is nearly spherical, as is expected given its large size. The B centered histogram is also asymmetric towards negative values due to Kasper-Polyhedrons and slightly distorted versions of them (see Table. 2 and Section III.3).
IV.4 Voronoi Analysis
A Voronoi analysis was performed for FeB in the supercooled liquid at T=800K (Table 3). The Fe environments were mostly (0,4,8,x) or (0,3,8,x) types, where x={0,1,2,3,4}, with the higher coordination polyhedron being more favored. This was followed by the very negative valued (0,0,12), (0,2,10,x)’s and (0,1,10,2)’s Voronoi types occurring at lower frequency than in pure Fe. Boron mainly had environments of type (0,3,6)’s ( 15% of B atoms) (Kasper polyhedron for Z=9 containing a disclination) and (0,5,4)’s ( 20%). These types are typical of the tri-capped trigonal prism (TTP) and the mono-capped square archimedean prism (a slightly distorted variant of TTP) respectively. The TTP is found in the crystal structures of Fe3B with Pearson symbols oP16 and tI32. The distorted (0,5,4) version is found in the structure Fe23B6 of Pearson type cF116. These structures have been identified as the leading competitors for B-Fe glass Mihalkovic and Widom (2004). Boron also took environments of the Kasper polyhedron (0,4,4) ( 3%) corresponding to Z=8 and (0,2,8) ( 10%) corresponding to Z=10. The association of B with disclinations explains how it increases the frustration of icosahedral order on the Fe atoms. Clearly the improved glass-formability of FeB compared with elemental Fe cannot be due to icosahedral order. Rather, it is presumed to be caused by the deep eutectic at Fe83B17.
A Voronoi analysis of supercooled FeZrB at T=800K shows a clear increase in the very negative polyhedrons, and also a decrease in the number of Z14 (0,0,12,2) types on Fe atoms indicating a decrease in frustration in the ternary as compared to the binary. Environments around B atoms were roughly similar in the binary and the ternary, with a slight increase in the lower coordinated (Z=8) Kasper polyhedrons at the cost of higher coordinated (Z=10) ones. Zirconium took a variety of polyhedra, with an average coordination of 17.6 and a minimal coordination of 15, owing to its large size compared to the other constituents.
IV.5 Honeycutt and Andersen analysis
| Root Pair | ||||||
| Fe-Fe | Fe-Zr | Fe-B | Zr-Zr | Zr-B | B-B | |
| 14 pairs | 0.30 | 0.19 | 0.54 | 0.11 | 0.55 | 0.75 |
| 142 pairs | 0.08 | 0.06 | 0.03 | 0.06 | 0.03 | 0.02 |
| 143 pairs | 0.17 | 0.11 | 0.35 | 0.04 | 0.33 | 0.33 |
| 144 pairs | 0.05 | 0.02 | 0.17 | 0.01 | 0.19 | 0.41 |
| 15 pairs | 0.56 | 0.53 | 0.39 | 0.48 | 0.41 | 0.18 |
| 154 pairs | 0.22 | 0.27 | 0.03 | 0.36 | 0.04 | 0.0 |
| 155 pairs | 0.33 | 0.22 | 0.37 | 0.08 | 0.36 | 0.17 |
| 16 pairs | 0.10 | 0.24 | 0.01 | 0.36 | 0.01 | 0.01 |
| 166 pairs | 0.09 | 0.20 | 0.0 | 0.26 | 0.00 | 0.00 |
We made a HA analysis of the ternary glassy alloy, by looking at root pairs of chemical species and , choosing in the manner of the analysis. The frequency is normalized to sum to one for each species pair . Table 6 lists the fraction of different pairs in supercooled FeZrB.
Among the pairs with Fe as one of the root pairs, the 15’s are most abundant at all temperatures. The 15’s are mainly comprised of 155’s and the 154’s, with the 155’s being always higher than the 154’s. The percentage of 15’s is similar for FeZrB, FeB as well as pure Fe. Note that the 15’s are largest for the Fe-Fe pairs. They also show a steady enhancement with supercooling, unlike the 14’s which decrease with supercooling. Among the 14’s, the icosahedron-related 143’s for all root pairs are always higher than the close-packed 142’s, and remain fairly constant with supercooling. The 14’s are maximal for FeB root pairs and minimal for FeZr.
Supercooled pure Fe has a high percentage of “16”’s (13%) compared to pure Cu (7%). The high number of “16”’s in Fe is related to the occurance of Z14 (0,0,12,2) environments in which the 6-fold bond carries a disclination, rather than the BCC 14 atom arrangement which would also show a high degree of four-fold and six-fold bonds (section III.4). Adding B to Fe, shows an increase of “16”’s for Fe-Fe pairs to 21% in FeB (not shown). Adding large Zr atoms to FeB decreases the occurance of 16’s on the Fe-Fe pairs, putting them on Fe-Zr pairs and easing the frustration of Fe centers. This causes the geometry about Fe centers to be more icosahedral, and hence the shift of the towards negative values.
Among the root pairs not containing Fe, note that the B-B pair has the maximum 14’s ( disclinations), especially 144’s, while the Zr-Zr pair has the maximum 16’s ( disclinations), especially the 166’s, emphasizing the role of size in controlling the frustration in alloys.
V Conclusion
This study quantifies icosahedral and polytetrahedral order in supercooled liquid metals and alloys. This is the first such analysis of glass-forming Fe compounds using configurations from first-principles simulations. While the structural properties of Fe and Cu strongly resemble each other at high temperature, and indeed are close to a maximally random jammed structure Torquato et al. (2000); Ganesh and Widom (2006), their behavior evolves substantially, and in different manners, as the liquid is supercooled. Proper modeling of atomic interactions is essential to capture the differing behavior of each element, and use of a first-principles simulation is the most reliable means of achieving this.
For pure elements we find the degree of local icosahedral order in the supercooled liquid depends on the low temperature crystal structure, with BCC metals such as Fe and W accommodating icosahedra more readily than the FCC element Cu. Alloying with large or small atoms can further influence the degree of icosahedral order, with small atoms (e.g. B in Fe) aggravating the frustration by introducing positive disclination line defects, while large atoms (e.g. Zr in Fe) naturally stabilize negative disclination line defects, relieving frustration on the medium-sized Fe atoms. While the enhanced glass-forming ability of FeB compared to Fe cannot be related to icosahedral order, we suggest that the formation of icosahedral order and disclination line network, together with the slow dynamics of chemical ordering in a complex alloy and the destabilization of competing crystal phases Mihalkovic and Widom (2004), enhances the glass-forming ability of FeZrB compared with FeB.
Acknowledgements.
This work was supported in part by DARPA/ONR grant N00014-01-1-0961.References
- Ganesh and Widom (2006) P. Ganesh and M. Widom, Phys. Rev. B 74, 134205 (2006).
- Frank (1952) F. C. Frank, Proc. R. Soc. London A 215, 43 (1952).
- Sadoc and Mosseri (1982) J. F. Sadoc and R. Mosseri, Phil. Mag. B 45, 467 (1982).
- Nelson (1983) D. R. Nelson, Phys. Rev. Lett. 50, 92 (1983).
- Sethna (1983) J. P. Sethna, Phys. Rev. Lett. 51, 2198 (1983).
- Honeycutt and Andersen (1987) J. D. Honeycutt and H. C. Andersen, J. Phys. Chem. 91, 4950 (1987).
- Steinhardt et al. (1983) P. J. Steinhardt, D. R. Nelson, and M. Ronchetti, Phys. Rev. B 28, 784 (1983).
- Tomida and Egami (1995) T. Tomida and T. Egami, Phys. Rev. B 52, 3290 (1995).
- Kuiying et al. (1995) C. Kuiying, L. Hongbo, L. Xiaoping, H. Quiyong, and H. Zhuangqi, J. Phys. Condens. Matter 7, 2379 (1995).
- Sadigh and Grimvall (1996) B. Sadigh and G. Grimvall, Phys. Rev. B 54, 15742 (1996).
- Lee et al. (2003) H. J. Lee, T. Cagin, W. L. Johnson, and W. A. Goddard, J. Chem. Phys. 119, 9858 (2003).
- Pasquarello et al. (1992) A. Pasquarello, K. Laasonen, R. Car, C. Lee, and D. Vanderbilt, Phys. Rev. Letts. 69, 1982 (1992).
- Kresse and Hafner (1993) G. Kresse and J. Hafner, Phys. Rev. B 48, 13115 (1993).
- Valladares (2006) A. A. Valladares, J. Non-Crystalline Solids (2006), (to be published).
- Alfe et al. (2000) D. Alfe, G. Kresse, and M. J. Gillan, Phys. Rev. B 61, 132 (2000).
- Jakse and Pasturel (2004) N. Jakse and A. Pasturel, J. Chem. Phys. 120, 6124 (2004).
- Jakse and Pasturel (2003) N. Jakse and A. Pasturel, Phys. Rev. Lett. 91, 195501 (2003).
- Jakse (2004) N. Jakse, Phys. Rev. Lett. 93, 207801 (2004).
- Jakse et al. (2005) N. Jakse, O. L. Bacq, and A. Pasturel, J. Chem. Phys. 123, 104508 (2005).
- Sheng et al. (2006) H. W. Sheng, W. K. Luo, F. M. Alamgir, J. M. Bai, and E. Ma, Nature 439, 419 (2006).
- Swendsen and Wang (1986) R. H. Swendsen and J. S. Wang, Phys. Rev. Lett. 57, 2607 (1986).
- Yamamoto and Kob (2000) R. Yamamoto and W. Kob, Phys. Rev. E 61, 5473 (2000).
- Nelson and Widom (1984) D. R. Nelson and M. Widom, Nucl. Phys. B 240, 113 (1984).
- Torquato et al. (2000) S. Torquato, T. M. Truskett, and P. G. Debenedetti, Phys. Rev. Lett. 84, 2064 (2000).
- Greer (1993) A. L. Greer, Nature 366, 303 (1993).
- Desre (1995) P. J. Desre, Mater. Sci. Forum 179-181, 713 (1995).
- Vanderbilt (1990) D. Vanderbilt, Phys. Rev. B 41, 7892 (1990).
- Kresse and Hafner (1994) G. Kresse and J. Hafner, J. Phys. Condens. Matter 6, 8245 (1994).
- Waseda (1980) Y. Waseda, The Structure of Non-Crystalline Materials (1980), (McGraw-Hill, New York).
- Moroni et al. (1997) E. Moroni, G. Kresse, J. Hafner, and J. Furthmuller, Phys. Rev. B 56, 15629 (1997).
- Schenk et al. (2002) T. Schenk, D. Holland-Moritz, V. Simonet, R. Bellisent, and D. M. Herlach, Phys. Rev. Lett. 89, 075507 (2002).
- Baxter (1970) R. J. Baxter, J. Chem. Phys 52, 4559 (1970).
- Jolly et al. (1976) D. J. Jolly, B. C. Freasier, and R. J. Bearman, Chem. Phys 15, 237 (1976).
- Foiles and Ashcroft (1984) S. M. Foiles and N. W. Ashcroft, J. Chem. Phys 81, 6140 (1984).
- Norman (1957) N. Norman, Acta Cryst. 10, 370 (1957).
- Krogh-Moe (1956) J. Krogh-Moe, Acta Cryst. 9, 951 (1956).
- Sachdev and Nelson (1984) S. Sachdev and D. R. Nelson, Phys. Rev. Lett. 53, 1947 (1984).
- Doye and Wales (1996) J. P. K. Doye and D. J. Wales, J. Phys. B 29, 4859 (1996).
- Frank and Kasper (1958) F. C. Frank and J. S. Kasper, Acta Cryst. 11, 184 (1958).
- Finney (1970) J. L. Finney, Proc. R. Soc. A 319, 479 (1970).
- Kraposhin et al. (2002) V. S. Kraposhin, A. L. Talis, and J. M. Dubois, J. Phys.: Condens. Matter 14, 8987 (2002).
- Khmelevskaya et al. (1998) V. S. Khmelevskaya, V. S. Kraposhin, and V. G. Malynkin, Int. J. Non-Equilib. Process. 10, 323 (1998).
- Luo et al. (2004) W. K. Luo, H. W. Sheng, F. M. Alamgir, J. M. Bai, J. H. He, and E. Ma, Phys. Rev. Lett. 92, 145502 (2004).
- Fischer et al. (2006) H. E. Fischer, A. C. barnes, and P. S. Salmon, Rep. Prog. Phys. 69, 233 (2006).
- Nold et al. (181) E. Nold, P. Lamparter, H. Olbrich, G. Rainer-Harbach, and S. Steeb, Z. Naturforsch 36a, 1032 (181).
- Mihalkovic and Widom (2004) M. Mihalkovic and M. Widom, Phys. Rev. B 70, 144107 (2004).