Multiband and impurity effects in infrared and optical spectra of MgB2
Abstract
A short review of the optical and far-infrared measurements on MgB2 is given. Multiband and multigap effects are analyzed by comparing optical properties with other experiments and ab initio calculations. The covered topics are: the plasma frequency, electron-phonon interaction, impurity scattering, the effects of C and Al substitution, interband transitions and the far-infrared signatures of the superconducting gaps.
keywords:
MgB2; Optical and infrared spectra; Plasma frequency; Electron-phonon interaction; Interband transitions; Superconducting gap1 Introduction
The existence of two distinct superconducting gaps in a combination with a comfortably high of 40 K in MgB2 offers a unique opportunity to study the electrodynamics of a multigap superconductor. The effects of interband coupling and scattering on the superconducting order parameter and were envisaged long time ago [1], but only after the discovery of superconductivity in magnesium diboride [2] the community was given a real chance to study the phenomenon experimentally. MgB2 seems to be a very unusual case of ’conventional’ superconductivity, where the novel multiband and multigap physics can be well captured by ab initio calculations of the electron and phonon dispersions, electron-phonon interaction and properly modified strong coupling Eliashberg formalism [3]. As a result, a rather direct quantitative comparison between theory and various experimental probes is plausible, in contrast to the case of high- cuprates with an important role of electron correlations and still debated mechanism of superconductivity.
Electronic band structure is the starting point to understand the unusual superconducting properties of MgB2. The first-principles calculations that exist since the late 1970’s [4] were refined after 2001 by several groups [5, 6, 7, 8, 9]. Angle-resolved photoemission (ARPES) [10] and de Haas-van Alphen (dHvA) measurement [11] showed a good agreement with the calculated band dispersion. The two-gap behavior, first predicted theoretically [12], was confirmed by tunneling spectroscopy [13, 14], specific heat [15], ARPES [16], Raman [17] and other techniques.
Until recently, the agreement of optical data with theoretical predictions has been far less successful. Perhaps, the most notable and serious issue was an extremely small plasma frequency reported from several early optical studies [18, 19, 20, 21, 22]. More recent studies [23, 24, 25] showed that the plasma frequency is actually much closer to the expected value, although optics results call for certain amendments to the theory. The main problem in obtaining reasonably reproducible optical data is the very small size of the existing high-quality single crystals [26, 27].
The electron-phonon interaction, which is responsible for the superconductivity in MgB2 as suggested by the isotope effect [28, 29], inevitably manifests itself via the energy dependent renormalization of the scattering rate and the effective mass. The latter parameters can be derived from the optical spectra already in the normal state, provided that the correct plasma frequency is available. Single crystal measurements [23] have shown a reasonably good agreement with the ab initio calculations [6, 12, 9] and confirmed a stronger electron-phonon coupling in the bands.
While the biggest controversies regarding the general normal-state optical properties of MgB2 seem to be settled, the main issue related to far-infrared spectra in the superconducting state, namely the absence of a clear evidence of the two-gap structure, still remains. Unlike the situation with early optical measurements on magnesium diboride, a number of different far-infrared experiments, especially those on thin films, are quite consistent with each other. Therefore we have to ask ourselves whether the existing theory describes adequately the infrared optical response of a two-gap superconductor.
The organization of this paper is as follows: In Section 2 some basic considerations regarding the multiband conductivity are given. Section 3 deals with the experimental determination of the plasma frequency. In Section 4 the electron-phonon and impurity scattering as observed by optics are discussed. Interband transitions are considered in Section 5. Finally, the far-infrared signatures of the superconducting gap(s) are reviewed in Section 6.
2 Conductivity of a multiband system
The two main contributions to the complex optical conductivity of a metal are the intraband (Drude) component centered at zero frequency and the one due to momentum conserving interband transitions
| (1) |
The detailed theory of multiband transport based on the Boltzmann equation was developed in Ref.[30]. A widely used approximation for the Drude conductivity of a system with several conduction bands is the parallel-resistors formula, where each resistor (or better say conductor) corresponds to a separate band. Although this seems like assuming that quasiparticles in different bands do not ’see’ each other, the impurity or phonon induced interband scattering probabilities to a certain approximation can be just added to the intraband ones, resulting in a parallel band conduction with effectively renormalized scattering rates.
The metallic properties of MgB2 are determined by two distinct types of electronic bands coming almost entirely from the boron states: the strongly covalent almost two-dimensional bands formed by hybridized orbitals and the more isotropic bands made of orbitals. The holes in the bands are strongly coupled to the in-plane phonon mode at 75 meV, giving rise to a high electron-phonon coupling constant [6, 12, 9]. In this paper we shall make no distinction between bands of the same type, representing the conductivity by the sum of the two terms
| (2) |
The optical sum rule reads as follows
| (3) |
where and are the unscreened (bare) plasma frequencies of the and bands and is the total plasma frequency. Of course, the conductivity and the plasma frequency are both tensors with two different components: one parallel to the ab plane and another along the c axis. The first-principle calculations predict the band plasma frequency to be very small along the c axis.
It follows from Eq.(2) that there is no rigorous experimental way to separate and . However, the multiband structure may become apparent in optical spectra due to the strong disparity between the two bands. Such a contrast can stem from (i) different anisotropies of the plasma frequencies and , (ii) manifestly different electron scattering on phonons and impurities, and (iii) a large difference of superconducting gap values. In the following sections these possibilities will be analyzed in details.
3 Plasma frequency
The plasma frequency that can be measured using the optical sum rule (3) is determined by the electronic band dispersion [12]:
| (4) |
is the sample volume, is the Fermi-Dirac distribution function and is the band index. At not too high temperatures, only states close to the Fermi energy contribute to Eq.(4), and , where is the density of states and is the Fermi velocity.
The plasma frequency is an important parameter for testing the consistency of band structure calculations with optics. Therefore, the reported value of only 1.5 - 3.0 eV for by several groups [18, 19, 20, 21, 22] soon after the discovery of superconductivity in MgB2, as compared to the theoretical prediction of 7 eV in both directions, was rather puzzling. The situation changed recently, when three independent measurements on high-quality single crystals [23, 24, 25] showed the values of much closer to the calculated ones.
Given the large spread of optical data, one should critically consider the experimental issues. Possible complications are (i) sample purity, (ii) surface contamination, (iii) analysis ambiguity due to a limited spectral range and (iv) an overlap between the Drude peak and interband peaks.
Impurities in small amounts are not expected to affect significantly the plasma frequency. However, they increase the elastic scattering and shift the Drude spectral weight to higher frequencies. Interestingly, in MgB2 impurities can affect differently the charge scattering in and bands [32].
As observed by several groups, the optical quality of the surface of MgB2 poly- and single crystals degrades in air within minutes after polishing [19, 21, 23, 25]. To the author’s knowledge, there is no information about the surface degradation of MgB2 films. The surface contamination strongly reduces the absolute reflectivity, pushing down the apparent value of the plasma frequency.
A source of inaccuracy not to be neglected is a set of assumptions taken to experimentally derive and integrate . In particular, the error bars due to high- and low-frequency extrapolations in the Kramers-Kronig (KK) analysis of reflectivity that are hard to estimate may affect significantly the value of , especially if spectra are available only up to few electronvolts. This uncertainty is reduced if the ellipsometric technique is used allowing the direct measurement of and .
Tu et al. [18] measured the reflectivity of high-quality oriented films (=39.6 K) with the c axis perpendicular to the surface in the range from 3.5 meV to 2.7 eV and extracted by the KK transform. A value of 1.8 eV was deduced from the sum-rule analysis. Notably, the film reflectivity is very high at low frequencies (compatible with the predicted high metallicity of MgB2) but becomes quite low above 0.5-0.7 eV as compared to the recent data on single crystals [23, 24, 25]. The same trend of high-frequency reflectivity suppression is present in the film study by Mun et al. [20] and, to a larger extent, by Chvostová et al. [22]. It is not clear at the moment whether this is due to surface contamination, film strains or other reasons.
In another early study, Kuzmenko et al. [19] obtained a direction-averaged conductivity of a dense polycrystalline sample (=39 K) from 6 meV to 4.6 eV by a combination of reflectivity and ellipsometry measurements. The conductivity shows a narrow Drude peak with a plasma frequency of only 1.4 eV and additionally a broad infrared continuum with a spectral weight corresponding to the plasma frequency of about 5 eV. Since this sample has a sizeable contamination of MgO, a possible explanation of the apparently small Drude plasma frequency is that the narrow peak is due to the bands, which are not strongly affected by impurities, but renormalized by the electron-phonon interaction, while the broad continuum is largely formed by the bands [32]. This is probably the main reason for the low reflectivity of that sample, although some influence of the surface contamination cannot be excluded.
The first attempt to distinguish and was undertaken by Fudamoto and Lee [21]. From a comparison of the reflectivity spectra measured on a mosaic of ab-plane oriented crystals and on a polycrystalline sample they correctly deduced that the plasma edge parallel to the ab plane is at about 2 eV while the one along the c axis is at 2.75 eV. However, the conclusion of Ref.[21] about a significant difference between and was not confirmed by the latest single-crystal studies [23, 25]. The reason is that the position of the plasma edge corresponds to the screened plasma frequency which depends not only on but also on the dielectric constant from interband transitions. The latter quantity appears to be strongly anisotropic in MgB2 (Section 5).
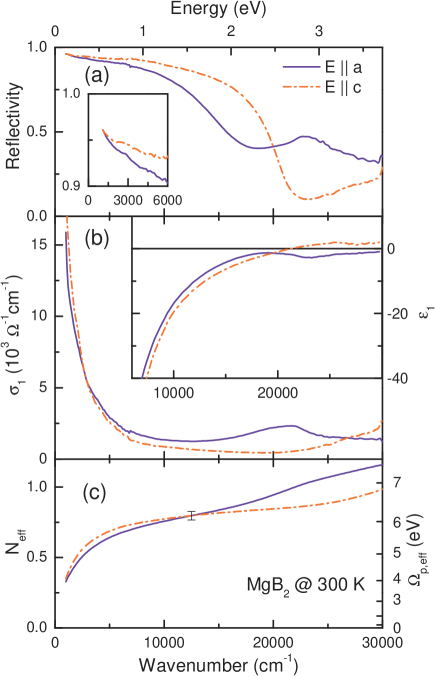
A reliable determination of the optical anisotropy requires single crystals with the c axis parallel to the surface. The major difficulties are the small dimensions of the existing single crystals, especially along the c axis ( 200 m) and the mentioned surface degradation. Guritanu et al. [23] succeeded in doing spectroscopic ellipsometry in the range 0.75 - 3.7 eV and reflectivity from 0.1 to 0.85 eV on the ac- and ab-surfaces of small single crystals ( = 38 K) at room temperature (Fig.1), by adding focusing lenses to a standard ellipsometry setup and keeping samples in a nitrogen flow. Both in-plane and c-axis spectra exhibit a metallic behavior, characterized by a reflectivity plasma edge, a Drude peak in and a negative . However, one can see a strong anisotropy of the plasma edge, consistent with the assignment made in Ref.[21]. The plasma frequency derived by the sum rule is about 6.3 eV for both directions, if the integration is continued up to 1.7 eV. This cutoff value is high enough to comprise most of the intraband spectral weight, but it is below the interband peak at 2.6 eV along the a axis (discussed in Section 5). Since ellipsometry provides directly both real and imaginary parts of the dielectric function, the value of the plasma frequency is practically independent on extrapolations. The value of 6.3 eV is much closer to 7 eV predicted by the LDA calculations. A very small anisotropy of the plasma frequency is also in a good agreement with the theoretical predictions.
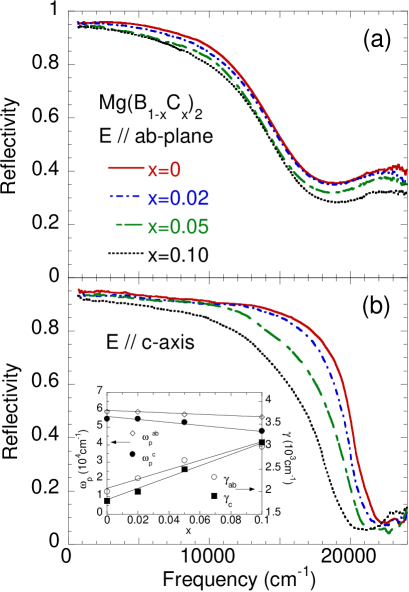
Independently, Kakeshita et al. [25] measured a- and c-axis reflectivities of MgB2 from 75 meV to 3 eV on ac- and ab-oriented single crystals at room temperature using a microscope spectroscopy technique (Fig.2). The sample was polished prior to each measurement in order to avoid the effect of the surface degradation. The data from Refs.[25] and [23] match rather well with each other, although the plasma edges are sharper in Ref.[25], indicating a narrower Drude peak (Fig.3). The plasma frequencies estimated in Ref.[25] from the optical sum rule with a cutoff at 2.2 eV are 8.4 eV and 7.0 eV. However, for such a high cutoff the interband transition at 2.6 eV contributes significantly to the sum rule along the a axis. A Drude-Lorentz fit that treats the interband peak as a separate contribution gives a smaller value 7.4 eV. The values of the plasma frequencies obtained in Refs.[23] and [25] seem to agree each other within the error bars of the KK analysis. In both cases, might be slightly overestimated since the theory predicts the existence of a weak interband transition at 0.3-0.5 eV. Within the error margins, there is no prohibitive disagreement between optics and LDA calculations, as has been shown by independent measurements on single crystals grown in different groups.
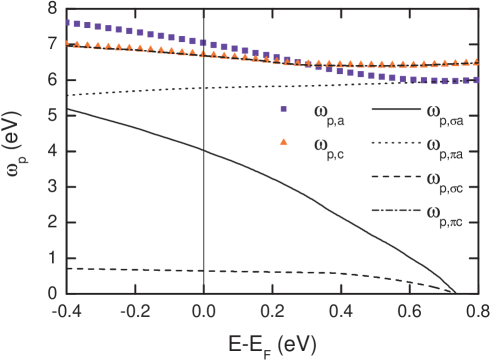
The influence of Al, C and other substitutions on the properties of MgB2 has been recently the focus of intense research. All substitutions are found to suppress ([33] and references therein). It was argued [33] that this suppression can be well described by a combination of the filling of bands and interband scattering. Optics contributes to a better understanding of the substitution effects. While Al replaces Mg and carbon substitutes boron atoms, both of them dope electrons to the system, which is expected to affect the plasma frequency. In the rigid band picture, where the doping merely shifts the Fermi level, the change of the band plasma frequencies can be derived from the band structure calculations for the pure compound. Fig.4 shows the plasma frequencies of and bands as well as the total ones for the two polarizations [3]. With the increase of the Fermi level, both and are expected to diminish, but the decrease of is faster due to a rapid decrease of . The latter effect is caused by a fast depletion of the density of states (DOS) of bands.
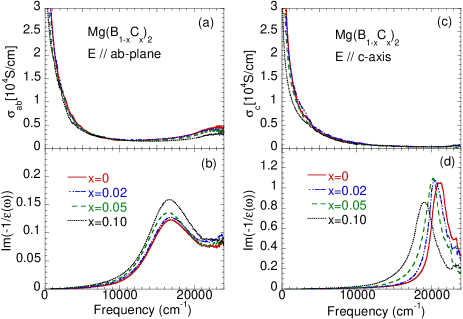
Kakeshita et al. [25] measured reflectivity on a series of carbon doped samples Mg(B1-xCx)2, (Fig.2). Remarkably, the c-axis plasma edge as well as the corresponding peak of the loss function (Fig.3) shift to low frequencies with doping while the one for the a axis is almost doping independent. Correspondingly, notably goes down, while shows only a minor decrease with C substitution (shown as inset of Fig.2). The decrease of both and with doping qualitatively agrees with their calculated Fermi-level dependence (Fig.4). However, the rigid band approximation does not explain that goes down much faster than . It is necessary therefore to take into account the doping induced band modification. The calculations of Refs. [33] and [34] indeed show a much slower decrease of the -band DOS compared to the rigid band model. This results in a slower rate of the suppression of with doping, in agreement with observations.

The ab-plane optical reflectivity of a series of C- and Al-doped single crystals of MgB2 was measured by Di Castro et al. [24] (Fig.5). The data indicate that each of these substitutions causes only a minor shift of the a-axis plasma edge. Correspondingly, a quantitative analysis showed a slight decrease of the total in-plane plasma frequency. As far as carbon doping is concerned, this agrees well with the results of Ref. [25]. In Ref. [24] a value of of about 5 eV was reported, which is somewhat smaller than the values obtained in Refs.[23] and [25]. The low-frequency reflectivity is close to the one from [23], but drops faster above 2 eV, which partially explains, together with uncertainties due to a limited spectral range, the difference of the plasma frequencies. Another reason is that the model dielectric function used by the authors [24] to fit reflectivity contained an extra mid-infrared (MIR) peak ascribed to the interband transition.
4 Electron-phonon and impurity scattering
The information about electron-phonon interaction and impurity scattering can be derived from the shape of the Drude peak. In particular, the strength of the electron-phonon coupling, which is widely believed to be responsible for the superconducting pairing, can be deduced from the infrared spectra. The knowledge of impurity scattering rates can be used to test the hypothesis about a strong disparity between and bands and a very small interband scattering used to explain the survival of two distinct superconducting gaps [32].
The broadening is conveniently described via the memory function , where is the scattering rate and is the electron mass renormalization ( is the bare band mass). Note that the memory function definitions present in the literature differ by a factor of [35, 36]; we follow the notation, where is given by the real part of . In the case of a single band, can be directly extracted from the intraband optical conductivity via the extended Drude formalism
| (5) |
For two bands, the situation is more complicated. The band-dependent scattering has to be accounted for by taking separate memory functions and
| (6) |
In fact, this complication is beneficial since the scattering dissimilarity distinguishes optically the contributions from different bands.
We assume that impurities/vacancies and phonons contribute additively to the memory function (Matthiessen’s rule):
| (7) |
The impurity scattering is strongly sample dependent and frequency and temperature independent, in contrast to the one due to lattice vibrations. The expression for the phonon memory function at finite temperatures was obtained by Shulga et al. [37]
| (8) |
which is a generalization of the famous formula due to Allen [38]. Here is the transport Eliashberg function, and
where is the digamma function. The total electron-phonon coupling strengths are given by the constants
| (9) |
Eq. (8) follows from the Kubo formula in the weak-coupling limit, although it remains accurate even at [39]. There are several ab initio calculations of the Eliashberg functions [6, 9, 12] which all show a strong coupling in the bands and a moderate coupling in the bands.
The memory function as determined from the experimental data by Eq.(5) is proportional to the plasma frequency squared. Therefore the strong underestimation of in the first optical experiments resulted in anomalously small electron-phonon coupling constants [40]. For example, in Ref. [18] a value was found, which is incompatible with the of 40 K without invoking exotic coupling mechanisms [41].
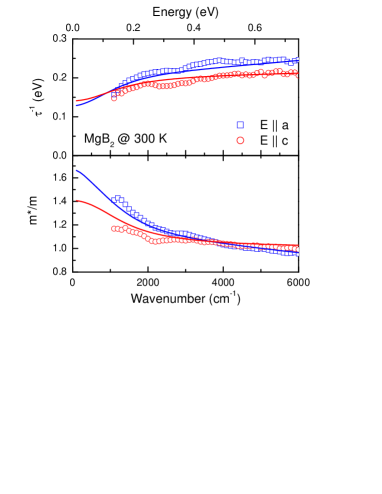
Fig.6 shows and at 300 K obtained by Guritanu et al.[23] by applying Eq. (5) to the single crystal data using 6.3 eV. Since the plasma frequency of cylindrical bands is predicted by the LDA calculations [5, 42] to be very small along the axis (Fig.4), the extended Drude parameters along the c axis is almost entirely determined by the bands. In contrast, the contributions from and bands to the in-plane properties are comparable, therefore both scattering rate and mass renormalization for are effectively averaged over the two bands. This is why a larger and a faster growth of with photon energy for the in-plane polarization indicate, without any modeling, that the electron-phonon coupling in the bands is stronger than the one in the bands. One has to keep in mind though that the interband peak is predicted to be at 0.3-0.5 eV for the in-plane polarization (see Section 5) that may interfere with the extended Drude analysis.
Kakeshita et al. [25] found that the c-axis optical conductivity is much better described by a single Drude peak with a frequency independent scattering rate than the conductivity parallel to the ab plane. This agrees well with the much weaker frequency dependence of for than for [23] (Fig.6).
A more quantitative comparison between experiment and theory can be made using Eqs.(6), (7) and (8). Although not all parameters that enter these formulas (four plasma frequencies, two impurity scattering rates, and two Eliashberg functions) can be independently derived from the data fit, the measured anisotropy of optical spectra imposes tight constraints on them. At frequencies above the phonon range the data are sensitive to the total coupling constants but not to the spectral structure of the Eliashberg functions. It was found [23] that the ab initio calculated coupling constants ( 1.1 for the -bands and 0.55 for the -bands [5, 6]) agree well with the spectral data, if the quasi-2D nature of the bands is assumed.
It appears that both the in-plane and c-axis infrared reflectivity spectra are quite sensitive to the -band impurity scattering , allowing an accurate determination of ( 85 meV for the single crystal from Ref.[23]). In contrast, cannot be reliably derived from infrared spectra alone, because the scattering in the band is dominated by the electron-phonon interaction. The ambiguity can be fixed by considering the temperature dependence of the in-plane resistivity , for which the ratio (RRR) is rather sensitive to . In order to match the experimental curve measured on a sample grown in the same conditions that showes RRR 5, is about 7 times smaller than had to be assumed. Such a larger difference of the band scattering rates agrees with Raman data [31]. One should note that this supports the hypothesis of Mazin et al. [32] that the holes with wavefunctions strongly confined within the boron planes should be scattered by typical lattice defects (except the carbon atoms) much less than the -band carriers. This is due a larger probability of the defect formation in the interstitials than inside the covalently bonded boron sheets.
Kakeshita et al. [25] observed a strong increase of the scattering rate in the bands and a significant but lesser increase in the bands with carbon doping. This can be explained by the fact that C substitutes boron atoms, affecting strongly the band scattering. A similar result was obtained by Di Castro et al. [24], who found that carbon doping has a more pronounced effect on the band scattering than the Al substitution.
5 Interband transitions
The interband optical conductivity is determined by the band dispersion and transition matrix elements [42, 43]
| (10) | |||||
where the indices count bands of initial (final) transition states, the factor 2 takes the different spin orientations into account. The observed interband peaks thus allow for an extra check of the band structure calculations. The scattering processes smear the interband spectra, which is often roughly accounted for by a spectral convolution with a Gaussian.
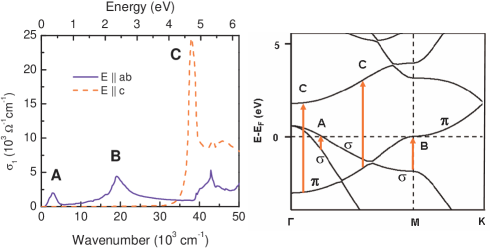
Several groups [8, 19, 42, 44] calculated for MgB2 all in reasonable agreement with each other. Fig.7 shows the calculated in-plane and c-axis interband conductivities from Ref.[19]. A remarkable anisotropy is present: there is no sizeable optical intensity along the c axis below 4 eV, whereas there are two peaks at 0.3-0.5 eV (marked as A) and 2.4 eV (marked as B) for polarization parallel to the boron planes. Peak A corresponds to the transition between two close bands. Peak B is due to a transition from the band to the band close to the M point, where a van Hove singularity strongly enhances the density of states. The quasi-2D character of the bands explains why the transitions A and B are not optically observed along the c axis. The c-axis conductivity features a remarkably intense interband peak at about 5 eV, which comes from a transition between almost parallel bands.
The transition (peak B) is observed in Refs.[23] and [25]. In the ellipsometric study by Guritanu et al. [23], this peak was found to be centered at 2.6 eV (Fig.1), which is slightly higher than the theoretical value 2.4 eV [19]. The mismatch in the peak position suggests that the separation between -band and -bands is bigger than predicted by the theory by about 200 meV. Interestingly a shift of the same amount brings the results of the dHvA experiments [11] in MgB2 close to theoretical predictions [45]. Kakeshita et al. [25] reported the interband transition even at a higher energy of 2.8-2.9 eV (Fig.3) which could be either due to the sample difference, or due to the fact that the peak was close to the experimental frequency cutoff of that study. No shift of the energy of this transition with carbon substitution was observed.
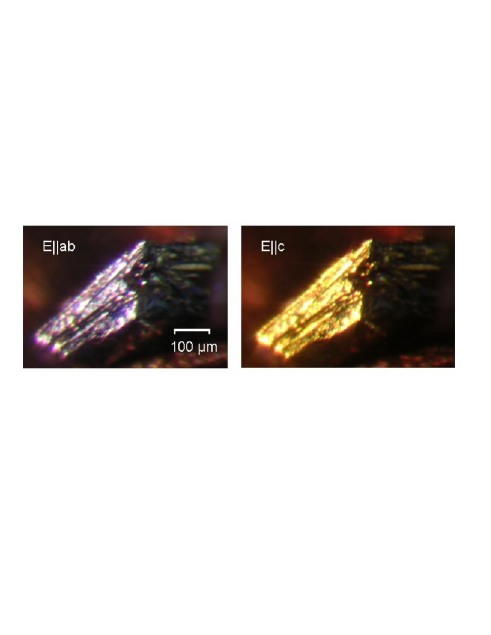
As a result of its large optical strength and the proximity to the screened plasma frequency, the transition broadens the in-plane reflectivity plasma edge and shifts it down by about 0.5 eV with respect to the one along the c-axis (as was noticed in section 3, the bare plasma frequency appears to be almost isotropic!). A beautiful manifestation of the plasma edge anisotropy is the multicolor appearance of magnesium diboride [23, 27]. The ac-oriented single crystals looks golden in light polarized along the c-axis and blueish-silver for the in-plane polarization (Fig.8). In the raw reflectivity data, this transition causes a second pseudo plasma edge (Fig.1), that was already seen in the first single crystal spectra by Perucchi et al. [46].
Less clear is the situation with the low-lying transition. According to the calculations, it should be seen as a minute dip of about 1 % on the in-plane reflectivity [23]. Di Castro et al. reported such a feature at about 0.5 eV and found that it shifts to lower energies with carbon and aluminum doping. However, this effect is not obvious in other optical studies, for example in Refs.[23, 25, 18]. More experiments are needed to clarify this issue.
6 Far-infrared spectra: one gap or two?
Far-infrared transmission data of thin lead films [47] showed the existence of the superconducting gap before the advent of the BCS theory. Not surprisingly, many groups examined the unusual superconductivity in MgB2 with far-infrared spectroscopy. Although infrared spectra do not tell as directly as tunneling spectra about the electronic density of states, the superconductivity induced correlations have a dramatic effect on radiation absorption on the energy scale of the gap. In an isotropic s-wave BCS superconductor, the real part of the optical conductivity below vanishes at low temperatures, because photons with a lower energy cannot break Cooper pairs. The inductive component shows behavior due to the formation of the condensate.
An early far-infrared grazing-incidence reflectivity measurement by Gorshunov et al. [48] on a porous polycrystalline sample of MgB2 (=39 K) revealed a superconductivity-induced rise of reflectivity with a maximum effect at about 3-4 meV, which was tentatively attributed to the lowest value of . Further experiments on thin films [49, 50, 51, 52, 53, 54], thick films [18], single crystals [46, 24] and dense polycrystals [19, 55] provided much more detailed and quantitative spectral information that in general supported such assignment (Table 1). Note that this gap value gives an anomalously small ratio as compared to the weak-coupling BCS result of 3.52. However, it agrees well with the smallest gap observed in the band by tunneling spectroscopy [13] and ARPES [16].
| sample | refl/tran | (K) | (meV) | Ref. | |
|---|---|---|---|---|---|
| thin film | tran | 33 | 5.2* | 1.8 | [50] |
| thin film | tran | 30.5 | 5*** | 1.9 | [52] |
| thin film | refl | 32 | 3*** | 1.1 | [49] |
| thin film | refl | 30 | 5.2* | 2.0 | [54] |
| thin film | refl | 35 | 5*** | 1.6 | [53] |
| polycrystal | refl | 39 | 3-4** | 0.9-1.2 | [48] |
| polycrystal | refl | 39 | 4.8* | 1.4 | [55] |
| thick film | refl | 39.6 | 5*** | 1.5 | [18] |
| mosaic | refl | 38 | 4*** | 1.2 | [46] |
| single crystal | refl | 38.5 | 4* | 1.2 | [24] |
While a gap-like feature at an energy scale of the order of the smaller gap was universally seen, no clear evidence of the larger gap ( 7 meV according to tunneling [13], ARPES [16] and Raman [17] data) was found in the far-infared experiments. This is perhaps the most puzzling and intriguing issue raised by the infrared spectroscopy of magnesium diboride.
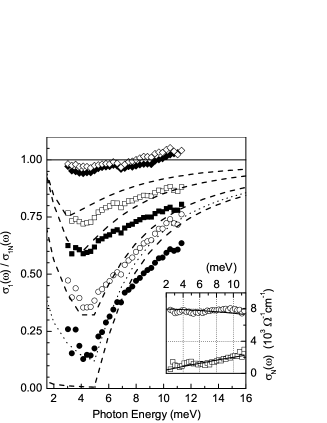
To simplify the comparison of different measurements, we begin with a basic simulation of the expected effect of the two-gap structure on the in-plane infrared spectra of MgB2, similar to the one made by Lee et al. [51] and Lobo et al. [54]. We assume that and charge carriers respond independently to the external radiation; the condition that justifies using Eq.(2). Each component is characterized by its own in-plane plasma frequency , scattering rate (which is mostly due to impurities at 40 K) and superconducting gap . We use the Mattis-Bardeen formalism [56] for an s-wave isotropic BCS superconductor extended to the case of finite impurity scattering by Zimmermann et al. [57]. The standard Fresnel equations are employed.
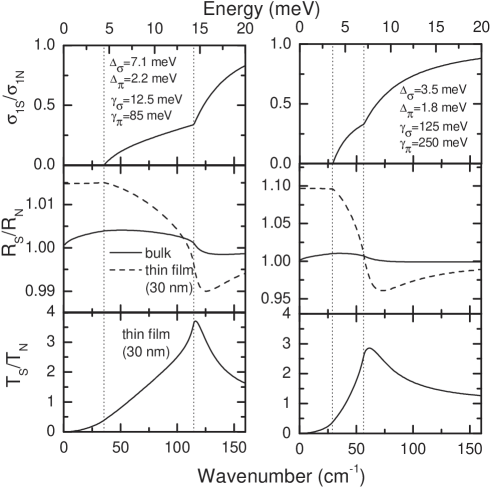
Figure 9 shows the superconducting to normal-state ratios for the real part of the optical conductivity (top), the reflectance of a bulk sample (middle, solid line), the one of a thin film with the thickness of 30 nm (middle, dashed line) and for the transmission of the same thin film (bottom). In the first simulation (left panels), it is assumed that the gap values = 7.1 meV and = 2.2 meV are the same as in the tunneling spectra [13]. The scattering rates = 12.5 meV and = 85 meV are taken from the optical study [23]. The plasma frequencies are borrowed from the LDA calculation [5] which are close to the recent optical results [23, 25] as discussed in Section 3. We ignored the effective mass renormalization due to electron-phonon interaction which does not qualitatively change the results of this simulation. The conductivity shows two independent thresholds at and . The reflectivity ratio is slightly less than 1 for showing a minimum somewhat above , but at lower energies it suddenly grows and saturates (for a thin film) or shows a broad maximum (for a bulk sample) at about . The film reflectance structure becomes quite sharp if the thickness is less than the penetration depth. This generally makes thin films experiments more sensitive to the gap value than the ones made on bulk samples. The film transmittance shows a pronounced peak centered near , while the gap only slightly modifies the curve shape without producing any sharp spectral features.

Jung et al. [50] measured the far-infrared transmittance of a thin ( 50 nm) MgB2 film ( = 33 K) with the c axis perpendicular to the surface (Fig.10). The transmittance in the superconducting state showed a peak at around 6.5 meV at 5 K. The best fit assuming a single gap value was achieved with 5.2 meV. The temperature dependence of the gap was close to the prediction of the BCS theory. However, the peak position is about two times (!) lower than the prediction of the two-gap model based on the tunneling result (Fig.9). To be more accurate, one needs to correct for a reduced by taking a smaller value of . From the solution of full Eliashberg equations, Dolgov et al. [58] found that should be about 5.5 meV for =33 K, which is close to the recent observations on neutron-irradiated MgB2 samples [59]. However this correction seems to be by far insufficient to fix the mismatch.
Kaindl et al. [52] reported and of two MgB2 films ( = 30 and 34 K) directly obtained by terahertz time domain spectroscopy in transmission geometry. The transmission peak was at about 7 meV for both films, which is close to the observation in Ref.[50]. A strong depletion of absorption was observed below 5 meV at 6 K, although the data do not exclude that the full conductivity suppression is at somewhat lower energy (Fig.11).
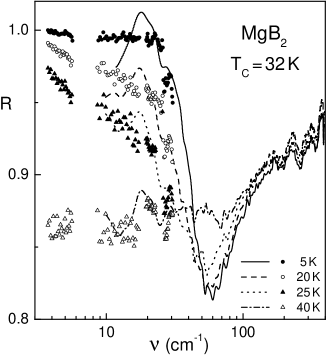
Pimenov et al. [49] obtained the reflectance of a thin MgB2 film with a similar (32 K) (Fig.12). The spectral range was extended down to 0.5 meV by using a quasioptical backward wave oscillator technique which gives directly and . The onset of absorption was observed at about 3 meV, which was ascribed to the value of . Although this number is smaller than 4.2 meV found in Ref.[50], one should realize that the way of determination is different. In fact, a pronounced reflectivity dip is observed in Ref.[49] at 7 meV, which is close to the transmittance peak from Refs. [50] and [52]. A similar result was obtained by Lobo et al.[54] on a c-axis oriented film with 30 K. This peak-dip match suggests the mutual consistency of different thin film studies.
While the straightforward application of the model assuming a large gap separation clearly fails to describe the existing infrared spectra, one may wonder whether these data are still compatible with the presence of two, less distinct, effective gaps. Lobo et al. [54] found that a two-gap model with = 1.8 meV and = 3.5 meV improves the fit of the reflectivity curve compared to the best fit by the one-gap model with = 2.6 meV, although the improvement was not sufficient to conclude that two gaps must exist. In Fig.9 (right panel) a second simulation with the same formulas is shown where the parameters are changed in two ways: (i) the gaps are reduced to = 1.8 meV and = 3.5 meV as in Ref.[54], which nevertheless leaves them quite distinct and (ii) the sample is assumed to be far in the dirty limit ( = 125 meV and = 250 meV), which is perhaps a better description for thin films as compared to single crystals. This model qualitatively matches both reflection [49, 54] and transmission [50, 52] spectra.
Single crystals of magnesium diboride have an advantage of higher and smaller residual resistivity as compared to thin films. The first single-crystal optical measurement of MgB2 was made by Perucchi et al. [46] on a mosaic of ab-oriented samples (=38 K). The spectra were taken down to 3 meV while changing temperature down to 1.6 K and applying magnetic fields up to 7 T, which allowed a fully optical determination of the temperature dependence of the c-axis critical field ( 5 T at lowest 1.6 K). The authors [46] observed the absorption threshold at about 4 meV, which is close to the observation on thin films [52, 49]. Di Castro et al. [24] measured the ratio on separate ab-oriented single crystals of MgB2 (=38.5 K) using the synchrotron radiation between 3 and 12 meV to compensate the loss of signal due to the small sample size. They observed a relative reflectivity increase below , which is much smaller in size as compared to the one from Ref.[46], but much more close to the expectation according to the Mattis-Bardeen-Zimmermann calculation (Fig.9). The rise of reflectivity was observed only below 5 meV at zero doping and 8 meV for a carbon substituted sample, which is much lower than the prediction of the model that assumes a large value of (Fig.9, left panels). The reason for a significantly different size of the superconductivity induced increase of reflectance in Refs.[46] and [24] is not fully clear, although it may be related to mosaic effects in the first measurement or diffraction effects due to a small sample size in the second one. Further experiments on single crystals may clarify this issue.
Let us now speculate on the reasons for the failure of the straightforward two gap description of the infrared spectra in MgB2. One possibility is that the assumption about two independent responses of and bands has to be abandoned. Another weakness of the modeling of Fig.9 is the assumption about the local electromagnetic response and the validity of the Fresnel equations. This would be well justified in the dirty limit, which is likely to be applicable to the bands, but not necessarily to the bands. The last possibility is that there are two gaps in the infrared spectra, but they are effectively reduced for some reason with respect to the ones observed by other probes. Certainly more theoretical and experimental research is needed to solve this paradox.
To get the full picture of the electromagnetic response of MgB2 in the superconducting state one would have to complement the discussed spectroscopic data with the temperature dependence of and (usually expressed via the penetration depth ) as measured by microwave [60, 61, 62] and submillimeter [63] techniques. Interestingly, the structure of the so-called coherence peak is highly anomalous for a single gap superconductor, revoking the explanation in terms of two gaps (some of these measurements are reviewed in Ref. [64]). Optical studies of photoexcited quasiparticle dynamics [65, 54] provide another useful piece of information. The discussion of these latter experiments is unfortunately beyond the current review.
7 Conclusions
Many optical properties of magnesium diboride now appear to be consistent with the ab initio electron and phonon band calculations. The long standing problem of an apparently small plasma frequency is solved due to the recent measurements on single crystals: it is close to the theoretical prediction of 7 eV and is almost isotropic (which should be regarded, in fact, as a coincidence, since the plasma frequency of the bands is very small along the c axis). The c-axis plasma frequency strongly decreases with carbon doping, in contrast to the one parallel to the boron planes. The observed energy of the interband transition (2.6 eV) suggests that the LDA calculations underestimate the separation between and bands by about 200 meV, in agreement with the de Haas-van Alphen experiments. Optical data in a combination with DC resistivity curves show that the bands are characterized by a stronger electron-phonon coupling but a smaller impurity scattering as compared to the bands.
Far-infrared spectra clearly show a gap-like onset of absorption indicating = 3-5 meV and an anomalously small ratio =1-2. This value likely refers to the gap in the bands. A serious problem which remains is the absence of a clear far-infrared signature of the large gap seen in other experiments in MgB2. Before this issue is resolved, our understanding of two-gap superconductivity can hardly be considered as a complete.
8 Acknowledgments
The author is grateful to V. Guritanu, D. van der Marel, O.V. Dolgov, J. Kortus, I.I. Mazin, J. Karpinski, R.P.S.M. Lobo, M. Ortolani, L. Degiorgi, S. Tajima and T. Kakeshita for discussions and to E. van Heumen and V. Guritanu for a help in the preparation of this manuscript. The financial support was provided by the Swiss National Science Foundation through the National Center of Competence in Research Materials with Novel Electronic Properties-MaNEP .
References
- [1] H. Suhl, B.T. Matthias, L.R. Walker, Phys. Rev. Lett. 3 (1959) 552.
- [2] J. Nagamatsu, N. Nakagawa, T. Muranaka, Y. Zenitani, J. Akimitsu, Nature 410 (2001) 63.
- [3] I.I. Mazin, V.P. Antropov, Physica C 385 (2003) 49.
- [4] I.I. Tupitsyn, Sov. Phys. Solid State 18 (1976) 1688.
- [5] J. Kortus, I.I. Mazin, K.D. Belashchenko, V.P. Antropov, L.L. Boyer, Phys. Rev. Lett. 86 (2001) 4656.
- [6] Y. Kong, O.V. Dolgov, O. Jepsen, O.K. Andersen, Phys. Rev. B 64 (2001) 020501.
- [7] J. An, W.E. Pickett, Phys. Rev. Lett. 86 (2001) 4366.
- [8] P. Ravindran, P. Vajeeston, R. Vidya, A. Kjekshus, H. Fjellvag, Phys. Rev. B 64 (2001) 224509.
- [9] H.J. Choi, D. Roundy, H. Sun, M.L. Cohen, S.G. Louie, Phys. Rev. B 66 (2002) 020513.
- [10] H. Uchiyama, K.M. Shen, S. Lee, A. Damascelli, D.H. Lu, D.L. Feng, Z.-X. Shen, S. Tajima, Phys. Rev. Lett. 88 (2002) 157002.
- [11] E.A. Yelland, J.R. Cooper, A. Carrington, N.E. Hussey, P.J. Meeson, S. Lee, A. Yamamoto, S. Tajima, Phys. Rev. Lett. 88 (2002) 217002.
- [12] A.Y. Liu, I.I. Mazin, J. Kortus, Phys. Rev. Lett. 87 (2003) 087005 .
- [13] M. Iavarone, G. Karapetrov, A. E. Koshelev,W. K. Kwok, G.W. Crabtree, and D.G. Hinks, W. N. Kang, Eun-Mi Choi, Hyun Jung Kim, Hyeong-Jin Kim, S.I. Lee, Phys. Rev. Lett. 89 (2002) 187002.
- [14] M. R. Eskildsen, M. Kugler,S. Tanaka,J. Jun, S. M. Kazakov, J. Karpinski, O. Fischer, Phys. Rev. Lett. 89 (2002) 187003.
- [15] Y. Wang, T. Plackowski, A. Junod, Physica C 355 (2001) 179.
- [16] S. Souma, Y. Machida, T. Sato, T. Takahashi, H. Matsui, S.-C. Wang, H. Ding, A. Kaminski, J.C. Campuzano, S. Sasaki, K. Kadowaki, Nature 423 (2003) 65.
- [17] J.W. Quilty, S. Lee, A. Yamamoto, S. Tajima, Phys. Rev. Lett. 88 (2002) 087001.
- [18] J.J. Tu, G.L. Carr, V. Perebeinos, C.C. Homes, M. Strongin, P.B. Allen, W.N. Kang, Eun-Mi Choi, Hyeong-Jin Kim, Sung-Ik Lee, Phys. Rev. Lett. 87 (2001) 277001.
- [19] A.B. Kuzmenko, F.P. Mena, H.J.A. Molegraaf, D. van der Marel, B. Gorshunov, M. Dressel, I.I. Mazin, J. Kortus, O.V. Dolgov, T. Muranaka, J. Akimitsu, Solid State Commun. 121 (2002) 479.
- [20] Mi-Ock Mun, Young Jin Kim, Yu Park, Jae Hoon Kim, S.H. Moon, H.N. Lee, H.G. Kim, B. Oh, J. of Supercond. 15 (2002) 475.
- [21] Y. Fudamoto, S. Lee, Phys. Rev. B 68 (2003) 184514.
- [22] D. Chvostova, V. Zelezny, L. Pajasova, A. Tarasenko, A. Plecenik, P. Kus, L. Satrapinsky, Thin Solid Films 455 (2004) 213.
- [23] V. Guritanu, A.B. Kuzmenko, D. van der Marel, S.M. Kazakov, N.D. Zhigadlo, J. Karpinski, Phys. Rev. B 73 (2006) 104509.
- [24] D. Di Castro, M. Ortolani, E. Cappelluti, U. Schade, N.D. Zhigadlo, J. Karpinski, Phys. Rev. B 73 (2006) 174509.
- [25] T. Kakeshita, S. Lee, S. Tajima, Phys. Rev. Lett. 97 (2006) 037002.
- [26] J. Karpinski, M. Angst, J. Jun, S.M. Kazakov, R. Puzniak, A. Wisniewski, J. Roos, H. Keller, A. Perucchi, L. Degiorgi, M.R. Eskildsen, P. Bordet, L. Vinnikov, A. Mironov, Supercond. Sci. Technol. 16 (2002) 221.
- [27] S. Lee, Physica C 385 (2003) 31.
- [28] S. Bud’ko, G. Lapertot, C. Petrovic, C.E. Cunningham, N. Anderson, P.C. Canfield, Phys. Rev. Lett. 86 (2001) 1877.
- [29] D.G. Hinks, H. Claus, J.D. Jorgensen, Nature 411 (2001) 6836.
- [30] F.J. Pinski, P.B. Allen, W.H. Butler, Phys. Rev. B 23 (1981) 5080.
- [31] J.W. Quilty, S. Lee, S. Tajima, A. Yamanaka, Phys. Rev. Lett. 90 (2003) 207006.
- [32] I.I. Mazin, O.K. Andersen, O. Jepsen, O.V. Dolgov, J. Kortus, A.A. Golubov, A.B. Kuzmenko, D. van der Marel, Phys. Rev. Lett. 89 (2002) 107002.
- [33] J. Kortus, O.V. Dolgov, R.K. Kremer, A.A. Golubov, Phys. Rev. Lett. 94 (2005) 027002.
- [34] G. Profeta, A. Continenza, S. Massidda, Phys. Rev. B 68 (2003) 144508.
- [35] W. Götze, P. Wölfle, Phys. Rev. B 6 (1972) 1226.
- [36] A.V. Puchkov, D.N. Basov, T. Timusk, J. Phys. Condens. Matter 8 (1996) 10049.
- [37] S.V. Shulga, O.V. Dolgov, E.G. Maksimov, Physica C 178 (1991) 266.
- [38] P.B. Allen, Phys. Rev. B 3 (1971) 305.
- [39] F. Marsiglio, private communication.
- [40] E.G. Maksimov, J. Kortus, O.V. Dolgov, I.I. Mazin, Phys. Rev. Lett. 89 (2002) 129703.
- [41] F. Marsiglio, Phys. Rev. Lett. 87 (2001) 247001.
- [42] V.P. Antropov, K.D. Belashchenko, M. van Schilfgaarde, S.N. Rashkeev, in: Studies of High Temperature Superconductors, 38 (2002) 91.
- [43] M. Dressel, G. Gruner, Electrodynamics of Solids, Cambridge University Press (2002).
- [44] Wei Ku, W.E. Pickett, R.T. Scalettar, A.G. Equiluz, Phys. Rev. Lett. 88 (2002) 057001.
- [45] H. Rosner, J.M. An, W.E. Pickett, S.-L. Drechsler, Phys. Rev. B 66 (2002) 024521.
- [46] A. Perucchi, L. Degiorgi, J. Jun, M. Angst, J. Karpinski, Phys. Rev. Lett. 89 (2002) 097001.
- [47] R.E. Glover, M. Tinkham, Phys. Rev. 104 (1956) 844.
- [48] B. Gorshunov, C.A. Kuntscher, P. Haas, M. Dressel, F.P. Mena, A.B. Kuzmenko, D. van der Marel, T. Muranaka, J. Akimitsu, Eur. Phys. J. B 21 (2001) 159.
- [49] A. Pimenov, A. Loidl, S.I. Krasnosvobodtsev, Phys. Rev. B 65 (2002) 172502.
- [50] J.H. Jung, K.W. Kim, H.J. Lee, M.W. Kim, T.W. Noh, W.N. Kang, Hyeong-Jin Kim, Eun-Mi Choi, C.U. Jung, Sung-Ik Lee, Phys. Rev. B 65 (2002) 052413.
- [51] H.J. Lee, J.H. Jung, K.W. Kim, M.W. Kim, T.W. Noh, Y.J. Wang, W.N. Kang, Eun-Mi Choi, Hyeong-Jin Kim, Sung-Ik Lee, Phys. Rev. B 65 (2002) 224519.
- [52] R.A. Kaindl, M.A. Carnahan, J. Orenstein, D.S. Chemla, H.M. Christen, Hong-Ying Zhai, M. Paranthaman, D.H. Lowndes, Phys. Rev. Lett. 88 (2002) 027003.
- [53] V. Zelezny, D. Chvostova, L. Pajasova, A. Plecenik, P. Kus, L. Satrapinsky, Physica C 388 389 (2003) 129.
- [54] R.P.S.M. Lobo, M. Elsen, P. Monod, J.J. Tu, E.M. Choi, H.J. Kim, W.N. Kang, S.I. Lee, R.J. Cava, G.L. Carr, New Challenges in Superconductivity: Experimental Advances and Emerging Theories, pp. 243-248. NATO Science Series II, Ed. J. Ashkenazi, Springer (2005).
- [55] M. Ortolani, D. Di Castro, P. Postorino, I. Pallecchi, M. Monni, M. Putti, P. Dore, Phys. Rev. B 71 (2005) 172508.
- [56] D.C. Mattis, J. Bardeen, Phys. Rev. 111 (1958) 412.
- [57] W. Zimmerman, E.H. Brandt, M. Bauer, E. Seider, L. Genzel, Physica C 183 (1991) 99.
- [58] O.V. Dolgov, R.K. Kremer, J. Kortus, A.A. Golubov, S.V. Shulga, Phys. Rev. B 72 (2005) 024504.
- [59] M. Putti, M. Affronte, C. Ferdeghini, P. Manfrinetti, C. Tarantini, E. Lehmann, Phys. Rev. Lett. 96 (2006) 077003.
- [60] B.B. Jin, T. Dahm, A.I. Gubin, Eun-Mi Choi, Hyun Jung Kim, Sung-IK Lee, W.N. Kang, N. Klein, Phys. Rev. Lett. 91 (2003) 127006.
- [61] Sang Young Lee, J.H. Lee, Jung Hoon Han, S.H. Moon, H.N. Lee, J.C. Booth, J.H. Claassen, Phys. Rev. B 66 (2002) 054524.
- [62] J.D. Fletcher, A. Carrington, O.J. Taylor, S.M. Kazakov, J. Karpinski, Phys. Rev. Lett. 95 (2005) 097005.
- [63] A.V. Pronin, A. Pimenov, A. Loidl, S.I. Krasnosvobodtsev, Phys. Rev. Lett. 87 (2001) 097003.
- [64] A.A. Golubov, A. Brinkman, O.V. Dolgov, J. Kortus, O. Jepsen, Phys. Rev. B 71 (2005) 104514.
- [65] J. Demsar, R.D. Averitt, A.J. Taylor, V.V. Kabanov, W.N. Kang, H.J. Kim, E.M. Choi, S.I. Lee, Phys. Rev. Lett. 91 (2003) 267002.