Chain motion and viscoelasticity in highly entangled solutions of semiflexible rods
Abstract
Brownian dynamics simulations are used to study highly entangled solutions of semiflexible polymers. Bending fluctuations of semiflexible rods are signficantly affected by entanglement only above a concentration , where for chains of similar length and persistence length. For , the tube radius approaches a dependence , and the linear viscoelastic response develops an elastic contribution that is absent for . Experiments on isotropic solutions of -actin span concentrations near for which the predicted asymptotic scaling of the plateau modulus is not yet valid.
Solutions of long polymers become entangled when the concentration or chain length exceeds a threshhold. The nature of “entanglement” is obviously different, however, for random walks, rigid rods, and semiflexible threads. It has been proposed that solutions of semiflexible rods, of length less than or equal to their persistence length , may exhibit two different levels of entanglement, in different concentration regimes (Odijk, 1983; Doi, 1985; Semenov, 1986; Morse, 1998a) – a loosely-entangled regime, in which only rotations and transverse translations are hindered by collisions, and a tightly-entangled regime, in which transverse shape fluctuations are also strongly affected. The crossover between these two regimes is expected to be associated with a qualitative change in viscoelastic properties, due to the inability of a tightly-entangled solution to rapidly relax stress arising from transverse chain deformations. Clear experimental evidence of “tight” entanglement has been obtained only for solutions of very long actin protein filaments (F-actin), of length and diameter nm. The evidence comes both from visualization of flourescently labelled chains (Käs et al., 1994, 1996) and from rheological measurements (Sato et al., 1985; Hinner et al., 1998; Schmidt et al., 2000a; Gardel et al., 2003). It remains unclear, however, whether bending fluctuations are ever significantly hindered in isotropic solutions of any of a variety of other well-studied model systems of semiflexible rods with Sato and Teramoto (1996), for which the average chain lengths and aspect ratios are all much smaller than those obtainable with -actin. Simulations offer a potentially important complement to the experimental study of these systems, which provide access to different information and are subject to different difficulties than those encountered in experiments.
Consider a solution of thin semiflexible rods, each of contour length and persistence length , with . Let be the number density of polymers and be the contour length per volume. Simple geometrical arguments suggest the following sequence of concentration regimes Morse (1998a): At dilute concentrations , where , chain motion is essentially unhindered. In the loosely-entangled regime, , rotations and transverse rigid body translations are strongly hindered, but tranvserse bending fluctuations are not. In this regime, each chain is trapped in a cylindrical cage or tube of radius Doi (1975). Above a threshhold , this cage become narrow enough to also hinder thermal bending fluctuations (Doi, 1985; Odijk, 1983; Semenov, 1986; Morse, 1998a). At concentrations , chain motion can be described by a modified tube model (Doi, 1985; Semenov, 1986; Morse, 1998b) in which each chain undergoes reptation in a narrow wormlike tube. A scaling argument due to Odijk and Semenov Odijk (1983); Semenov (1986); Morse (1998a) predicts a tube radius for
Our simulations use a novel algorithm that was designed to allow simulation of Brownian dynamics of arbitrarily thin but uncrossable wormlike threads. Each polymer is represented as a discretized chain of inextensible rods and beads. A periodic cubic simulation cell is initially populated with a thermally equilibrated solution of wormlike chains, by a Monte Carlo growth algorithm. At each step of our dynamical simulation, a trial move is generated for a randomly chosen chain by taking one time step of the Brownian dynamics (BD) algorithm used in previous work on dilute solutions (Pasquali et al., 2001; Shankar et al., 2002; Montesi et al., 2005). A trial move is rejected, however, if it would cause the chosen chain to cut through any other. Whether or not a move is accepted, another chain is then chosen at random, and the process is repeated. In this work, we use an algorithm for chains with anisotropic friction, with Montesi et al. (2005), where and are longitudinal and transverse friction coefficients, respectively. Details of the algorithm are presented elsewhere (Ramanathan, 2006; Ramanathan and Morse, 2007). Here, we present results for entangled solutions of chains with and rods at concentrations . A 1 mg/ml solution of (hypothetically) monodisperse F-actin filaments with m would have .
To characterize the effect of entanglement upon bending fluctuations, we have calculated two measures of the transverse mean-squared displacement (MSD) vs. time for the middle bead of a polymer. The quantity , shown in the main plot in Figure 1, is the variance of the distance between the middle bead at time and the closest point on the contour of the same chain at an earlier time . The inset shows , in which is the transverse component (transverse to the local chain tangent) of the displacement of the middle bead from the chain’s center of mass. The quantity is not sensitive to center-of-mass diffusion, but only to displacements arising from bending fluctuations, and so approaches a finite value at long times.
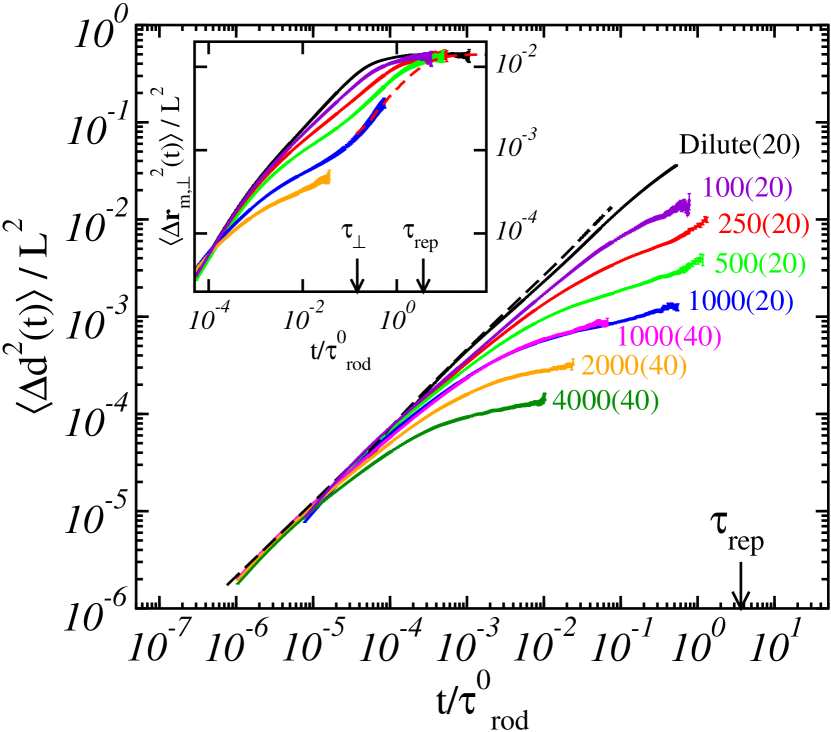
At early times, both measures of transverse MSD increase as , as predicted (Granek, 1997). With increasing concentration, both quantities become suppressed over a range of intermediate times, indicating the formation of a tube.
If each chain were confined to a tube of well-defined radius over a wide range of intermediate times, would develop a plateau, with a plateau value . Here, is defined, as in Ref. Morse (2001), as the variance of the transverse displacement of the chain from the “center” of the tube (i.e., the average chain contour) in either of two transverse directions. A plateau could appear in even in the rigid rod limit, however, due to suppression of transvserse center-of-mass motion. The suppression of at intermediate times, however, is evidence of hindered bending motion, and thus of tight entanglement. In fact, we never observe a clean plateau in either quantity. Instead, we see a crossover from growth at small to a much slower growth at intermediate times, which becomes flatter with increasing concentration and/or chain length (i.e., increasing ), with a crossover time that decreases with increasing . The suppression in is signficant only for , suggesting a crossover for .
For , our results for include both a plateau at intermediate times and an upturn at the end of this plateau. This upturn is mimicked very accurately by the results of a separate slithering-snake simulation of pure reptation of a wormlike chain (the red dashed line in the inset) (Ramanathan and Morse, 2007). Pure reptation yields a nonzero transverse MSD at times less than the reptation time because reptation occurs along a curved tube. is defined so as not to be affected by pure reptation, and shows a slightly broader plateau than .
To quantify and , we have collapsed our data for in a manner that assumes the existence of a scaling relationship . That is, we have chosen values for and an entanglement time for each set of parameters so as to collapse the data for many different values of and onto a master curve of vs. . The resulting collapse is shown in Figure 2. We display separate master curves for chains with and because early time behavior is noticeably different for discrete chains with different numbers of rods.
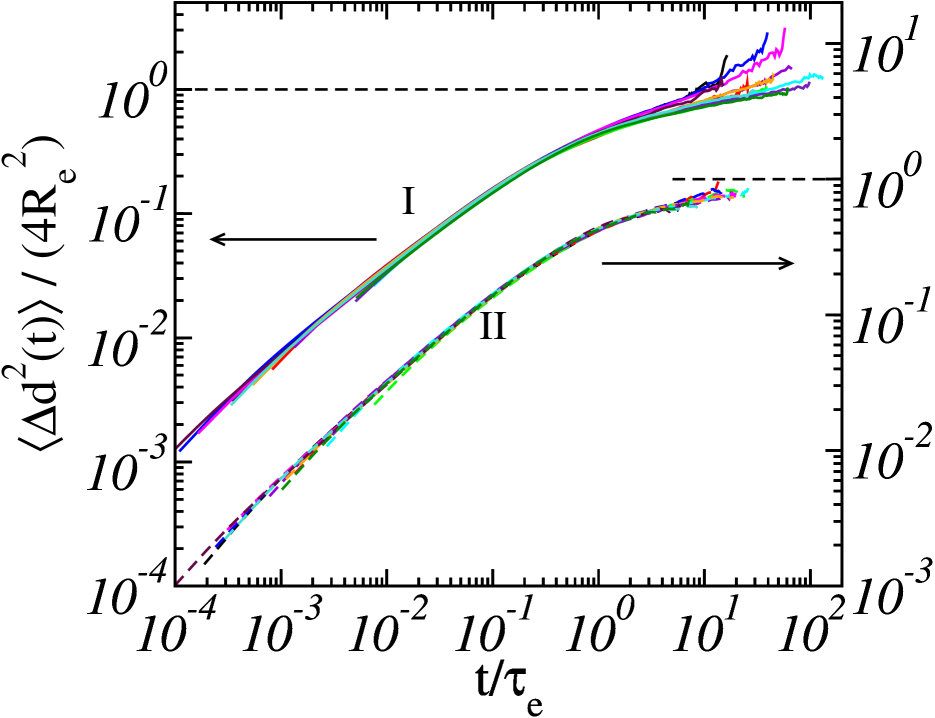
The collapse is excellent for solutions with . The horizontal dashed lines with represent an assumed long time asymptote for hypothetical systems of much longer chains, from which we have extracted estimates of .
Figure 3 shows resulting values of the dimensionless tube radius vs.dimensionless concentration for systems with .
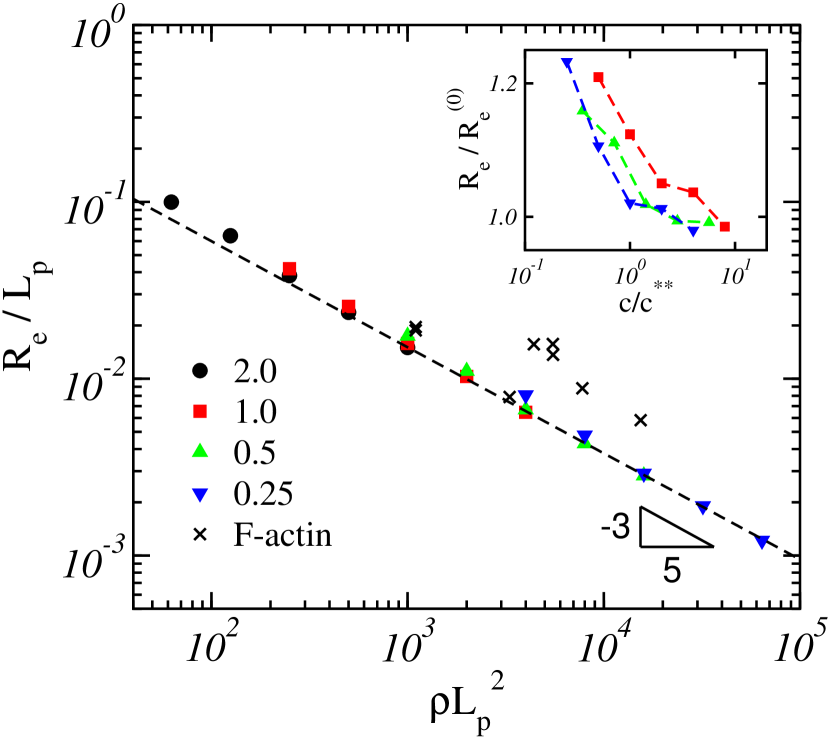
Dimensional analysis requires that the ratio be a function of dimensionless length and dimensionless concentration alone. In the tightly-entangled regime, however, we expect to become independent of , implying that must approach a function of alone for . At high concentrations, our results for different values of do indeed approach a common asymptote, which is furthermore very accurately described by the predicted relation , with (dashed black line). For each value of , also exhibits small but systematic deviations from this asymptote at lower concentrations. This deviation is seen most clearly in the inset, in which we plot the ratio vs. , where we have taken . The near collapse of the deviations from the asymptote for the stiffest 2 chains (0.25 and 0.5) is consistent with the prediction that for . (Morse, 1998a). The experimental values for in F-actin solutions (crosses) are the flouresence microscopy results of Käs et al. Käs et al. (1994, 1996), as defined and presented previously in Ref. Morse (2001).
The crossover from loose- to tight-entanglement is expected to cause a dramatic change in viscoelastic behavior. Detailed theories of linear viscoelasticity have been developed for the extreme limits of dilute solutions () Pasquali et al. (2001); Shankar et al. (2002) and of very tightly entangled solutions () Morse (1998b). Both theories make use of a formal decomposition of the stress into curvature, orientational, and tension contributions Morse (1998a), and a corresponding decomposition of the dynamic modulus (i.e., the response to an infinitesimal step strain) as a sum . In both dilute and loosely-entangled solution, and are predicted to exhibit power law decays at very early times, but to decay exponentially at times greater than the relaxation time of the longest wavelength bending mode, where . For , is thus dominated at by a more slowly decaying orientational modulus , where is a rotational diffusion time. In loosely-entangled solutions, the only predicted effect of entanglement is to increase , without significantly changing or . The plateau of magnitude in , which is present even in dilute solution, reflects the free energy cost of partially aligning an initially random distribution of rod orientations. The crossover to tight entanglement, however, is expected to cause a plateau to appear in , with a plateau value that varies as Isambert and Maggs (1996); Morse (1998a, b) for .
We have “measured” and its components by simulating stress relaxation after a rapid, small amplitude uniaxial step extension of an initially cubic periodic unit cell. Stress is evaluated using the virial tensor, as in previous simulations of dilute solutions Pasquali et al. (2001); Shankar et al. (2002). Measurements of in dilute solution by this method agree to within statistical errors with those obtained previously Pasquali et al. (2001); Shankar et al. (2002) from stress fluctuations in equilibrium.
In Figure 4, the main plot shows a non-dimensionalized sum of the two components of that are predicted and observed to exhibit an elastic plateau. The inset shows , which, as expected Morse (1998b), does not exhibit a plateau, and which is found to be almost independent of over this range of parameters. The plateau in becomes significantly greater than the limiting value of obtained in dilute solution, which arises from alone, only above an apparent crossover concentration of , above which also begins to contribute to the observed plateau. The terminal relaxation is accessed in our simulations only for , but the plateau value is always accessible.
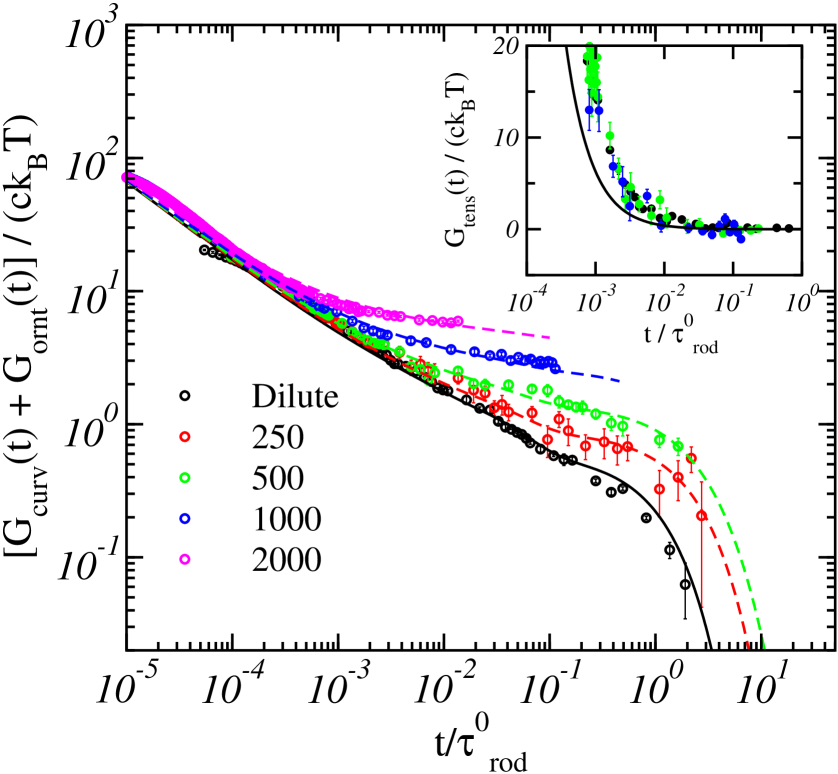
To quantify the plateau modulus, we have fit the sum to a function
| (1) |
Here, the first term on the r.h.s. is an expression for , where is a concentration-dependent rotational diffusion time, and is the prediction of Shankar et al. for in dilute solution. The quantity is the contribution of to the overall plateau modulus, which is an adjustable parameter. We have used a time constant for the relaxation of the curvature plateau. This was chosen to fit the observed decay of alone (not shown separately here) at and , and is consistent with a double-reptation model of the relaxation of the curvature plateau. Values of the rotational diffusion time were measured in separate equilibrium simulations Ramanathan (2006), which yield for . The values of obtained by fitting this data depend very little upon our choices for the time constants and .
The total plateau modulus in is a sum of orientational and curvature contributions. Figure 5 compares simulation results for and to reported values of in entangled F-actin solutions Hinner et al. (1998); Gardel et al. (2003).
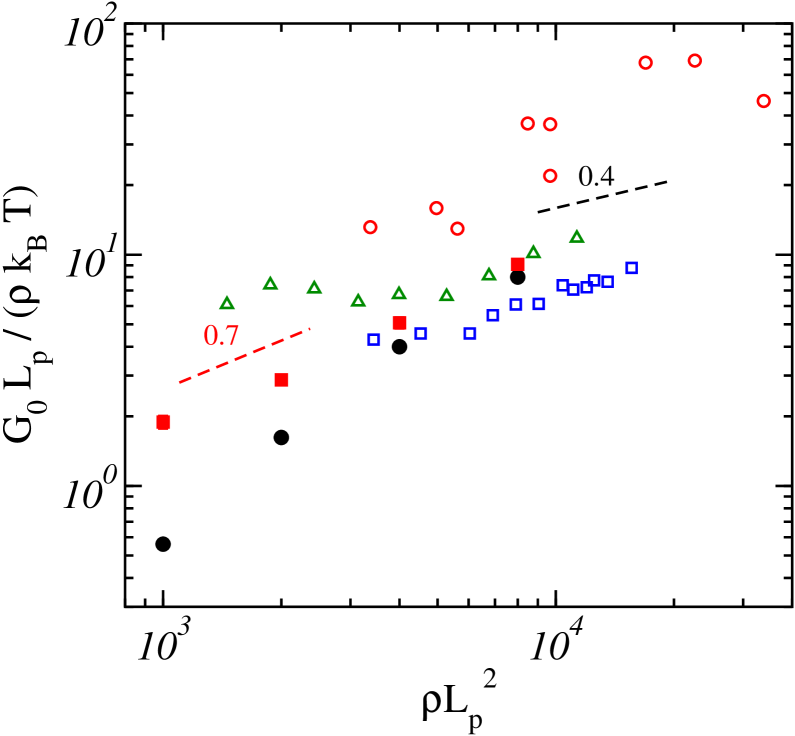
The results of Hinner et al. Hinner et al. (1998) were obtained by macroscopic rheological measurements, while those of Gardel et al. (Gardel et al., 2003) were obtained from two-particle micro-rheology. Our results for agree well with the values of Hinner et al., and are well within the scatter of results reported in the recent literature. A fit of our results for to a power of yields .
It is clear from the simulation data, however, that the range of concentrations accessed in our simulations, and most of that studied experimentally, lies within about one decade of the beginning of a broad crossover to tightly entangled behavior, below which does not contribute to . As a result of this proximity to , dominates over much of this range, while the contribution that is actually predicted to vary as in the limit increases much more rapidly from nearly zero. The results suggest that the very rough agreement between the predicted asymptotic behavior of for and measurements of in -actin may be largely fortuitious.
The isotropic-nematic (IN) transition for rodlike polymers occurs at a concentration . Values of for available model systems with other than -actin, such as Fd virus Schmidt et al. (2000b) (, , nm) and rod-like poly(benzyl glutatmate) Sato and Teramoto (1996) ( and nm) are all at least 10 times smaller than for -actin, for which . The IN transition in systems with occurs at concentrations , at which . Our rough estimate of for implies that a clear tightly-entangled isotropic regime for semiflexible rods can exist only in systems with . This is consistent with the fact that a clear rheological signature of tight entanglement has been observed only in -actin solutions.
Taken as a whole, our results both provide evidence for the correctness of a simple scaling theory for the asymptotic dependence of tube radius upon concentration in tightly-entangled solutions, and (equally importantly) clarify the limits of validity that theory, particularly as applied to rheology. It appears that bending fluctuations of rods with are signficantly hindered by entanglement only under surprisingly stringent conditions.
This work has been supported by ACS Petroleum Research Fund grant 38020-AC7, using computer resources provided by the Minnesota Supercomputer Center and the Univ. of Minnesota NSF MRSEC.
References
- Odijk (1983) T. Odijk, Macromolecules 16, 1340 (1983).
- Doi (1985) M. Doi, J. Polym. Sci., Polym. Symp. 73, 93 (1985).
- Semenov (1986) A. N. Semenov, J. Chem. Soc., Faraday Trans. 2 82, 317 (1986).
- Morse (1998a) D. C. Morse, Macromolecules 31, 7030 (1998a).
- Käs et al. (1994) J. Käs, H. Strey, and E. Sackmann, Nature 368, 226 (1994).
- Käs et al. (1996) J. Käs, H. Strey, J. X. Tang, D. Finger, R. Ezzell, E. Sackmann, and P. A. Janmey, Biophys. J. 70, 609 (1996).
- Sato et al. (1985) M. Sato, G. Leimbach, W. H. Schwarz, and T. D. Pollard, J. Biol. Chem. 260, 8585 (1985).
- Hinner et al. (1998) B. Hinner, M. Tempel, E. Sackmann, K. Kroy, and E. Frey, Phys. Rev. Lett. 81, 2614 (1998).
- Schmidt et al. (2000a) F. G. Schmidt, B. Hinner, and E. Sackmann, Phys. Rev. E. 61, 5646 (2000a).
- Gardel et al. (2003) M. L. Gardel, M. T. Valentine, J. C. Crocker, A. R. Bausch, and D. A. Weitz, Phys. Rev. Lett. 91, 158302 (2003).
- Sato and Teramoto (1996) T. Sato and A. Teramoto, Adv. Polym. Sci. 126, 85 (1996).
- Doi (1975) M. Doi, J. de Physique 36, 607 (1975).
- Morse (1998b) D. C. Morse, Macromolecules 31, 7044 (1998b).
- Pasquali et al. (2001) M. Pasquali, V. Shankar, and D. C. Morse, Phys. Rev. E 64, 020802 (2001).
- Shankar et al. (2002) V. Shankar, M. Pasquali, and D. C. Morse, J. Rheol. 46, 1111 (2002).
- Montesi et al. (2005) A. Montesi, M. Pasquali, and D. C. Morse, J. Chem. Phys. 122, 084903 (2005).
- Ramanathan (2006) S. Ramanathan, Ph.D. thesis, University of Minnesota (2006).
- Ramanathan and Morse (2007) S. Ramanathan and D. C. Morse, J. Chem. Phys. (in press) (2007), arxiv:cond-mat/0610473.
- Granek (1997) R. Granek, J. Phys. II 7, 1761 (1997).
- Morse (2001) D. C. Morse, Phys. Rev. E 63, 031502 (2001).
- Isambert and Maggs (1996) H. Isambert and A. C. Maggs, Macromolecules 29, 1036 (1996).
- Schmidt et al. (2000b) F. G. Schmidt, B. Hinner, E. Sackmann, and J. X. Tang, Phys. Rev. E. 62, 5509 (2000b).