Signatures of Many-Particle Correlations in Two-Dimensional Fourier-Transform Spectra of Semiconductor Nanostructures
Abstract
On the basis of a microscopic theory, the signatures of many-particle correlations in Two-Dimensional Fourier-Transform Spectra (2D-FTS) of semiconductor nanostructures are identified and compared to experimental data. Spectra in the photon energy range of the heavy-hole and light-hole excitonic resonances show characteristic features due to correlations, which depend on the relative polarization directions of the excitation pulses.
pacs:
78,47.+p, 42.50.Md, 42.65.Re, 78.67.-nRecent reports illustrate the potential of a novel method, known as “Two-Dimensional Fourier-Transform Spectroscopy” (2D-FTS), for the investigation of many-particle induced correlations in semiconductor structures steven05 ; borca05 ; steven06 . 2D-FTS is based on a four-wave-mixing experiment, where three excitation pulses are separated in time and is heterodyne detected to fully characterize its phase. The signal is transformed into frequency domain (emission frequency) and (excitation frequency), both with respect to real time and time separation of the first two pulses, respectively. The third pulse is delayed with respect to the second one by . 2D-FTS is widely used to study vibrational ernst ; Golonzka2001 ; Zanni2001 and electronic excitations mukamel ; Hybl2001 ; Brixner2005 in molecules. Applying 2D-FTS in the optical regime we investigate the complex interplay between exciton, biexciton and continuum excitations, in semiconductor nanostructures.
In previous publications demonstrating 2D-FTS of semiconductors steven05 ; borca05 ; steven06 , the experimental results were compared to a phenomenological theory based on extending the Optical Bloch Equations to include terms that describe excitation induced dephasing (EID) Wang1993 ; Hu1994 and excitation induced shift (EIS) Shacklette2002 . Here, we use a microscopic theory to calculate 2D-FTS. Furthermore, the model predicts that the 2D-FTS qualitatively depend on the polarizations directions of the excitation pulses. Our results demonstrate that for 2D-FTS, the influence of many-particle correlations on the spectra can clearly be identified and are in agreement with the experimental findings.
For the qualitative modeling of 2D-FTS in such systems and in order to keep the numerical requirement within reasonable limits we use a microscopic many-body theory and apply it to a one-dimensional tight-binding model. Therefore, a quantitative agreement between theory and experiment can not be expected. It has, however, been shown that many important signatures of nonlinear optical experiments performed on quantum wells can qualitatively well be reproduced by this model sieh_991 ; sieh_99 ; buch ; meier00 ; brick01 ; finger02 ; euten99 .
The optical nonlinearities are treated up to third order in the coherent -limit beyond the Hartree-Fock level. In order to separate the correlation effects from those due to the first-order Coulomb interaction (i.e., Hartree-Fock) we use a set of equations for the interband coherence and two-exciton amplitude which in symbolic form reads sieh_99 ; buch ; axt ; lindberg
| (1) | |||||
| (2) |
In fact, all terms in the microscopic version of the equations depend on the spatial indices of the tight-binding model as well as band indices, referring to electron, heavy-hole (h) and light-hole (l) bands, respectively. Details of the model and the set of microscopic equations that are used in our numerical evaluations are presented and discussed in Ref.buch . In Eqs. (1) and (2) is the Coulomb matrix that is responsible for the existence of exciton and biexciton resonances and interactions between them. In Eq. (1) for the polarization , the Hartree-Fock terms are given by the kinetic term , the renormalization term and the coupling to the light field containing the Pauli-blocking and the linear term . The correlation term beyond Hartree-Fock is given by . As given in Eq. (2) the biexciton correlation is driven by . The biexciton energy is . Coherent -equations with h- and l-transitions have been previously analysed, see e.g., meier00 ; finger02 ; binder02 .
The quantum well samples used in this study show heavy hole and light hole excitonic resonances. Their spectral positions are determined by the kinetic parts of Eqs. (1) and (2), which also contain the phenomenological dephasing rates, for excitons and for biexcitons. By such rates we can distinguish biexcitons formed by h-excitons (), by l-excitons () and mixed h- and l-excitons (). The optical transitions are given by dipole matrix elements chosen to model the relevant selection rules for dipole transitions in III-V semiconductor structures buch ; brick01 . This model agrees with the selection rules for the nonlinear polarization presented by M. Lindberg et al. for the three beam situation lindberg94 .
Based on this model we present microscopic calculations for 2D-FTS for semiconductor structures. We choose realistic material parameters, ratio between h- and l-effective masses and dipole matrix elements, energetic h- and l-offset, and Coulomb strength. The experimental conditions such as pulse duration, detuning, dephasing times, polarization directions and the sequence of the pulses are incorporated into the model. The dephasing times of the various excitons and biexcitons are taken as phenomenological parameters.
In this paper, we concentrate on the situation where the first pulse enters the nonlinear polarization conjugated, the so called rephasing case steven06 . The figures show the amplitude , where the electric field is proportional to the third-order polarization multiplied by the imaginary unit, i.e., . The emission frequency, , is given on the horizontal-axis. The emission frequency is used to define the sign of frequency, thus the conjugation of the first pulse means that the excitation frequency, , is negative. It is given on the vertical axis. The h- and l-exciton peaks then show up on the diagonal in the left-upper (low energy) and right-lower (high energy) corners, respectively, while the off-diagonal peaks are due to coupling between h- and l-exciton resonances.
For the particular system considered in this paper, i.e., a GaAs quantum well, the nonlinear optical properties have been explored quite extensively in the past using four-wave-mixing and pump-probe experiments. This system therefore presents a good testing ground for the exploration of the features of 2D-FTS. In particular, the sample used in the experiment is a 10 period multiple quantum well structure with 10 nm GaAs wells and 10 nm AlGaAs barriers. It is held at 8K. Experimental spectra are obtained using the apparatus described by Zhang et al. steven05 , with the addition of polarizing optics.
In the following we concentrate on the amplitude features of 2D-FTS. The distribution of the heights of the peaks strongly depends on the interplay of the material and experimental parameters, including tuning of the excitation pulses, shape and temporal full width at half maximum (FWHM) of the pulses, ratio of h- vs. l-dipole matrix elements (which due to band-mixing in the quantum well structure depart from their bulk values) and dephasing times. We found that is a good choice for modeling the experiment. The simplest approach to model the h-l-exciton system is a three level system (V-system) without any interactions, but with coupling of two excited levels (modeling the h- and l-excitonic resonances) to a common ground state. In this model it is not possible to obtain a peak height distribution in the 2D-FTS features that is asymmetrical with respect to the diagonal, if the excitation pulses are extremely short and . The asymmetry of such spectra in our experiments on quantum well systems appears because of the interplay of several effects: different dipole matrix elements, dephasing times of excitons and biexcitons, degree of overlap with the spectrum of the excitation pulses and many-particle couplings within the system, as supported by the theoretical spectra. In our model the electric field of the excitation pulses is proportional to , where is the Gaussian width of around 115 fs, corresponding to intensity FWHM of 135 fs and a spectral FWHM of 13.5 meV.
In Figure 1 we compare experimental (first column) and theoretical results for the amplitudes from the full calculation (second column) and the Hartree-Fock part (third column) for , co-linear , and cross-linear polarizations. In all figures the central excitation energy is 1meV above the l-exciton in order to compensate for the small dipole matrix element of the l-exciton.
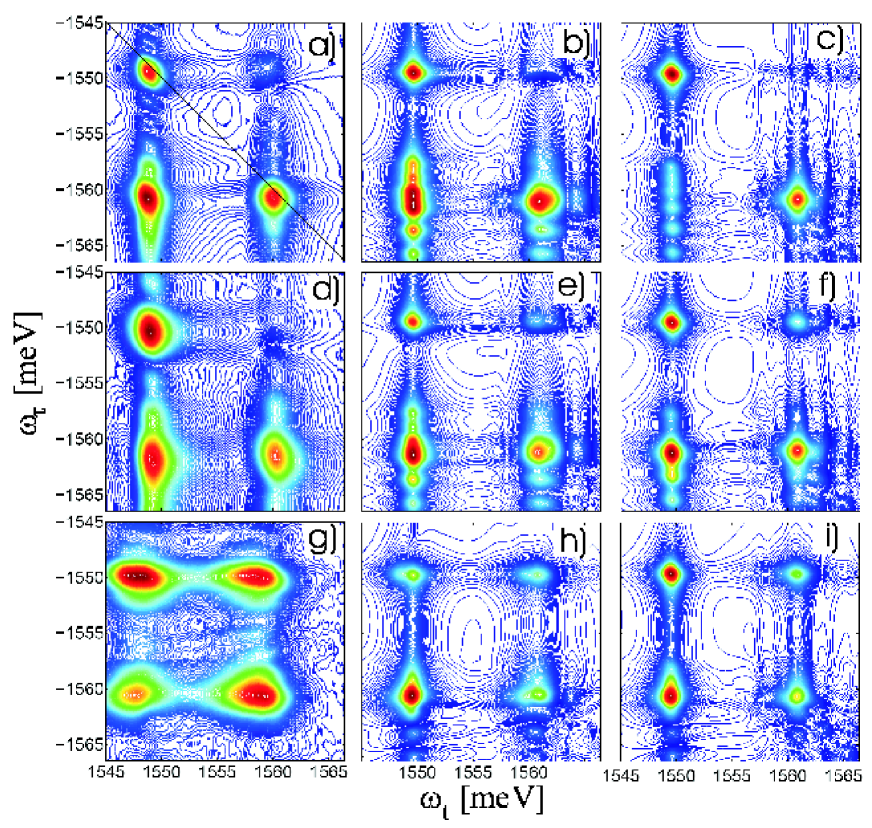
Numerical results for the full calculation (second column) show agreement with experiments, not only for the h-, l-exciton and mixed peaks, but also for the h-continuum at higher (the vertical continuum contributions in the experimental data are more apparent in a previous publication borca05 ). Note that in the theoretical figures, the h-continuum, appearing close to the l-excitonic peaks as dominantly vertical structures, is decomposed into discrete peaks because only sites have been taken in the tight-binding approach for numerical reasons. It should be noted that the continuum appears dominantly as a vertical feature close to the mixed peaks in the lower-left corner. This demonstrates that the lower energetic part of the continuum can not be seen as a pure inhomogeneous spectrum in the model containing the many-particle interaction buch ; irina . In an interaction-free model the continuum would in fact be purely inhomogeneous, i.e., it would consist of independent two-level systems belonging to a spectrum of -vectors. If this were true, one would expect a feature of continua along the main diagonal close to the l-excitonic peak in the right-lower corner. In the frame of the Hartree-Fock approximation, where the correlations are ignored, the features due to the h-continuum clearly show up at the higher energies for all polarization cases (Fig. 1 third column).
The co-linear situation (Fig. 1 middle row) looks similar to the co-circular case (Fig. 1 upper row), as is to be expected from the selection rules. It is remarkable, that the upper right non-diagonal mixed peak for co-circular case (Fig. 1b) is very small. As a comparison with a Hartree-Fock result (Fig. 1c) shows, this is not due to correlations, but results from an interplay of detuning, dipole matrix elements, and dephasing times. The mixed signature in the left-lower corner for the Hartree-Fock calculation (Fig. 1c) shows discrete weak features due to the h-l-excitons and the h-continuum. The many-body correlations lead to the increase of this mixed signature at higher excitation energy and vertical features of the continuum as well. Unlike to the co-circular case, the influence of correlations on the mixed signature at higher excitation energy is less pronounced for the co-linear case. The Hartree-Fock approximation (Fig. 1f) and the full calculation (Fig. 1e) do not differ that much for the co-linear case. This can be understood by consideration of a simple V-system, where for the excitation the h- and l-transitions resemble two independent two-level systems. The linear case contains both and transitions, thereby such excitation couples the h- and l-exciton transitions resulting in two V-systems. This coupling generates the mixed signatures and appears for both linear polarized cases in the Hartree-Fock calculations (Fig. 1f: XXX, i: YXX).
The cross-linear polarized excitation case () shows additional signatures from two-exciton resonances (bound and unbound biexcitons), as predicted by the selection rules and supported by the theoretical results (Fig. 1h). This is due to a suppression of the excitonic features with respect to the biexcitonic ones finger02 . Bound biexcitons show up on the low emission-energy side and unbound ones on the high emission-energy side of the exciton sieh_991 ; sieh_99 ; finger02 . The biexciton contribution results in a horizontal elongation of the peaks compared to the -case. The Hartree-Fock calculation (Fig. 1i) clearly shows, that the horizontal elongation of the spectra (Fig. 1h) is due to correlations, i.e., bound and unbound two-exciton states. In the Hartree-Fock limit the horizontal elongation is absent (Fig. 1i). Interestingly, the continuum contribution and respectively the elongation of the signatures at higher excitation energy is less developed as compared to the co-linear case, which is supported by the experiment (Fig. 1d,g). For the cross-linear situation one can show buch ; irina that indeed the continuum becomes suppressed due to cancellation effects that result from Coulomb-correlations in this situation. Indeed, the Hartree-Fock calculation shows a more pronounced continuum contribution (and concomitantly of the superimposed l-exciton peak) in the right-lower corner of the spectrum, as compared to the full -calculation.
It is surprising that the lower left non-diagonal peak is the strongest one in the theoretical spectra for the -case (Fig. 1h), in contrast to the experimental data (Fig. 1g), where the h-peak is the strongest one. At present, the reason for this discrepancy is not clear. The peak in question is a mixture of three contributions, the h- and l-excitonic resonances and the h-continuum. Therefore it is reasonable to assume an effective dephasing of this peak, which is not included in our present treatment.
A comparison between the results of the full and the Hartree-Fock calculation shows that the left-lower non-diagonal peak is less prominent in the latter spectra. This difference suggests that correlations enhance this signature in the full treatment. These couplings could well be more sensitive to relaxation processes than the trivial ones which already appear in the V-system or within a model, which only considers the phase-space (Pauli-blocking) nonlinearities.
We have not studied the dependence of the peak heights on the spectral shape of the incident laser pulses which we have here always taken as Gaussian. Our calculations have shown that the temporal duration and thus the spectral width of the laser beams strongly influences the 2D-FTS. Therefore, deviations of the pulse envelopes from a Gaussian shape will clearly significantly alter the peak heights.
The amplitude of the non-diagonal signatures relative to the diagonal ones generally depends on . Already for a V-system one finds that the two non-diagonal peaks show beating with respect to , where the period is , with the energetic h- and l-exciton separation. In the experimental data shown here fs has been taken. With meV, corresponding to a beating period of 360 fs, this is close to the situation of maximum non-diagonal peaks. However, as mentioned above, the left-lower signature is definitely too strong if compared to the experiments. In our calculations for the -case we have used fs.
It should be noted that biexcitonic features can be observed in different kinds of nonlinear optical experiments for certain polarization cases. The 2D-FTS always show the presence of biexcitonic features in the plots for amplitude or real part (not shown here), albeit to different extent, depending on polarization.
Since 2D-FTS is based on a photon-echo experiment, it is not surprising that it can be used to measure the dephasing time even in the presence of inhomogeneous broadening. Specifically, inhomogeneous broadening will elongate peaks along the diagonal, while the width perpendicular to the diagonal is inversely proportional to . However, 2D-FTS is clearly superior to a traditional one-dimensional photon echo measurement when multiple resonances are involved, as is the case here. The photon-echo signal mixes the contributions of the resonances, possibly leading to ambiguity in assigning the dephasing times. This ambiguity does not occur in 2D-FTS as the peaks corresponding to distinct resonances are well separated.
A traditional one-dimensional transient four-wave-mixing (or photon echo) measurement also has trouble yielding when there are strong many-body correlations, which may result in a rapid decay of the signal unrelated to cundiff1996 . 2D-FTS is much better at revealing of individual resonances. As an example we consider theoretical 2D FTS-amplitude plots for cross-linearly polarized pulses, which show the correlation-induced features most prominently.
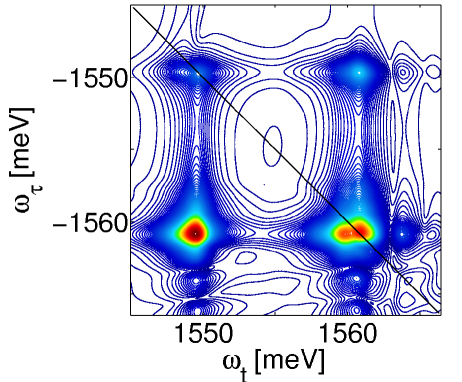
However, now the l-transitions have been given the same dephasing time as the h-ones, i.e., ps, while the theoretical results shown in Figure 1 correspond to ps and ps. Figure 2 shows, that the distribution of the peak heights changes due to longer dephasing time of l-exciton. The comparison with Fig. 1h demonstrates the large sensitivity of the 2D-spectra on -times.
In summary, we have investigated correlation effects in quantum well systems by applying the Two-Dimensional Fourier-Transform Spectroscopy (2D FTS). This method provides a wide spectrum of information about the many-body correlations simultaneously, such as: the strength of the couplings between excitons, biexcitons and continua, character of continuum excitations, dephasing times, and dependences of these features on the polarization directions.
A first comparison between experiment and theory has been performed on the basis of a microscopic model. Depending on polarization directions of the excitation pulses, characteristic signatures of many-particle correlations can be identified in the amplitude spectra. Differences between experiment and theory point towards the action of relaxation processes on many-particle correlations, which are not included in the present purely coherent treatment. Additional important information is contained in the real- and imaginary part of the spectra. Work is in progress to analyse these parts of the signal and to exploit these spectra for semiconductor structures in the energetic range of both excitonic and continuum transitions.
This work has been supported by the Optodynamics Center of the Philipps-University Marburg, and by the Deutsche Forschungsgemeinschaft (DFG), and by the Research Centre Jülich (NIC). T.M. thanks the DFG for support via a Heisenberg fellowship (ME 1916/1). The work at JILA was supported DOE/BES grant DE-FG02-02ER15346.
References
- (1) T. Zhang, C. N. Borca, X. Li, and S. T. Cundiff, Opt. Express 13, 7432 (2005).
- (2) C. N. Borca, T. Zhang, X. Li, and S. T. Cundiff, Chem. Phys. Lett. 416, 311 (2005)
- (3) X. Li, T. Zhang, C. N. Borca, and S. T. Cundiff, Phys. Rev. Lett. 96, 057406 (2006).
- (4) R. R. Ernst, G. Bodenhausen, and A. Wokaun, “Principles of Nuclear Magnetic Resonance in One and Two Dimensions” (Oxford Science Publications, New York, 1987).
- (5) O. Golonzka, M. Khalil, N. Demirdöven, and A. Tokmakoff, Phys. Rev. Lett. 86, 2154 (2001).
- (6) M. T. Zanni, N. -H. Ge, Y. S. Kim, and R. M. Hochstrasser, Proc. Nat. Acad. Sci. 98, 11265 (2001).
- (7) S. Mukamel, Annu. Rev. Phys. Chem. 51, 691 (2000).
- (8) J. D. Hybl, A. A. Ferro, and D. M. Jonas, J. Chem. Phys. 115, 6606 (2001)
- (9) T. Brixner, J. Stenger, H. M. Vaswani, M. Cho, R. E. Blankenship, and G. R. Fleming, Nature 434, 625 (2005).
- (10) H. Wang, K. Ferrio, D. G. Steel, Y. Z. Hu, R. Binder, and S. W. Koch, Phys. Rev. Lett. 71, 1261 (1993).
- (11) Y. Z. Hu, R. Binder, S. W. Koch, S. T. Cundiff, H. Wang, and D. G. Steel, Phys. Rev. B 49, 14382 (1994).
- (12) J. M. Shacklette, and S. T. Cundiff, Phys. Rev. B 66, 045309 (2002).
- (13) C. Sieh, T. Meier, F. Jahnke, A. Knorr, and S. W. Koch, P. Brick, M. Hübner, C. Ell, J. Prineas, G. Khitrova, and H. M. Gibbs, Phys. Rev. Lett. 82, 3112 (1999).
- (14) C. Sieh, T. Meier, A. Knorr, F. Jahnke, P. Thomas, and S. W. Koch, Eur. Phys. J. B 11, 407 (1999).
- (15) T. Meier, P. Thomas, and S. W. Koch, “Coherent Semiconductor Optics - From Basic Concepts to Nanostructure Applications” (Springer, Berlin, 2007).
- (16) T. Meier, S. W. Koch, M. Phillips, and H. Wang, Phys. Rev. B 62, 12605 (2000).
- (17) P. Brick, C. Ell, S. Chatterjee, G. Khitrova, and H. M. Gibbs, T. Meier, C. Sieh, and S. W. Koch, Phys. Rev. B 64, 075323 (2001).
- (18) E. Finger, S. P. Kraft, M. Hofmann, T. Meier, S. W. Koch, W. Stolz, and W. W. Rühle, phys. stat. sol. (b) 234, 424 (2002).
- (19) A. Euteneuer, E. Finger, M. Hofmann, W. Stolz, T. Meier, P. Thomas, S. W. Koch, W. W. Rühle, R. Hey, and K. Ploog, Phys. Rev. Lett. 83, 2073 (1999).
- (20) V. M. Axt, and A. Stahl, Z. Phys. B 93, 195 (1994); 93, 205 (1994)
- (21) M. Lindberg, Y. Z. Hu, R. Binder, and S. W. Koch, Phys. Rev. B 50, 18060 (1994).
- (22) I. Rumyantsev, N. H. Kwong, R. Takayama, and R. Binder Phys. Rev. B 65, 245325 (2002)
- (23) M. Lindberg, R. Binder, and Y. Z. Hu, and S. W. Koch, Phys. Rev. B 49, 16942 (1994).
- (24) I. Kuznetsova, Diploma Thesis, (Marburg, 2003), unpublished.
- (25) S. T. Cundiff, M. Koch, W. H. Knox, J. Shah, and W. Stolz, Phys. Rev. Lett. 77, 1107 (1996).