Paramagnon-induced dispersion anomalies in the cuprates
Abstract
We report the self-energy associated with RPA magnetic susceptibility in the hole-doped Bi2Sr2CuO6 (Bi2201) and the electron-doped Nd2-xCexCuO4 (NCCO) in the overdoped regime within the framework of a one-band Hubbard model. Strong weight is found in the magnetic spectrum around at about 360 meV in Bi2201 and 640 meV in NCCO, which yields dispersion anomalies in accord with the recently observed ‘waterfall’ effects in the cuprates.
pacs:
79.60.-i, 71.38.Cn, 74.72.-h, 71.45.GmVery recent angle-resolved photoemission (ARPES) experiments in the cuprates have revealed the presence of an intermediate energy scale in the 300-800 meV range where spectral peaks disperse and broaden rapidly with momentum, giving this anomalous dispersion the appearance of a ‘waterfall’RonK ; Ale ; Non ; Feng ; Valla ; PanDing . Similar self-energies have also been adduced from optical dataTimCar . This new energy scale is to be contrasted with the well-known low energy ‘kinks’ in the 50-70 meV range, which have been discussed frequently in the cuprates as arising from the bosonic coupling of the electronic system with either phononspkink and/or magnetic modesmkink . Although low energy plasmonsHedLee ; WZD are an obvious choice for the new boson, analysis indicates that the plasmons lie at too high an energy of 1 eV to constitute a viable candidateMBII . Here we demonstrate that paramagnons provide not only an explanation of the energy scale but also of the other observed characteristics of the waterfall effect in both hole and electron doped cuprates.
For this purpose, we have evaluated the self-energy associated with the RPA magnetic susceptibility in the hole-doped Bi2Sr2CuO6 (Bi2201) and the electron-doped Nd2-xCexCuO4 (NCCO).foot6 In order to keep the computations manageable, the treatment is restricted to the overdoped systems where magnetic instabilities are not expected to present a complication. Our analysis proceeds within the framework of the one-band Hubbard Hamiltonian, where the bare band is fit to the tight-binding LDA dispersionArun3 ; foot3 . We incorporate self-consistency by calculating the self energy and susceptibility using an approximate renormalized one-particle Green function
| (1) |
where . Here, are bare energies and is the chemical potential, and the renormalization factor is . The associated magnetic susceptibility is
| (2) |
where is a positive infinitesimal, is the Fermi function. The RPA susceptibility is given by
| (3) |
with denoting the Hubbard parameter. The self-energy can be obtained straightforwardly from the susceptibility via the expressionBrEng (at )
| (4) |
Concerning technical details, we note that for the generic purposes of this study, all computations in this article employ a fixed value =0.5, which is representative of the band dispersions observed experimentally in hole as well as electron doped cuprates.foot2 Self-consistency is then achieved approximately by determining values of the chemical potential and the Hubbard parameter to keep a fixed doping level and to ensure that the bands are indeed renormalized by the average factor . The procedure is relatively simple, but it should capture the essential physics of the electron-paramagnon interaction, although our treatment neglects the energyfoot4 and momentum dependencies of . Note also that in the overdoped regime considered, the effective values in Bi2201 and NCCO are small enough that the system remains paramagnetic and the complications of the antiferromagnetic instability are circumvented. Specifically, the presented results on Bi2201 are for with eV and , while for NCCO, with eV and .
Figure 1 summarizes the results for Bi2201. We consider Figs. 1(a) and (b) first, which give the real and imaginary parts of the self-energy at several different momenta as a function of frequency. The theoretical self-energies, which refer to Bi2201, should be compared directly with the corresponding experimental data (gold squaresNon ), although available experimental points for Bi2212Feng and La2-xSrxCuO4 (LSCO)Valla are also included for completeness. The agreement between theory and experiment is seen to be quite good for the real part of the self-energy in (a), while theory underestimates the imaginary part of the self-energy by a factor of 2. That the computed is smaller than the experimental one is to be generally expected since our calculations do not account for scattering effects beyond those of the paramagnons. Here, we should keep in mind that there are uncertainties inherent in the experimental self-energies due to different assumptions invoked by various authors concerning the bare dispersions in analyzing the data. In particular, Feng et al.Feng extract the bare dispersion by assuming that is always positive and goes to zero at large energies. Other groupsNon ; Ale2 compare their results to LDA calculations and argue that must become negative at higher energies. Our computed in Fig. 1(a) becomes negative over the range 0.35-0.9 eV in certain -directions. Interestingly, various computed colored lines in (a) and (b) more or less fall on top of one another, indicating that the self-energy is relatively insensitive to momentum, especially below the Fermi level, consistent with experimental findingsValla , even though possesses a fairly strong frequency dependence.
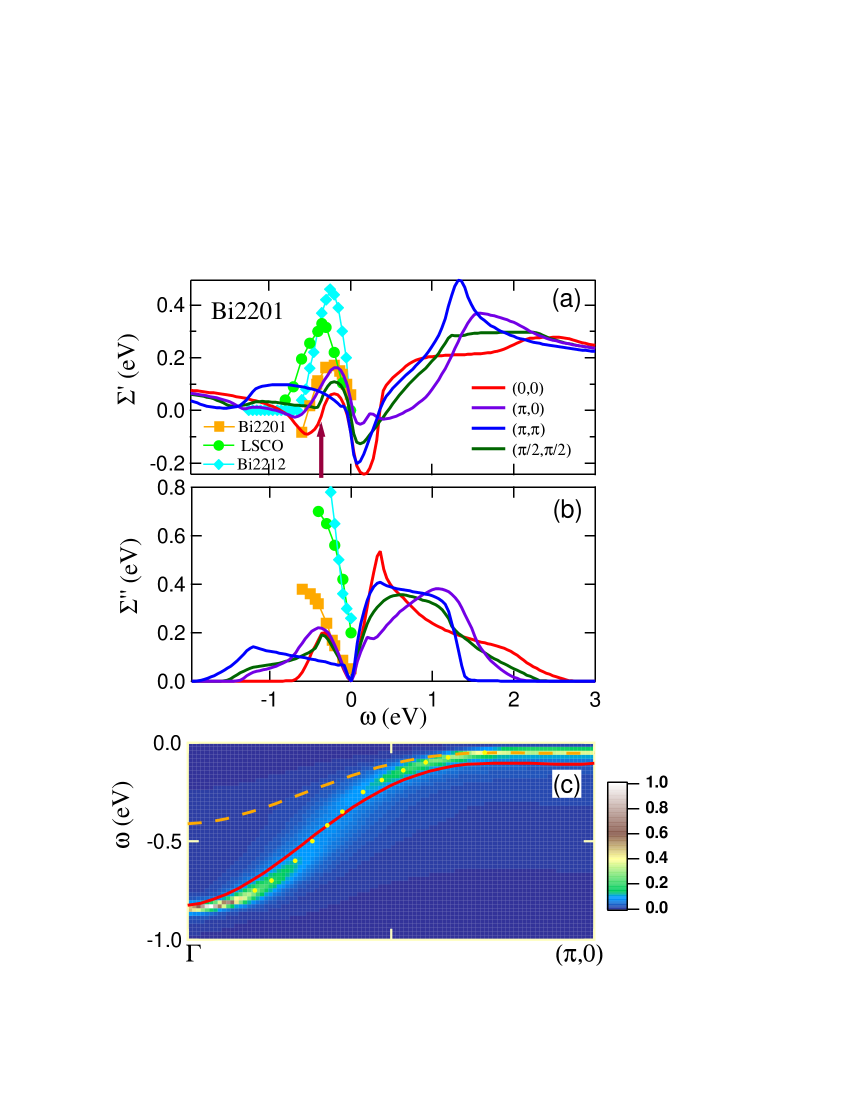
Fig. 1(c) gives further insight into the nature of the spectral intensity obtained from the self energy of Eq. 4. The spectral intensity shown in the color plot of the figure is representative of the ARPES spectrum, matrix element effectsSep notwithstanding. The peak of the spectral density function defined by taking momentum density cuts (MDCs), shown by yellow dots, follows the renormalized dispersion (orange dashed line) up to binding energy of about 200 meV. It then disperses to higher energies rapidly (waterfall effect) as it catches up with the bare dispersion (red solid line) around . In fact, near , the dressed spectral peak lies slightly below the bare band. The width of the spectral function is largest in the intermediate energy range of 200-600 meV, where its slope also is the largest. This behavior of the spectral function results from the presence of peaks in the real and imaginary parts of the self-energy in the 200-500 meV energy range discussed in connections with Figs. 1(a) and (b) above. It is also in accord with the waterfall effect observed in ARPES experiments, although the sharpness of the theoretically predicted waterfall in Fig. 1(c) is less severe than in experiments, which may be due to limitations of our model, including the approximations underlying our treatment of the susceptibility.
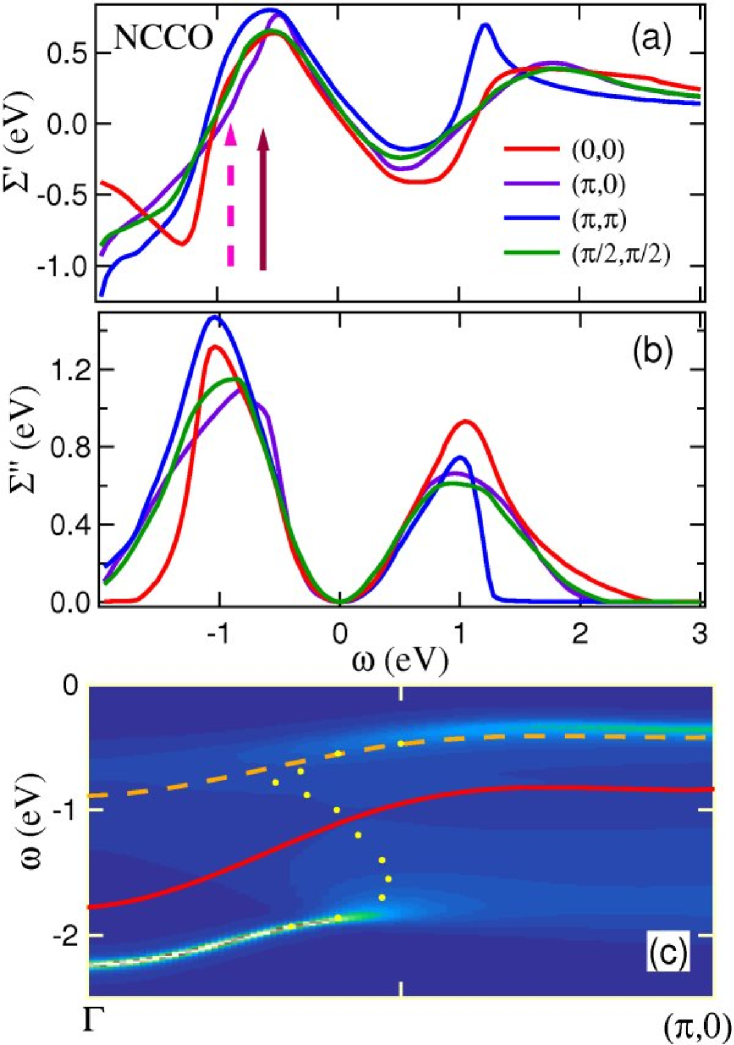
Fig. 2 considers the case of electron doped (overdoped) NCCO. The peak in in Fig. 2(a) lies at binding energies of 0.5-0.6 eV (in different -directions) with a height of 0.55-0.7 eV. Correspondingly, the peak in in Fig. 2(b) lies at a binding energy of 0.7-1.1 eV with a height of 1-1.4 eV. Comparing these with the results of Fig. 1, we see that the self-energy effects in NCCO are much larger than in Bi2201. Our computed shift of 300 meV in the position of the peak in to higher binding energy in going from Bi2201 to NCCO is in good accord with the experimentally reported shift of 300 meVPanDing . The dispersion underlying the dressed Green function, which may be tracked through the yellow dots, is highly anomalous and presents a kink-like feature quite reminiscent of the more familiar low energy kinks in the 50 meV range around the -directionLEK , which have been discussed frequently in the cuprates. This strong bosonic coupling is also reflected in the fact that the band bottom in NCCO lies several hundred meVs below the bare LDA band in Fig. 2(c). It is interesting to note that the self-energies of Figs. 1 and 2 display a ‘mirror-like’ symmetry: The peaks below the Fermi energy in and for Bi2201 in Fig. 1 are smaller than those above the Fermi energy, but the situation reverses itself for NCCO in Fig. 2 in that now the peaks below the Fermi energy become larger than those above the Fermi energy.
The aforementioned shift of the peak in to higher energy in NCCO can be understood in terms of the characteristics of the magnetic susceptibility. Figure 3 compares in Bi2201 and NCCO the imaginary part , which is seen from Eq. 4 to be related directly to the real as well as imaginary part of the self-energy. is seen to be quite similar in shape along the to line in Bi2201 and NCCO, except that in NCCO the band of high intensity (the yellowish trace) extends to a significantly higher energy scale. In contrast, in the two systems differs sharply around . These differences reflect those in the low-energy magnetic response of the two cuprates. NCCO with strong magnetic response around exhibits a nearly commensurate AFM order, while Bi2201 is very incommensurate, with peaks shifted toward . In fact, the high energy peaks in the self-energy in Figs. 1 and 2 are tied to the flat-tops near at eV in Bi2201 (solid arrow), and near both at eV (solid arrow) and at eV (dashed arrow) in NCCO. Above these energies the weight in falls rapidly, going to zero near an energy .
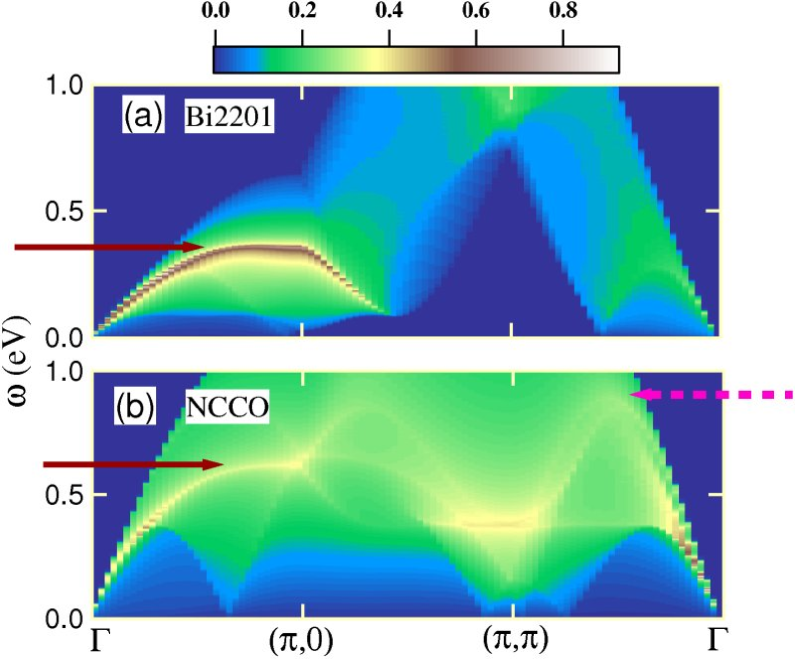
A reference to Figs. 1(a) and 2(a), where the energy in Bi2201, and the energies and in NCCO are marked by arrows, indicates that the peaks in are correlated with these features in the magnetic susceptibility. In this spirit, the shift in the peak in to higher energy in going from Bi2201 to NCCO reflects the fact that feature in at in NCCO (dashed arrow in Fig. 2(a)) lies at a higher energy than the feature in Bi2201 (arrow in Fig. 1(a)). Notably, when the Stoner factor is large, a peak in arises from a peak in , which in turn is associated with nesting of features separated by in energy. In the present case, the nesting is from unoccupied states near the Van Hove singularity (VHS) at to the vicinity of the band bottom at , so eV in Bi2201. The larger value of in NCCO reflects the shift of the Fermi energy to higher energies in an electron-doped material.
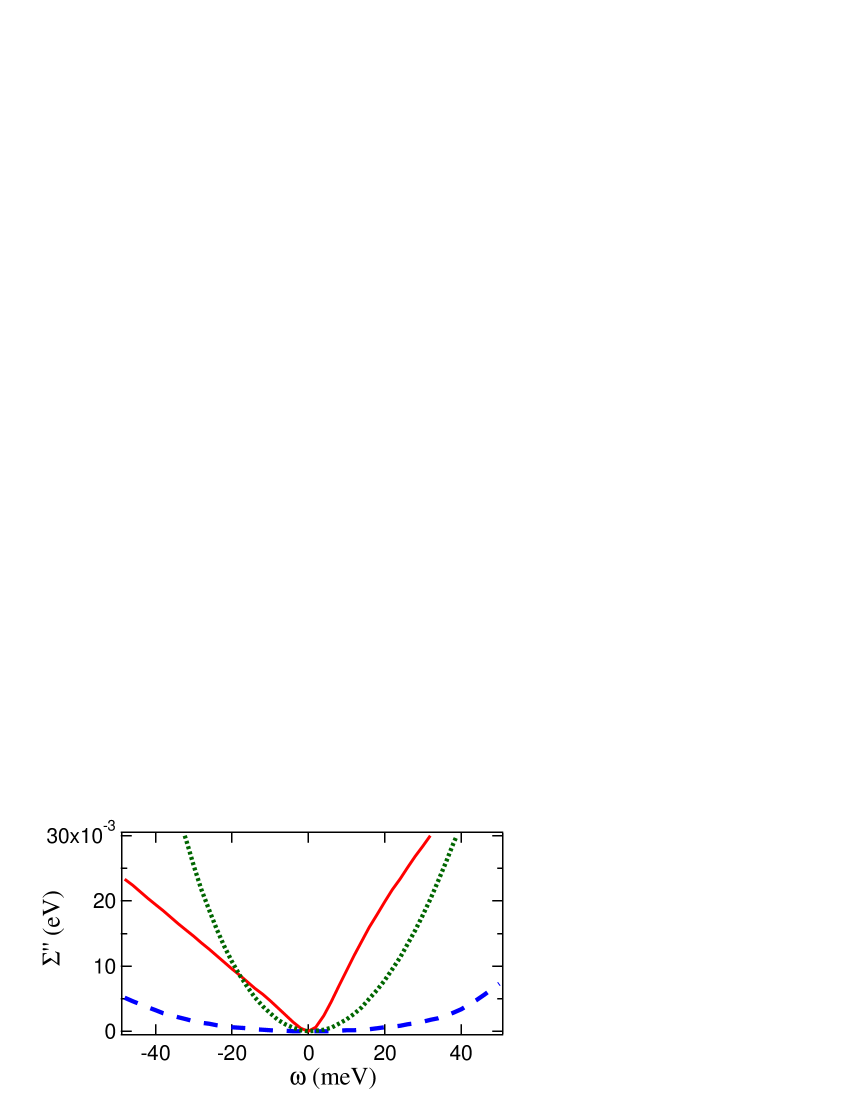
A notable difference between electron and hole doping is the low- behavior of , which is quadratic in for electron-doping in Fig. 2(b), but nearly linear for hole-doping in Fig. 1(b). The linearity for hole-doping, reminiscent of marginal Fermi liquid physics, is associated here with the proximity of the chemical potential to the VHS. This point is considered further in Fig. 4 where is shown in Bi2201 at the point for three different values of the chemical potential. When the chemical potential lies at the VHS (red line), varies linearly, but when it is shifted by meV above or below the VHS, the behavior changes rapidly to become parabolic.
The strong magnetic scattering discussed in this study in the case of overdoped cuprates should persist into the underdoped regime, where the Stoner factor is expected to become larger. In fact, this scattering is a precursor to the magnetically ordered state near half-filling and it is responsible for opening the magnetic gap. In contrast, a number of authors have related the presence of waterfall-like effects near half-filling to ‘Mott’ physics associated with AFM fluctuationsKFul ; Mano ; WTW , but have difficulty explaining why these effects persist into the overdoped regime.
The possible doping dependence of has been an important issue in connection with electron-doped cuprates. A doping-dependent is suggested by a number of studies in the hole-doped cuprates as well. These include: Optical evidence of Mott gap decreaseoptU ; ARPES observation of very LDA-like bands in optimally and overdoped materials; models of the magnetic resonance peakmagresU ; and, a strongly doping-dependent gap derived from Hall effect studiesAndo . The -renormalization of in Eq. 2 bears on this question and gives insight into how the value of enters into the magnetic response of the system. Recall that the susceptibility is often evaluated in the literature via Eq. 3 using experimental band parameters, but without the factor of Eq. 2 in , which yields a scaling rather than the correct scaling of . This can be corrected by replacing the in the Stoner factor by
| (5) |
Indeed, our Hubbard parameter for NCCO of is closer to the value at half-filling than is generally found.foot5
In conclusion, we have shown that the higher energy magnetic susceptibility in the cuprates has considerable weight near and that this leads to a high energy kink or waterfall-like effect in dispersion in both electron and hole-doped cuprates, providing an explanation of such effects observed recently in ARPES. Although our analysis is limited to the overdoped regime, we expect strong magnetic scattering to persist into the underdoped regime. This point however bears further study.
This work is supported by the US Department of Energy contract DE-AC03-76SF00098 and benefited from the allocation of supercomputer time at NERSC and Northeastern University’s Advanced Scientific Computation Center (ASCC).
References
- (1) F. Ronning et al., Phys. Rev. B71, 094518 (2005).
- (2) J. Graf et al., to be published, Phys. Rev. Lett.
- (3) W. Meevasana et al., unpublished.
- (4) B.P. Xie, et al., cond-mat/0607450.
- (5) T. Valla et al., cond-mat/0610271.
- (6) Z.-H. Panet al., cond-mat/0610442.
- (7) J. Hwang et al., cond-mat/0610488.
- (8) A. Lanzara et al., Nature (London) 412, 510 (2001); X.J. Zhou, et al., Phys. Rev. Lett. 95, 117001 (2005).
- (9) A. Kaminski et al., Phys. Rev. Lett. 86, 1070 (2001); P.D. Johnson et al., Phys. Rev. Lett. 87, 177007 (2001); S.V. Borisenko et al., Phys. Rev. Lett. 90, 207001 (2003); A.D. Gromko et al., Phys. Rev. B68, 174520 (2003).
- (10) N. Nücker et al., Phys. Rev. B39, 12379 (1989).
- (11) Y.Y. Wang et al., Phys. Rev. Lett. 77, 1809 (1996).
- (12) R.S. Markiewicz and A. Bansil, to be published, Phys. Rev. B.
- (13) Although not discussed here, we find similar results in LSCO.
- (14) R.S. Markiewicz et al., Phys. Rev. B72, 054519 (2005).
- (15) For Bi2201, we use the parameters of Bi2Sr2CaCu2O8 (Bi2212), but neglect the bilayer splitting. Following Ref. Arun3, , the hopping parameters are () = (360,–100,35,10) meV for Bi2201 and (420,–100,65,7.5) meV for NCCO.
- (16) W.F. Brinkman and S. Engelsberg, Phys. Rev. 169, 417 (1968).
- (17) The specific values of are 0.28 in Bi2212 and 0.55 in NCCO.Arun3
- (18) Specifically, is the renormalization of the coherent part of the dispersion.
- (19) A. Lanzara, personal communication.
- (20) S. Sahrakorpi et al., Phys. Rev. Lett. 95, 157601 (2005).
- (21) A. Kaminski et al., Phys. Rev. Lett. 86, 1070 (2001).
- (22) Y. Kakehashi and P. Fulde, J. Phys. Soc. Japan 74, 2397 (2005).
- (23) E. Manousakis, cond-mat/0608467.
- (24) Q.-H. Wang, F. Tan, and Y. Wan, cond-mat/0610491.
- (25) S. Uchida et al., Phys. Rev. B43, 7942 (1991).
- (26) H. Woo et al., Nature Physics, 2, 600 (2006), in supplementary materials.
- (27) S. Ono, S. Komiya, and Y. Ando, cond-mat/0610361. The stronger doping dependence may be due to the high measurement temperatures.
- (28) The smaller for Bi2201 may be due to neglect of -dispersion, which broadens features in near the VHS.