New features in the phase diagram of TbMnO3
Abstract
The -phase diagram of the multiferroic perovskite TbMnO3 was studied by high-resolution thermal expansion and magnetostriction measurements. Below K, TbMnO3 shows antiferromagnetic order, which changes at K where simultaneously a spontaneous polarization develops. Sufficiently high magnetic fields applied along or induce a polarization flop to . We find that all of these transitions are strongly coupled to the lattice parameters. Thus, our data allow for a precise determination of the phase boundaries and also yield information about their uniaxial pressure dependencies. The strongly hysteretic phase boundary to the ferroelectric phase with is derived in detail. Contrary to previous reports, we find that even in high magnetic fields there are no direct transitions from this phase to the paraelectric phase. We also determine the various phase boundaries in the low-temperature region related to complex reordering transitions of the Tb moments.
pacs:
75.47.Lx,75.80.+q,65.40.De,64.70.Rh1 Introduction
The coupling between magnetic and ferroelectric order parameters in so-called magnetoelectric multiferroic materials is of great current interest [1, 2, 3, 4, 5]. After the rediscovery of this mechanism a few years ago, an intense search has started for materials with strong coupling of the spontaneous polarization and the spontaneous magnetization [6, 7, 8]. This search is enhanced, on the one hand, by the demand for new promising components for device design [9]. On the other hand, the fundamental aspects of the magnetoelectric coupling in many systems are far from being understood. Thus, a detailed determination of the complex and rich phase diagrams observed in multiferroic materials is important. Considering the multiferroic orthorhombic manganites RMnO3 (R = Gd, Tb, Dy), most of the previous investigations concentrated on the ordering phenomena related to the Mn ions, while less is known about the ordering of the rare earth ions in magnetic fields [10, 11, 12]. Recently, we have shown that measurements of thermal expansion and magnetostriction by high-resolution dilatometry are a powerful method to investigate the temperature and magnetic-field phase diagrams of multiferroics, because both the magnetic and the ferroelectric order strongly couple to the lattice parameters [13]. These couplings reflect pronounced uniaxial pressure dependencies of the respective transition fields and temperatures, which can be analyzed by Clausius-Clapeyron and Ehrenfest relations for first- and second-order phase transitions, respectively [14].
Below the Néel temperature K the Mn spins of TbMnO3 develop an incommensurate sinusoidal antiferromagnetic alignment with wave vector [15] (using the Pbnm setting of the orthorhombic unit cell). According to Harris et al. [16], this phase is called the high-temperature incommensurate antiferromagnetic phase (HTI). At K another transition occurs, leading also to an incommensurate, but cycloidal ordering of the Mn moments along . Because the latter transition breaks the inversion symmetry of the crystal, a spontaneous polarization can appear below even in zero field [17, 18]. This phase is called the low-temperature incommensurate AFM phase (LTI). In zero field, an incommensurate AFM ordering of the Tb ions has been proposed [11], which sets in below K. The above-described ordering phenomena of the Mn ions hardly change for magnetic fields T (, , ). However, in higher magnetic fields significant changes in the ferroelectric LTI phase occur: sufficiently high fields () parallel to the or axis induce a polarization flop from to . The critical field strengths depend on their orientation and on temperature. In general, is smaller for ( T) than for ( T) [12]. The polarization flop is accompanied by a change in the modulation wave vector, which becomes commensurate for (LTC phase) [15]. If a magnetic field T is applied parallel to the axis, the sample is forced into a canted antiferromagnetic ordering (cAFM phase) and the ferroelectric order is suppressed completely [12].
In this paper we present a study of the linear thermal expansion coefficient and the linear magnetostriction of TbMnO3. Here, denotes the length of the sample parallel to the different crystallographic directions , , and . The TbMnO3 single crystal was cut from a larger crystal grown by floating-zone melting in an image furnace [12]. The paper is organized as follows: in the next section we present zero field measurements of the linear thermal expansion coefficients. Section 3 deals with the phase transitions which are attributed to the Mn sublattice. We performed measurements along all three lattice directions in longitudinal magnetic fields up to T, i.e., in all cases the field was applied parallel to the measured crystal axis ( with , , and ). The phase diagram derived from our data and the uniaxial pressure dependencies of various phase boundaries are discussed in the fourth section. Section 5 considers the ordering transitions related to the Tb moments and the last section gives a summary.
2 Linear thermal expansion in zero field
The thermal expansion coefficients of TbMnO3 measured in zero magnetic field are shown in figure 1. As may be expected from the orthorhombic structure, the TbMnO3 single crystal shows a strongly anisotropic thermal expansion. Several anomalies are detected. These anomalies can be attributed to the different phase transitions according to previous publications [15]. The sharp anomalies at K signal the Néel transition of the Mn ions. At K TbMnO3 undergoes a second phase transition from the HTI to the LTI phase, accompanied by a pronounced anomaly in for and , whereas the effect in is much smaller. The shape of the anomalies at and is typical for second-order phase transitions. The uniaxial pressure dependencies of are described by the Ehrenfest relation
| (1) |
Here, is the molar volume, () denotes a jump in the thermal expansion coefficient (specific heat) and is the measurement direction of and the direction of uniaxial pressure . Because any ordering transition causes a decrease of the entropy, the specific heat anomaly is always positive () and the sign of is given by the sign of . Thus, shifts to higher temperature for uniaxial pressure along the or axis and decreases for . The changes of for and have the same signs as those of , i.e., decreases for and increases for . Pressure parallel to the axis has only a minor effect on , since practically no change is observed at .
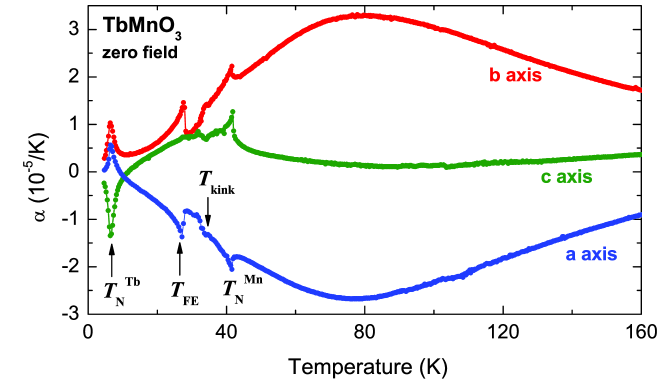
The ordering of the Tb sublattice at K also causes pronounced anomalies for all three crystallographic directions. From the signs of the thermal expansion anomalies we conclude that the Tb ordering is stabilized for uniaxial pressure along or , while it is suppressed for .
Apart from the anomalies related to the different transition temperatures there are additional anomalous features visible for all three directions. Firstly, kink-like anomalies appear at K. We suspect that these kinks may be related to the slope change in the temperature dependence of reported by Kajimoto et al., although the latter has been observed at a somewhat larger temperature K [11]. Secondly, () shows a pronounced broad minimum (maximum) centered around K and a weaker minimum is also present in . Such broad extrema are typical indications for Schottky contributions arising from a thermal population of low-lying excited states. The fact that this thermal population contributes to the thermal expansion coefficients reflects strong uniaxial pressure dependencies of the relevant energy splitting(s) between the ground state and the excited state(s). Again, the signs of the uniaxial pressure dependencies are given by the signs of the anomalous [19, 20, 21]. In TbMnO3 these Schottky contributions most probably arise from the multiplet of the Tb3+ ions. The Hund’s rule ground state of the free Tb3+ ion has a total orbital momentum and is 13-fold degenerate. In a crystal field of orthorhombic symmetry this degeneracy is completely lifted and it is obvious that the energy splittings between the 13 singlet states may strongly change with pressure, since the crystal field will depend on pressure. A more quantitative analysis of the Schottky contributions to is not possible at the present stage, since it would require a detailed knowledge of the different singlet states and of their energy splitting.
3 Transitions related to the Mn ordering
We will divide the discussion of our data in two parts. In this section we will concentrate on the phase transitions related to the Mn sublattice. The ordering of the Tb ions is discussed in section 5. This division does not mean that the Mn and the Tb sublattice of TbMnO3 act independently from each other, but it is reasonable to assume that the coupling between the two sublattices is not too strong.
3.1 Measurements in magnetic fields
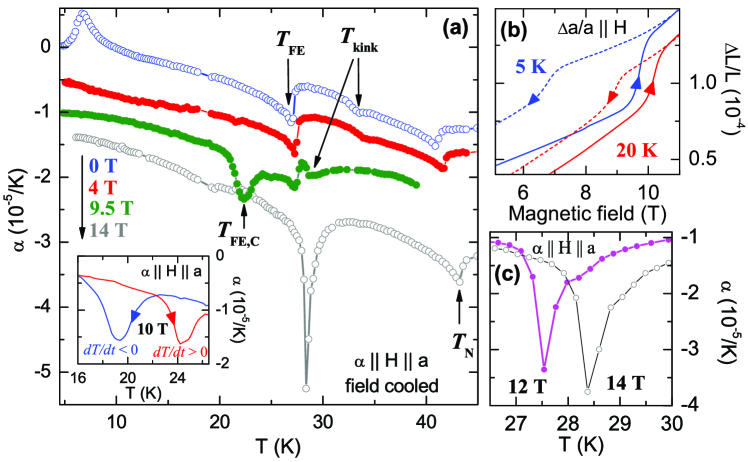
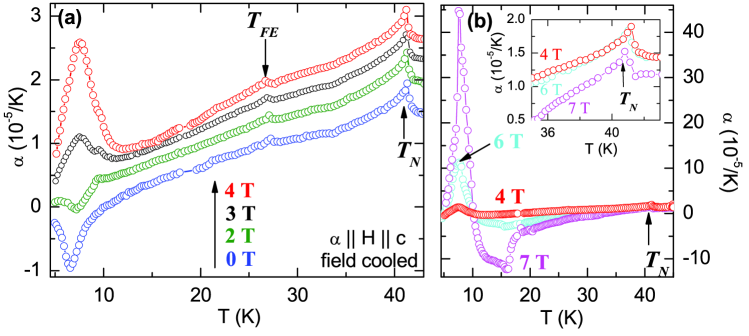
Measurements of in a longitudinal magnetic field up to 14 T are shown in figure 2 (a). Above about 10 K the curves in 4 T and in zero field are quite similar. For higher magnetic fields T an additional anomaly appears at which signals the phase transition from the LTI () to the LTC phase with . This first-order transition shows a broad hysteresis. The hysteretic behavior is presented in the inset of figure 2 (a) by measurements of in 10 T with increasing () and decreasing () temperature. The LTI-to-LTC transition can also be detected by measurements of the magnetostriction, i.e. the magnetic-field induced length change at a constant temperature. In figure 2 (b) magnetostriction measurements at K and 20 K are presented. In both curves a jump-like expansion of is observed as the phase boundary between the LTI and LTC phase is crossed as a function of increasing . For decreasing , the anomalous expansion is reversed and a jump-like contraction signals the LTC-to-LTI transition. As in , this first-order transition shows a hysteresis, which is strongly enhanced at lower temperature.
As is also seen in figure 2 (a), in T shows a pronounced anomaly at K. At first glance, the peak-like shape and a small hysteresis (not shown) indicate that there is one first-order phase transition at this temperature. However, a closer inspection of the high-field anomalies for T and 14 T reveals that both anomalies are asymmetric with additional shoulders on their high-temperature sides; see figure 2 (c). This observation indicates that in high magnetic fields two separate transitions have to be distinguished. A natural interpretation is that with increasing temperature a first-order transition from the LTC to the LTI phase takes place and this transition is followed by a second-order transition from the LTI to the HTI phase at a slightly higher temperature ( K). In this respect, there is no qualitative difference between the sequence of transitions in intermediate ( T) and in higher fields ( T). This conclusion is in contrast to previous publications [15, 10] which proposed direct transitions from the HTI to the LTC phase in TbMnO3 for T.
The Néel temperature shows only a weak increase of about 2 K in the field range up to 14 T, i.e., the HTI phase is slightly stabilized with increasing . The field dependence of is closely linked to the critical field T. For , K is nearly field independent and jumps to K at .111The kink-like anomaly is only present in measurements of (, , ) with increasing temperature. If is measured with decreasing temperature, no kink appears.
3.2 Measurements in magnetic fields
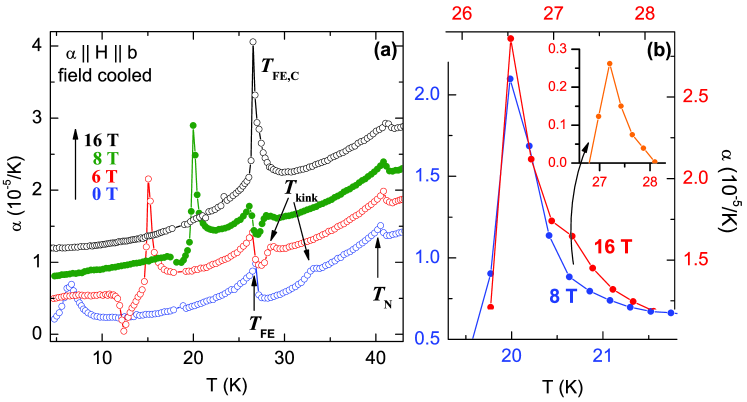
The thermal expansion coefficient is presented in figure 3 (a) for some representative magnetic fields . Similar to the measurements in , the Néel temperature weakly increases with field and the anomaly at shows a jump-like decrease at the critical field T. In a magnetic field of 16 T, a pronounced anomaly at K signals the first-order LTI-to-LTC transition. Again this anomaly has an additional shoulder on the high-temperature side, which arises from the second-order LTI-to-HTI transition at K. For T these two transitions are well separated from each other, K and K, and their different order is reflected in different shapes of the respective anomalies. In figure 3 (b) we compare the anomalies of at for T and T by shifting the 8 T curve on top of the 16 T curve. No further scaling is applied. The additional shoulder of the 16 T curve is clearly seen and a subtraction of the shifted 8 T curve even allows for a quantitative estimate of its magnitude. As shown in the inset of figure 3 (b), the additional shoulder in 16 T is of comparable magnitude as the anomalies due to the HTI-to-LTI transitions at observed in lower fields. Thus, our data for allow for the same conclusion as drawn above from our data for . For both field directions we do not observe direct HTI-to-LTC transitions.
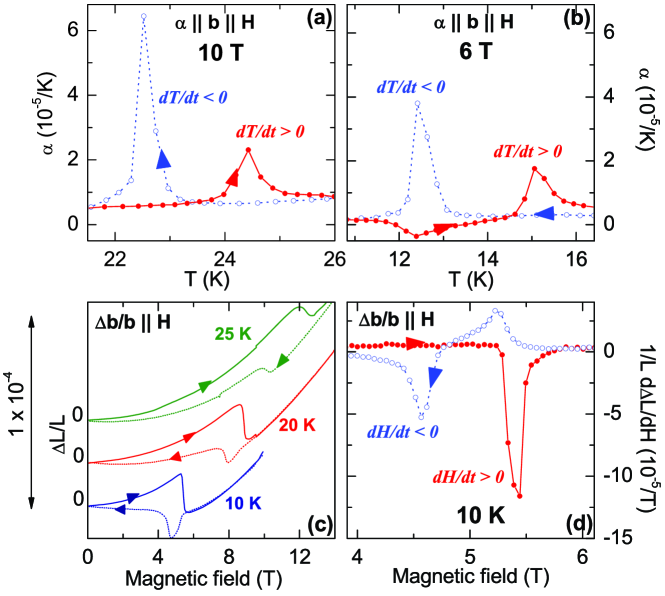
Figure 4 (a) displays the anomalies of at measured with increasing and decreasing temperature in T. The shape of the anomalies is typical for a first-order transition and there is a clear hysteresis. The different peak heights are not too surprising because this simply means that not only the value of but also the width of the transition depends on the sign of the temperature drift. A much more surprising feature is found for lower fields, as is shown for T in panel (b). Here, we observe a double-peak structure when the phase boundary from the LTC to the LTI phase is crossed with increasing temperature. However, for the opposite direction, i.e. , a single peak signals the LTI-to-LTC transition. The same anomalous behavior is observed in our magnetostriction measurements. As shown in figure 4 (c), a jump-like contraction of the axis at T signals the LTI-to-LTC transition as a function of increasing at K. This is typical for a first-order transition and the corresponding field derivative of shows a peak of negative sign; see figure 4 (d). On decreasing the field again, we do not, however, observe the expected jump-like expansion at the LTC-to-LTI transition. Instead there is even a further decrease of in a restricted field range, which causes a double-peak in the corresponding field derivative. These highly anomalous double-peak structures only appear at the LTC-to-LTI transitions at temperatures below about 20 K and for . In other compounds, double peaks of have been observed on heating through glass-like transitions and it has been found that these peaks depend on the rate of the previous cooling process [23, 24]. In order to test whether such memory effects also exist in TbMnO3, we varied the rate of the increasing field between 20 mT/min and 2 T/min, but we did not observe any influence in the subsequent measurements with decreasing field. At present, the origin of the anomalous double-peak structures remains unclear.
3.3 Measurements in magnetic fields
According to Ref. [15], no additional anomalies arising from the Mn sublattice are expected in magnetic fields along the axis up to T. Larger fields induce a canted AFM ordering of the Mn spins and the ferroelectric polarization is suppressed. Figure 5 (a) shows the thermal expansion coefficient in fields up to 4 T and, indeed, these curves do hardly change above about 12 K. The drastic changes in the lower temperature region arise from the Tb sublattice and will be discussed in section 5. Figure 5 (b) presents the measurements in the field range from 4 T and 7 T. In 6 T, already shows a broad minimum around 15 K, which changes into a well-pronounced anomaly at K in the T curve. We attribute this anomaly to the transition from the LTI to the cAFM phase. Unfortunately, the investigation of this phase boundary by high-resolution dilatometry was not possible at higher fields for because of strong torque effects. Usually, the sample is clamped in the dilatometer by only a very small pressure, which was, however, not sufficient to prevent a rotation of the sample when the phase boundary of the cAFM phase was crossed. Thus, a fitting was constructed to safely fix the sample orientation, but the torque effects were sufficiently strong to crack the sample in this setup.
4 -phase diagram and pressure dependencies
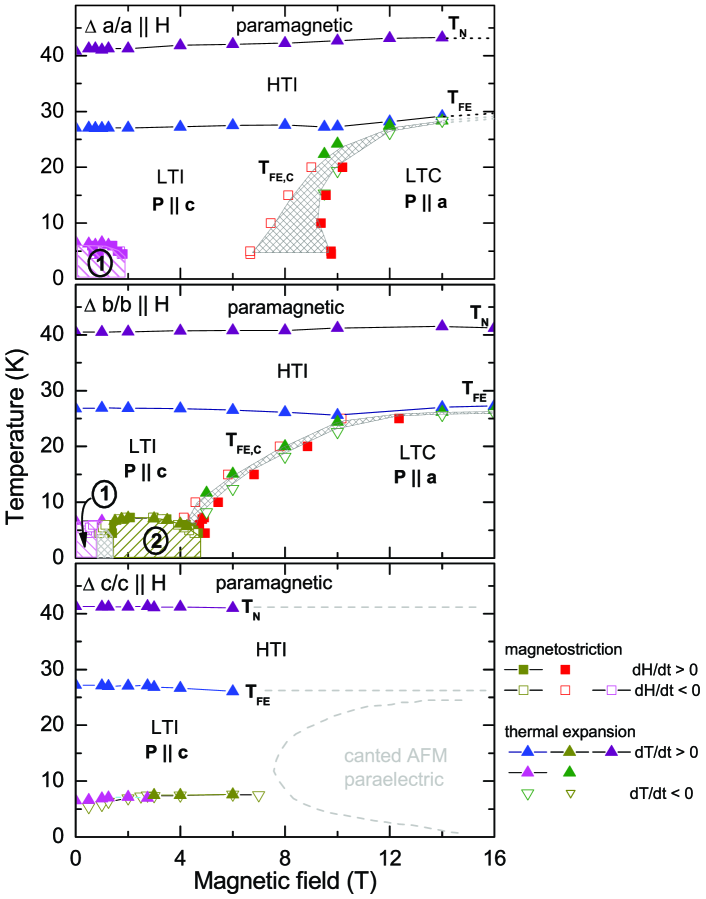
From our thermal expansion and magnetostriction measurements we obtain the phase diagram shown in figure 6. The phase boundary between the LTI and the LTC phase, measured as a function of increasing and decreasing field and temperature, has been determined for the first time. We find a very strong hysteretic behavior, especially at low temperatures. Concerning the phase boundaries between the paramagnetic and the HTI phases our data well agree to previous investigations [10, 15, 12] for all three field directions. In the field range below about 10 Tesla, this is also the case for the boundaries between the HTI and LTI phases. In contrast to the earlier publications, however, our data clearly show that there are no direct transitions from the HTI to the LTC phase in higher fields, neither for nor for . Instead of a direct transition from the HTI to the LTC phase as a function of decreasing temperature, the system seems to pass always through the LTI phase, before the LTC phase is entered. This observation is of importance for microscopic models describing the symmetry changes at the various phase transitions.
Besides the bare position of the different phase boundaries, the thermal expansion data also yield information about their uniaxial pressure dependencies (see eq. (1)). As discussed in detail in Ref. [14], the opposite signs of the anomalies of and at both, and , mean that both transitions depend on the degree of distortion of the GdFeO3-type structure, which can be parameterized by the magnitude of the orthorhombic splitting . The main idea is that the ferromagnetic nearest-neighbor exchange in the planes is weakened with increasing , as it is the case in the MnO3 series for a decreasing ionic radius from . In addition, the anisotropy of the antiferromagnetic next-nearest-neighbor coupling increases, since increases along and decreases along . As a consequence, the zero field magnetic ground state changes from an A-type AFM for to an E-type AFM for the HoMnO3 in perovskite structure.222MnO3 with rare earth ions smaller than Dy usually crystallize in a hexagonal structure[25, 26] Depending on temperature, magnetic field and the radius of , the competition of and can also cause incommensurate AFM structures for [27, 28]. Since uniaxial pressure along () will increase (decrease) , the corresponding uniaxial pressure dependencies of of TbMnO3 can be straightforwardly traced back to a decreasing (increasing) due to the changes of the orthorhombic splitting. This result is identical to our conclusions concerning the uniaxial pressure dependencies of of GdMnO3 for and . For uniaxial pressure , we find an increase of in both compounds. As discussed in Ref. [14], the GdFeO3-type distortion is characterized not only by the magnitude of , but also by a decreasing lattice parameter . Thus, one might expect a negative arising from a partial increase of the GdFeO3-type distortion lowering . However, does not only depend on the couplings and acting within the planes. A three-dimensional ordering requires a finite coupling along the direction, and the positive suggests an increase of under pressure along .
Concerning the HTI-to-LTI phase boundary and its pressure dependencies, the phenomenology of TbMnO3 is not directly comparable to our previous results on GdMnO3 [13, 14]. In TbMnO3, the transition to the LTI phase is accompanied by a finite polarization already in zero magnetic field, whereas in GdMnO3 a finite field is necessary to induce ferroelectricity. In addition, the ferroelectric phase of GdMnO3 is not entered directly from the the paraelectric high-temperature incommensurate phase (termed ICAFM in Refs. [13, 14]) but from a canted AFM phase.333Note that the magnetic structures of GdMnO3 have not yet been determined unambiguously. The proposed phases are based on the observed weak ferromagnetism [10, 29] and on X-ray diffraction studies [28]. Magnetic neutron diffraction is still missing. Concerning the uniaxial pressure dependencies for and , we observed a clear anti-correlation in GdMnO3 between and (the latter signals the HTI-to-cAFM boundary) on the one hand side and on the other. This anti-correlation suggests a competition between colinear spin structures, either incommensurate or A-type AFM, and non-colinear spin structures, which allow for additional ferroelectricity [17, 18]. In contrast to GdMnO3, the uniaxial pressure dependencies of and of TbMnO3 have the same signs. An increase of the orthorhombic splitting by pressure would decrease both, and . This is in agreement with the observed lower values of both, and of DyMnO3 where the orthorhombic splitting is larger than in TbMnO3 [27, 28]. Our finding suggests that the orthorhombic splitting of TbMnO3 is already larger than the optimum value of needed to establish a ferroelectric ordering with a maximum value of . Summarizing the above discussion, we conclude that the competition between a multiferroic and an A-type AFM ground state dominates in GdMnO3, while in TbMnO3 the dominant competition is between the multiferroic and an E-type AFM ground state.
Apart from the phase boundaries related to the Mn subsystem, figure 6 also contains various phase boundaries in the low-temperature range arising from transitions of the Tb ions. The corresponding measurements, which have been used to trace these phase boundaries will be discussed in the following section. We find evidence that only one ordered phase of the Tb moments exists for , while for it is possible to distinguish at least two different phases. For the situation is more complex because a clear separation of different phases is not possible from our data.
5 Transitions related to the Tb ions
Even though the Tb ions have a strong magnetic moment which may interact with the Mn moments, no systematic investigation on the field dependence of the low-temperature phase transition has been published so far. According to Refs. [11, 12] an incommensurate AFM ordering of the Tb moments occurs in zero field below K. In Ref. [10] Kimura et al. present several phase boundaries in the relevant temperature region for only and without a further classification. Therefore, we have studied this low-temperature region in more detail for all three field directions.
5.1 Measurements in magnetic fields
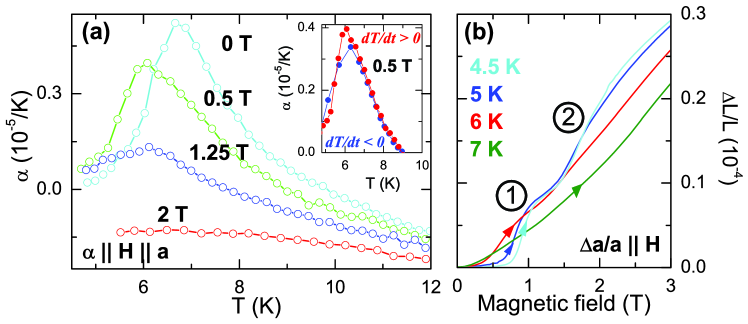
As shown in figure 7 (a), a positive anomaly of at K signals the Tb ordering in zero field. This anomaly shifts to lower temperature as small magnetic fields are applied and it is completely suppressed for T. The suppression of the antiferromagnetic order is in agreement with the ferromagnetic alignment of the Tb moments for T reported in Ref. [12]. Our data suggest that the Tb ordering is of second order since no hysteretic behavior occurs at the phase boundary (see the inset of figure7 (a)). This phase transition can also be detected by magnetostriction measurements. The curves in figure 7 (b) were obtained with increasing at constant . Considering at 4.5 K, a first step-like expansion occurs at T and a second one at T. The second one can be attributed to the ferromagnetic alignment of the Tb moments [12], but the origin of the first anomaly remains unclear thus far. Again, both anomalies show no hysteretic behavior as a function of field (not shown). With increasing temperature these anomalies broaden and vanish for K.
5.2 Measurements in magnetic fields
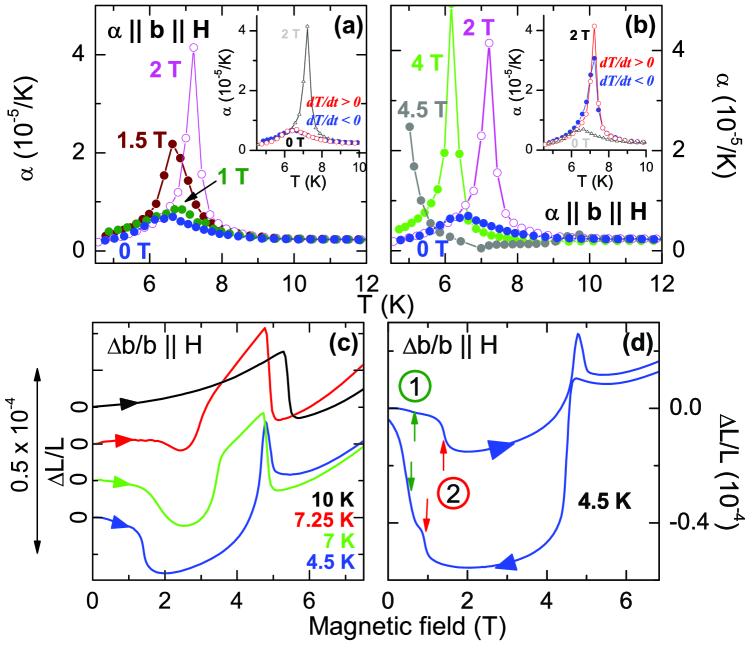
For magnetic fields up to T, shows similar anomalies at as those observed in ; see figures 8 (a) and 7 (a). In contrast to , however, the antiferromagnetic Tb ordering is not suppressed as is increased. Instead, another ordered phase is induced for T. The anomalies in higher fields are sharper and significantly larger than those in T. For fields up to 2 T this second Tb ordering is stabilized, but with further increasing field the transition temperature decreases again and at 4.5 T the transition already occurs below the lower limit of the investigated temperature region, see figure 8 (b). The insets of panel (a) and (b) of figure 8 compare measurements of obtained with increasing and decreasing . For both types of transitions no hysteresis is observed. In Ref. [12] it has been reported that the wave vector of the antiferroamgnetic Tb oredering changes from an incommensurate value below 1 T to a commensurate one for higher fields . Thus we attribute the broad low-field anomalies in to transitions to the incommensurate phase, while the sharper anomalies above 1 T signal transitions to the commensurate phase.
Panel (c) of figure 8 presents the relative length change as a function of increasing . These curves confirm that two different phase transitions have to be distinguished in at . As a function of increasing , shows a pronounced step-like contraction at 1.4 T, in agreement with the observed transition from an incommensurate to a commensurate wave vector of the Tb ordering [12]. At a somewhat larger field we find an anomalous expansion of the axis suggesting that the commensurate phase is left again. With further increasing field another step-like contraction takes place, which is due to the LTI-to-LTC transition of the Mn moments discussed in section 3.2. The latter is present up to about 25 K (see figure 4), while the transitions at lower fields can be observed only at temperatures up to K. Thus, the transition temperature of the commensurate Tb phase is slightly higher than in zero field.
Figure 8 (d) shows an expanded view on at 4.5 K as a function of increasing and decreasing field. As in , there is an additional anomaly (of unknown origin) marked by ➀, before the incommensurate-to-commensurate transition occurs at the anomaly marked by ➁. The position of the first anomaly is not hysteretic with respect to the direction of the field sweep, whereas the position of the second one as well as the anomalies around 5 Tesla show some hysteresis. Our phase boundaries qualitatively agree with the phase diagram presented by Kimura et al. for in Ref. [10].
5.3 Measurements in magnetic fields
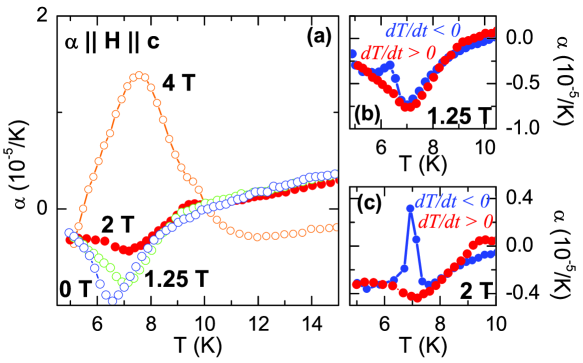
For a magnetic field , we find a complex field dependence of the anomalies of , which signal the various rearrangements of the Tb moments below . In zero field, an anomaly of negative sign indicates the ordering of the Tb sublattice. This anomaly broadens as higher fields are applied and can be observed up to T; see figure 9 (a). For higher fields, a broad anomaly of positive sign shows up. This anomaly continuously increases in magnitude for further increasing and has been detected up to T; see also figure 5 (b). Presumably, the two anomalies of opposite signs belong to two types of different Tb phases similar to those observed for . The need to distinguish two anomalies also for becomes more obvious in panel (b) and (c) of figure 9. There, we present the anomalies of recorded with increasing and decreasing temperature in T and T. For both field strengths, shows only one broad anomaly of negative sign as a function of increasing . For decreasing , however, this anomaly is overlapped by a second one of opposite sign. This complex hysteretic behavior prevents an exact determination of clearly-defined phase boundaries. Nevertheless, our data suggest that the Tb ordering is not suppressed up to 7 T.
6 Summary
We have determined the magnetic-field temperature phase diagram of TbMnO3 by high-resolution thermal expansion and magnetostriction measurements. The measurements have been performed in longitudinal magnetic fields applied along all three crystallographic axes. The fact that we find rather pronounced anomalies at the various phase transitions proves that all these transitions strongly couple to lattice degrees of freedom and allows for a detailed investigation of the phase boundaries. Our data reveal various new features in the phase diagram of TbMnO3: Firstly, the phase boundary between the LTI and the LTC phase for has been determined for the first time. This first-order phase transition shows a broad hysteresis, which is strongly enhanced at lower temperatures. Secondly, we find clear evidence that even in high magnetic fields no direct HTI-to-LTC transitions take place, contrary to previous reports [15, 10]. This is also the case for high fields . Our data suggest that for both field directions the Mn subsystem always transform from the HTI first to the LTI phase before the LTC phase is finally established at low temperature. Thirdly, we observe a strongly anomalous behavior at the LTC-to-LTI transition for . Similar to glass transitions, double-peak structures show up in and when the LTC phase is left as a function of temperature and magnetic field, respectively. Nevertheless, we could not observe any dependence of these double-peak structures on the sweep rate of the temperature or magnetic-field changes during the prior LTI-to-LTC transitions, which would be a typical indication for a glass-like transition.
Besides the positions of the various phase boundaries, our data also yield information about their uniaxial pressure dependencies. The uniaxial pressure dependencies of the Néel temperature of TbMnO3 have the same signs as those of GdMnO3. This confirms our previous conclusions [14], that the increase (decrease) of for uniaxial pressure applied along the () axes arises from a decrease (increase) of the orthorhombic splitting , which causes an increase (decrease) of . In order to explain the uniaxial pressure dependence for pressure along the axis, the finite has to be taken into account. The analysis of the pressure dependencies of suggests that the optimum value of needed to establish a ferroelectric order with a maximum is located between of GdMnO3 and of TbMnO3.
Concerning the ordering of the Tb moments, our data confirm the suppression of the incommensurate ordering below K for magnetic fields T applied along the axis. For , we also observe that a clear change in the ordering of the Tb moments is induced for T, in agreement with the incommensurate-to-commensurate transition found by neutron scattering [12]. Clear anomalies, due to the ordering of the Tb sublattice are also present for and our data indicate a rearrangement of the Tb moments around 3 T. The ordering is not suppressed in fields up to 7 T, but a clear attribution to different phases is prevented by the very complex, hysteretic field and temperature dependencies.
Acknowledgements
We acknowledge fruitful discussions with J. Baier, K. Berggold, J. Hemberger, and D. Khomskii. This work was supported by the Deutsche Forschungsgemeinschaft via Sonderforschungsbereich 608.
References
References
- [1] Eerenstein W, Mathur N D, Scott J F 2006 Nature 442 759-765
- [2] Tokura Y 2006 Science 312 1481
- [3] Khomskii D I 2006 J. Magn. Magn. Mater.306 1-8
- [4] Heyer O, Hollmann N, Klassen I, Jodlauk S, Bohaty L, Becker P, Mydosh J A, Lorenz T, Khomskii D 2006 J. Phys.: Condens. Matter 18 L471-L475
- [5] Senff D, Link P, Hradil K, Hiess A, Regnault L P, Sidis Y, Aliouane N, Argyriou D N, Braden M 2006 Preprint cond-mat/0610620
- [6] Spaldin N A, Fiebig M 2005 Science 309 5733
- [7] Fiebig M 2005 J. Appl. Phys.38 123-152
- [8] Hill N A, Filippetti A 2002 J. Magn. Magn. Mater.242 976
- [9] Hur N, Park S, Sharma P A, Ahn J S, Guha S, Cheong S W 2004 Nature 429 392-395
- [10] Kimura T, Goto T, Shintani H, Arima T, Tokura Y 2003 Nature 426 55-58
- [11] Kajimoto R, Yoshizawa H, Shintani H, Kimura T, Tokura Y 2004 Phys. Rev.B 70 012401
- [12] Aliouane N, Argyriou D N, Strempfer J, Zegkinoglou I, Landsgesell S, Zimmermann M v 2006 Phys. Rev.B 73 020102
- [13] Baier J, Meier D, Berggold K, Hemberger J, Balbashov A, Mydosh J A, Lorenz T 2006 Phys. Rev.B 73 100402
- [14] Baier J, Meier D, Berggold K, Hemberger J, Balbashov A, Mydosh J A, Lorenz T 2006 Preprint cond-mat/0605515 J. Magn. Magn. Mater.(in press)
- [15] Kimura T, Lawes G, Goto T, Tokura Y, Ramirez A P 2005 Phys. Rev.B 71 224425
- [16] Harris A B, Lawes G 2005 Preprint cond-mat/0508617
- [17] Mostovoy M 2006 Phys. Rev. Lett.96 067601
- [18] Katsura H, Nagaosa N, Balatsky A V. 2005 Phys. Rev. Lett.95 057205
- [19] Zobel C, Kriener M, Bruns D, Baier J, Grüninger M, Lorenz T 2002 Phys. Rev.B 66, 020402(R)
- [20] Johannsen N, Oosawa A, Tanaka H, Vasiliev A, Lorenz T 2006 Physica B 378-380 1043
- [21] Lorenz T, Stark S, Heyer O, Hollmann N, Vasiliev A, Oosawa A, Tanaka H 2006 Preprint cond-mat/0609348 J. Magn. Magn. Mater.(in press)
- [22] Hemberger J, Schrettle F, Pimenov A, Lunkenheimer P, Ivanov V Yu, Mukhin A A, Balbashov A M, Loidl A 2006 Preprint cond-mat/0603258
- [23] Müller J, Lang M, Steglich F, Schlueter J A, Kini A M, Sasaki T 2002 Phys. Rev.B 65 144521
- [24] Gugenberger F, Heid R, Meingast C, Adelmann P, Braun M, Wühl H, Haluska M, Kuzmany H 1992 Phys. Rev. Lett.69 3774-3777
- [25] Zhou J S, Goodenough J B 2006 Phys. Rev. Lett.96 247202
- [26] Lottermoser Th, Fiebig M, Fröhlich D, Leute St, Kohn K 2001 J. Magn. Magn. Mater.226-230 1131-1133
- [27] Goto T, Kimura T, Lawes G, Ramirez A P, Tokura Y 2004 Phys. Rev. Lett.92 257201
- [28] Arima T, Goto T, Yamasaki Y, Miyasaka S, Ishii K, Tsubota M, Inami T, Murakami Y, Tokura Y 2005 Phys. Rev.B 72 100102(R)
- [29] Hemberger J, Lobina S, Krug von Nidda H A, Tristan N, Ivanov V Yu, Mukhin A A, Balbashov A M, Loidl A 2004 Phys. Rev.B 70 024414