Finite temperature phase diagram of a polarized Fermi gas in an optical lattice
Abstract
We present phase diagrams for a polarized Fermi gas in an optical lattice as a function of temperature, polarization, and lattice filling factor. We consider the Fulde-Ferrel-Larkin-Ovchinnikov (FFLO), Sarma or breached pair (BP), and BCS phases, and the normal state and phase separation. We show that the FFLO phase appears in a considerable portion of the phase diagram. The diagrams have two critical points of different nature. We show how various phases leave clear signatures to momentum distributions of the atoms which can be observed after time of flight expansion.
pacs:
03.75.Ss, 03.75.Hh,74.25.DwRecent advances in the experiments of ultracold Fermi gases have shown great potential for elucidating long-standing problems in many different fields of physics related to strongly correlated Fermions. For instance, in recent experiments Zwierlein et al. (2006a); Partridge et al. (2006a); Zwierlein et al. (2006b); Shin et al. (2006); Partridge et al. (2006b) spin-density imbalanced, or polarized, Fermi gases were considered. Such systems make it possible to study pairing with mismatched Fermi surfaces, potentially leading to non-standard phases such as that appearing in FFLO-states Fulde and Ferrell (1964); Larkin and Ovchinnikov (1964) or BP-states Sarma (1963) (Sarma-states). These possibilities have been considered extensively in condensed-matter, nuclear, and high-energy physics Casalbuoni and Nardulli (2004). The experiments in trapped gases have shown clear evidence of the separation of the gas into a BCS core region and a normal state shell around it, i.e. phase separation. Although an FFLO-type state has been predicted to appear in these systems as well Mizushima et al. (2005); Machida et al. (2006), it is likely to be difficult to observe since it appears in the edges of the trap except for large polarizations.
Recent experiments Stöferle et al. (2006); Chin et al. (2006) on Fermi gases confined in optical lattices have already demonstrated the potential of these systems for a multitude of studies of new phases, dimensionality effects, and dynamics. In this letter, we calculate the phase diagram for an attractively interacting Fermi gas in an optical lattice at zero and finite temperatures. In particular, we consider the possibility of the single mode FFLO-phase, where the order parameter is space-dependent, and of the BCS-BP phase, where compared to the standard BCS phase the excess polarization is carried by additional Bogoliubov excitations. We investigate their competition with the phase separation (PS) of the gas into normal and BCS superfluid regions. Our results reveal that a typical phase diagram as a function of polarization and temperature is as shown in Fig. 1: phase separation is expected for small polarizations and temperatures, whereas at zero temperature the FFLO state appears after some critical polarization. At a finite temperature, the FFLO-phase competes with the BCS-BP phase. As the temperature increases the BCS-BP phase becomes energetically favorable, and as the temperature is increased even further the BCS-BP phase gives way to a normal polarized Fermi gas.
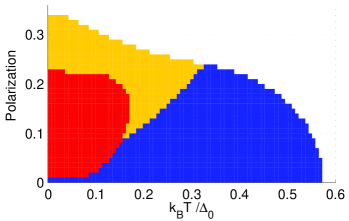
Furthermore, the phase diagrams reveal a Lifshitz point which is surrounded by the normal, FFLO, and BCS-BP phases. The transitions around this point are of second order, but the FFLO phase breaks the translational symmetry which is present in BCS-BP and normal phases. Interestingly, there is also a point surrounded by the PS domain and the FFLO and BCS-BP phases. Comparing this point to the tricritical point discussed in Refs. Gubbels et al. (2006); Parish et al. (2007), the difference is that the part of the phase diagram around the tricritical point which was occupied by the normal state in Refs. Gubbels et al. (2006); Parish et al. (2007), is now occupied by the symmetry breaking FFLO phase. If extending to stronger interactions, the order of the transitions in question should be considered more carefully.
In atomic gases, the mismatch of the Fermi surfaces is realized by a fixed atom number difference between the two components, i.e. fixed polarization. This is in contrast to many other physical systems (such as superconductors or quark matter) where it is caused by different chemical potentials, due to e.g. an external magnetic field. In such systems it is known that, at zero temperature, the BCS state is realized for small chemical potential differences, and after a critical difference, some exotic pairing state such as FFLO or BP state may appear, although the stability of these states is under a debate Bedaque et al. (2003); Gubankova et al. (2005); Sheehy and Radzihovsky (2006b). If the polarization, rather than the chemical potential difference, is fixed, the BCS state cannot be the solution at zero temperature. Consequently, it is important to consider the phase separated state as an alternative to the FFLO and BP states. In fact, it turns out that at zero temperature the phase separation into an unpolarized BCS region and a polarized normal region gives a lower energy than the BP phase Bedaque et al. (2003).
The phase diagrams including the possibility of FFLO-phase and phase separation have been calculated for atomic Fermi gases in free space Sheehy and Radzihovsky (2006b); He et al. (2006b). Also there, like in our results, the phase separation appears for low polarizations and the FFLO phase for higher ones. However, a striking difference is that our calculations in optical lattices give a considerable parameter window for the existence of the FFLO phase, whereas in free space the parameter window is extremely narrow. Recently, density polarized gases in optical lattices were considered in Ref. Iskin and C. A. R. Sá de Melo (2006) but that work concentrates on the insulating phases and does not resolve the competition between FFLO, BCS-BP, and phase separation, moreover the discussion there is limited to zero temperature. Finite temperature phase diagrams for trapped imbalanced gases have been considered in Machida et al. (2006); Martikainen (2006); Gubbels et al. (2006); Chien et al. (2007). These works do not consider the FFLO state, except Machida et al. (2006). There a FFLO-type phase appears via the Bogoliubov-de Gennes ansatz, not via a plane wave ansatz customary in translationally invariant or periodic systems, therefore the spatial behaviour of the order parameter is different: for small and intermediate polarizations the oscillations of the order parameter appear only in the edges of the trap.
We consider two distinguishable species of fermionic atoms, e.g. atoms in different hyperfine states, labelled by up and down pseudospin index, interacting via an attractive contact interaction and confined in an optical lattice. The system is described by the Hamiltonian , where . Here is the FFLO momentum and it represents the momentum of the Cooper pairs. In the single mode ansatz the spatial dependence of the order parameter is given by . The parameters and are defined as in Jaksch1998a . Our calculations are in the intermediate and weak coupling regime (), where the single band approximation is valid. With the Hamiltonian is the standard BCS-BP Hamiltonian. The quasiparticle energies of the system are , where . We consider fixed numbers of particles and determine the chemical potentials by the number equations and , where is the Fermi function and the coefficients and are defined in the usual way, see for example Koponen et al. (2006). The grand potential of the system is . For any given point in the phase diagrams, we look for the stable phase by minimizing the free energy with respect to and , where and are the filling factors of the different atoms. We define the different phases as follows: the region of the phase diagram where the energy is minimized by is normal phase, the region where and is FFLO. The regions where and are BP, and within the BP region, the line with no polarization, i.e. , is the standard BCS state. All of these phases are obtained as stable solutions from the free energy given above and the BCS state can be reached smoothly from the BP state by reducing the polarization to zero.
We also compare all the above states to a phase separation between the standard BCS state and the polarized normal state. We do this as in Ref. Bedaque et al. (2003): with numbers and in the different components, we let atoms from both components occupy the BCS state and put the rest of the atoms to the normal state. We let the normal state occupy a fraction of the lattice, leaving the fraction for the BCS state. We then add the free energies of a BCS state with a density in both components and a normal gas with densities and in the different components. Thereafter we vary both and to find the energy of the optimal phase separated state and compare it to the optimal free energy given by a single state.
Fig. 2 shows the zero temperature phase diagram as a function of polarization and the average lattice filling , for two different interaction strengths. Starting from zero, the critical polarization for the FFLO-normal boundary increases as function of the average filling. The maximum critical polarization is achieved for a certain filling factor that is the smaller the stronger the interaction strength is, and is different from half filling. Note that although half filling is predicted to give the maximum gap Micnas et al. (1990), in our case the value of the average filling , for high polarizations, is far from the actual half filling. In fact, for large and we would enter a regime outside the scope of our Hamiltonian restricted to the lowest band.111A similar diagram with the normal phase boundary, but not the boundary between PS and FFLO, is given in Iskin and C. A. R. Sá de Melo (2006). The phase separation - FFLO boundary shows interesting behaviour: both critical polarizations (for the PS-FFLO and FFLO-normal) are close to each other for small fillings, then grow when the density increases, however, the PS-FFLO critical polarization starts to decrease earlier and stronger than the FFLO-normal critical polarization. This implies that, for high densities, the polarization window for the FFLO phase can become large compared to the polarization window for the PS domain. For small densities the critical polarization tends to zero and the window for FFLO phase becomes narrow, as expected in the long wavelength limit where the lattice dispersion can be approximated with the free space dispersion.
The stability of the FFLO state in a lattice is due to the flatness and nesting of the majority and minority component Fermi surfaces. In the continuum limit the Fermi surfaces are spheres, and the FFLO ansatz effectively shifts them relative to each other, allowing matching of parts of the Fermi surfaces. For small lattice fillings the well known result gives a good estimate for the we find numerically. For higher fillings the surfaces deform from spherical towards octahedra. By shifting two octahedra relative to each other, four whole faces of the minor component octahedron can be made to match the major component Fermi surface. Such nesting makes the stability of FFLO intuitively understandable. For fillings close to where the Fermi surfaces can be approximated by octahedra, we find that the numerically obtained can be well estimated by the shift needed along the diagonal of the octahedra required to make the surfaces match. For intermediate cases between spherical and octahedron, we made numerical optimization of the match of the corresponding ideal gas Fermi surfaces and found again good agreement with the values of given by the full FFLO calculation. Typical values given for by our FFLO calculations are between and , larger fillings giving larger values of .
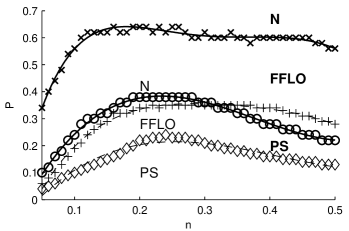
Fig. 1 shows the finite temperature phase diagram. The FFLO state dominates over the phase separation after some finite critical polarization is reached, even at zero temperature. At high enough temperatures the phase separation gives way to the FFLO, BCS-BP, or normal phases. Note that the FFLO regime, both at zero and finite temperature, is reasonably large, not vanishingly small as in many other systems, which makes the observation of this phase in optical lattices more feasible. We have calculated finite temperature phase diagrams for several values of the interaction strength and the average density . In general, larger values of these parameters produce higher critical polarizations and critical temperatures for the FFLO and BP states. The PS-FFLO boundary has a non-trivial dependence on the density, as already indicated by Figure 2. Overall, the qualitative behaviour presented in Figure 1 is not sensitive for the variation of the parameters. For the parameters of Figure 1, and . Including pair fluctuations Nozieres and Schmitt-Rink (1985) would shift the normal state boundary down in temperature at higher temperatures but would not change the qualitative features such as the large FFLO window found in lower temperatures. We have checked that including Hartree corrections does not change this result either. At , the polarizations for which phase separation (PS) and FFLO appear are, for three different interaction strengths , the following: phase separation dominates for (, gap () , (, gap ), (, gap ), and FFLO for , , , respectively, from where the relative size of the FFLO domain versus the total PS+FFLO domain is obtained to be , , , respectively, i.e. it is essentially the same also for smaller interactions (even slightly grows).
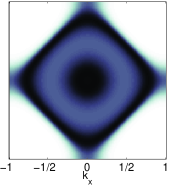
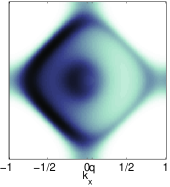
All the phases that we discussed here are directly observable in optical lattices from the momentum distributions that are obtained by imaging after time of flight expansion. Also other methods, such as observing the noise correlations Altman et al. (2004)can be considered. Fig. 3 shows how the FFLO (at nK) and BP (at nK) phases are reflected in the momentum distribution. A normal state would be completely symmetric in the -space, in contrast to the FFLO, and the phase separated state can be assumed to produce a symmetric result as well (with a background trap, the actual form of phase separation is likely to be a BCS state in the middle of the trap and the normal gas on the edges). Furthermore, the phase separated state can be distinguished, for example, by removing the paired atoms from the system using RF-fields (detuning matched to the pairing gap to select the paired atoms only) and then observing the remaining cloud of atoms which is, after the removal, expected to have a non-monotonous density distribution if the initial state was a phase separated state.
The background trapping potential that is present in most optical lattice experiments would further decrease the energy of the phase separated solution because of the higher density in the middle of the trap. The background trap must therefore be sufficiently slowly varying for the FFLO state to remain energetically favourable. An order of magnitude estimate for the maximum trapping frequency can be made by considering the energy difference between the FFLO and phase separation solutions, per particle, which for typical parameters used here is about . We compare this to the potential energy of a harmonic trap at the distance given by the size of the system, i.e. , where is the number of sites in one dimension and is the lattice spacing. This gives the maximum energy that is possible to save by moving a particle from the edge to the middle; we also multiply this by the polarization to correspond to the particles that would likely be affected by the phase separation. Comparing these two energies, for the parameters used here (, , ), we obtain of the order of , which is not unreasonable.
In summary, we presented for the first time a finite temperature phase diagram for optical lattices where various forms of superfluidity and phase separation are compared. Apart from giving the scales for critical polarizations and temperatures, relevant for the experiments, we find a clear qualitative difference to similar works in other systems: the parameter window for the existence of FFLO can be rather large, the phase is certainly not negligible or an edge effect. It turns out that the FFLO phase often appears in the parameter region where the lattice problem cannot be approximated by the long wavelength limit, which explains the pronounced difference with the free space results, where the FFLO phase is expected only in a very narrow parameter region. Another remarkable difference between optical lattices and other systems realizing imbalanced Fermi systems is that the signatures of the different phases should be readily observable. We show that the FFLO and BCS-BP states are clearly reflected in the momentum distribution Koponen et al. (2006) of the gas, which can be directly observed after a time of flight expansion. Our study has been restricted to a single mode FFLO ansatz and it is likely that multi- FFLO superfluids have a lower energy. Therefore, regions of our phase diagrams where FFLO is expected to appear may be larger and also contain several different types of FFLO phases.
Acknowledgements We thank J. Kinnunen and L.M. Jensen for discussions. This work was supported by the National Graduate School in Materials Physics and QUDEDIS and Academy of Finland (project numbers 106299, 115020, 213362, 207083) and conducted as part of a EURYI scheme award. See www.esf.org/euryi.
References
- Zwierlein et al. (2006a) M. W. Zwierlein et al., Science 311, 492 (2006a).
- Partridge et al. (2006a) G. B. Partridge et al., Science 311, 506 (2006a).
- Zwierlein et al. (2006b) M. W. Zwierlein et al., Nature 442, 54 (2006b).
- Shin et al. (2006) Y. Shin et al., Phys. Rev. Lett. 97, 030401 (2006).
- Partridge et al. (2006b) G. B. Partridge et al., Phys. Rev. Lett. 97, 190407 (2006b).
- Fulde and Ferrell (1964) P. Fulde and R. A. Ferrell, Phys. Rev. 135, A550 (1964).
- Larkin and Ovchinnikov (1964) A. I. Larkin and Y. N. Ovchinnikov, Zh. Eksp. Teor. Fiz. 47, 1136 (1964).
- Sarma (1963) G. Sarma, J. Phys. Chem. Solids 24, 1029 (1963). W. V. Liu and F. Wilczek, Phys. Rev. Lett. 90, 047002 (2003).
- Casalbuoni and Nardulli (2004) R. Casalbuoni and G. Nardulli, Rev. Mod. Phys. 76, 263 (2004).
- Mizushima et al. (2005) T. Mizushima, K. Machida, and M. Ichioka, Phys. Rev. Lett. 94, 060404 (2005). P. Castorina et al., Phys. Rev. A 72, 025601 (2005). J. Kinnunen, L. M. Jensen, and P. Törmä, Phys. Rev. Lett. 96, 110403 (2006). L. M. Jensen, J. Kinnunen, and P. Törmä (2006), eprint cond-mat/0604424.
- Machida et al. (2006) K. Machida, T. Mizushima, and M. Ichioka, Phys. Rev. Lett. 97, 120407 (2006).
- Stöferle et al. (2006) T. Stöferle et al., Phys. Rev. Lett. 96, 030401 (2006).
- Chin et al. (2006) J. K. Chin et al., Nature 443, 961 (2006).
- Gubbels et al. (2006) K. B. Gubbels, M. W. J. Romans, and H. T. C. Stoof, Phys. Rev. Lett. 97, 210402 (2006).
- Parish et al. (2007) M. M. Parish et al., Nature Physics 3, 124 (2007).
- Bedaque et al. (2003) P. F. Bedaque, H. Caldas, and G. Rupak, Phys. Rev. Lett. 91, 247002 (2003).
- Gubankova et al. (2005) E. Gubankova, E. Mishchenko, and F. Wilczek, Phys. Rev. Lett. 94, 110402 (2005). L. He, M. Jin, and P. Zhuang, Phys. Rev. B 73, 214527 (2006a).
- Sheehy and Radzihovsky (2006b) D. E. Sheehy and L. Radzihovsky, Phys. Rev. Lett. 96, 060401 (2006b). D. E. Sheehy and L. Radzihovsky, Annals of Physics 322, 1790 (2006).
- He et al. (2006b) L. He, M. Jin, and P. Zhuang, Phys. Rev. B 74, 024516 (2006b).
- Iskin and C. A. R. Sá de Melo (2006) M. Iskin and C. A. R. Sá de Melo (2006), eprint cond-mat/0612496.
- Martikainen (2006) J.-P. Martikainen, Phys. Rev. A 74, 013602 (2006).
- Chien et al. (2007) C.-C. Chien et al., Phys. Rev. Lett. 98, 110404 (2007).
- (23) D. Jaksch et al., Phys. Rev. Lett. 81, 3108 (1998).
- Koponen et al. (2006) T. Koponen et al., New J. Phys. 8, 179 (2006).
- Micnas et al. (1990) R. Micnas, J. Ranninger, and S. Robaszkiewicz, Rev. Mod. Phys. 62, 113 (1990).
- Nozieres and Schmitt-Rink (1985) P. Nozieres and S. Schmitt-Rink, J. Low Temp. Phys. 59, 195 (1985).
- Altman et al. (2004) E. Altman, E. Demler, and M. D. Lukin, Phys. Rev. A 70, 013603 (2004). M. Greiner, C. A. Regal, and D. S. Jin, Phys. Rev. Lett. 94, 070403 (2005). S. Foelling et al., Nature 434, 481 (2005).