Optical properties of the Ce and La di-telluride charge density wave compounds
Abstract
The La and Ce di-tellurides LaTe2 and CeTe2 are deep in the charge-density-wave (CDW) ground state even at 300 K. We have collected their electrodynamic response over a broad spectral range from the far infrared up to the ultraviolet. We establish the energy scale of the single particle excitation across the CDW gap. Moreover, we find that the CDW collective state gaps a very large portion of the Fermi surface. Similarly to the related rare earth tri-tellurides, we envisage that interactions and Umklapp processes play a role in the onset of the CDW broken symmetry ground state.
pacs:
71.45.Lr,78.20.-eI Introduction
Charge-Density-Wave (CDW) is a paramount example of broken-symmetry ground state principally driven by the electron-phonon interaction and occurring in low dimensional materials. More than 50 years ago Peierls first pointed out that a one-dimensional (1D) metal coupled to the underlying lattice is indeed not stable at low temperatures peierls . In most cases, the instability in 1D leads to a metal-insulator phase transition. The excitation spectrum of the resulting ground state of such a coupled electron-phonon system is characterized by a gap absorption feature, as a consequence of the Fermi surface (FS) nesting with wave vector , and by a collective mode formed by electron-hole pairs at grunercdw . In contrast to superconductors, the phase excitations of the collective mode are gapless. Consequently, electrostatic potentials (due to impurities, grain boundaries, surface effect etc.) break the translational symmetry and lead to the pinning of the collective mode. This ultimately results in a non conducting but highly polarizable ground state in 1D grunercdw . By increasing the dimensionality of the interacting electron gas system the impact of the nesting is less relevant and the fraction of gapped FS is reduced. CDW transitions then lead in 2D to a pseudogap feature in the density of states and those 2D systems remain metallic down to low temperatures. That increasing the dimensionality less affects the FS is also well represented by the progressive suppression of the singularity in the Lindhard response function at , which in fact totally disappears in 3D grunercdw . Furthermore, low dimensionality has a strong impact in the normal state properties, as well, which particularly in one dimension can be suitably explained within the Tomonaga-Luttinger liquid or Luther-Emery scenarios degiorgibook ; vescoli .
The formation of CDW ground states is by now well documented in a broad range of low dimensional solids grunercdw , among which we encounter the linear chain organic and inorganic compounds. An effective low-dimensionality has been also identified in the layered Te2 (=La and Ce), which play host to a CDW state, described in terms of modulated Cu2 Sb-type structure (Pa/nmm) based on alternating layers of square-planar Te sheets and a corrugated Te slab shin ; kang . It is worth noting that no clear electronic phase transitions are observed below 300 K, and the material appears to be deep in the CDW state even at room temperature. A substantial anisotropy in the electrical resistivity confirms the quasi-2D character of the charge carriers. The temperature dependence of the resistivity is moreover reminiscent of either a doped small-gap semiconductor or possibly a semimetal and is certainly far from that of a good metal shin . A superlattice modulation of the average structure has been observed via transmission electron microscopy (TEM) shin ; dimasi and x-ray diffraction stowe , with somewhat different modulation wave vectors for the two compounds. Tunneling experiment jung and angle resolved photoemission spectroscopy (ARPES) reveal furthermore a large CDW gap (the ARPES gap extends between 100 and 600 meV shin ; kang ; XPSgap ). The gap was found to vary in magnitude around FS rather differently for the two compounds shin ; kang , presumably reflecting the different lattice modulations. These observations essentially establish the lattice modulation in Te2 as a CDW, driven by an electronic instability of FS. Since the title compounds are essentially quasi-2D materials, the FS is only partially gapped by the CDW transition, so that ungapped charge carriers contribute to the conductivity at low temperatures. Heat capacity measurements at low temperatures also indicate a very small electronic density of states, consistent with the measured electrical resistivity shin .
Te2 share several common features and similar properties with the related bilayer Te3 materials sacchettiprb . The structural and electronic simplicity of Te2 and Te3, combined with the large size of the CDW gap, makes these materials particularly attractive for studying the effect of CDW formation on the electronic structure of layered systems. One approach is to exploit optical spectroscopy methods, which are ideal experimental tools to get insight into the absorption spectrum of the investigated materials. Optical data allow in principle to address both the gapped as well as the ungapped fractions of FS sacchettiprb . We seek to identify and to discuss the gap excitation and the fraction of FS involved in the CDW transition. These measurements were also partially inspired by the desire to reconcile ARPES results (which show ungapped sections of FS shin ; kang ; XPSgap ) with dc resistivity measurements (typical for a bad metal shin ). Furthermore, the frequency dependence of the absorption spectrum will shed light on the possible non-Fermi liquid nature of the electronic properties of these low dimensional layered compounds.
II Experiment and Results
We report the first comprehensive optical study on LaTe2 and CeTe2 single crystals, which were grown in this case by slow cooling a binary melt, as described previously in Ref. shin, . Samples grown by this technique are as close to stoichiometric as possible, having compositions CeTe2.00 and LaTe1.95 as determined by electron microprobe analysis using elemental standards, with an uncertainty of +/- 0.03 in the Te content. The crystals were polished in order to achieve a clean surface for the reflectivity measurements. Exploiting several spectrometers and interferometers, the optical reflectivity was measured for all samples from the far-infrared (6 meV) up to the ultraviolet (6 eV) spectral range, with light polarized parallel to the Te planes. Details pertaining to the experiments can be found elsewhere sacchettiprb ; dressel ; wooten .
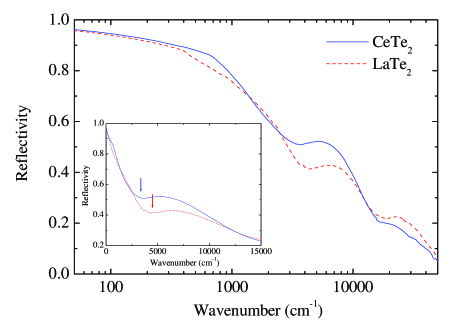
Figure 1 displays for both title compounds over the whole investigated spectral range. does not display any temperature dependence between 300 and 10 K in the covered energy interval and merges to total reflection for frequency going to zero for both compounds. The spectra are therefore typical of an overall metallic behaviour. Overlapped to the plasma edge feature (for cm-1) one can observe furthermore a rather broad absorption peaked at about 6000 cm-1. This feature is emphasized by the blow-up of (inset Fig. 1) in the spectral range around 6000 cm-1.
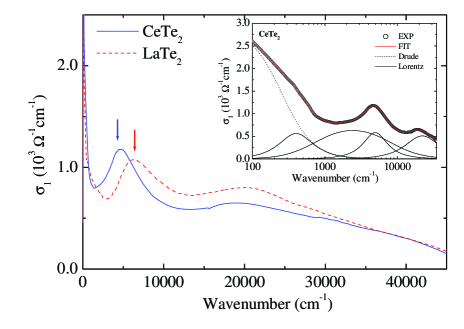
These characteristic fingerprints of the electrodynamic response in Te2 are even better highlighted in the real part of the optical conductivity, shown in Fig. 2. is achieved through standard Kramers-Kronig transformation dressel ; wooten of . To this purpose was extended towards zero frequency (i.e., ) with the Hagen-Rubens extrapolation )= and with standard power-law extrapolations at high frequencies (i.e., x104 cm-1). The dc conductivity values employed in the Hagen-Rubens extension of are in fair agreement with transport measurements shin . In we observe the so-called effective Drude resonance below 1000 cm-1, due to the free-charge carriers, and the mid infrared absorption at 5000 and 6000 cm-1 for CeTe2 and LaTe2 (arrows in Fig. 2), respectively, which will be later ascribed to the single particle excitation across the CDW gap. At higher frequencies there is also a broad feature centered at about 2x104 cm-1 signaling the onset of electronic interband transitions. Tight binding band structure calculations reveal indeed the presence of excitations due to the electronic interband transitions well above 1 eV shin .
In order to facilitate the discussion and for better identifying the characteristic features in the electrodynamic response of these rare-earth di-tellurides, we describe their absorption spectrum within the Lorentz-Drude phenomenological approach dressel ; wooten . It consists in reproducing the dielectric function by the following expression:
| (1) | |||||
where is the optical dielectric constant, and are the plasma frequency and the width of the Drude peak, whereas , , and are the center-peak frequency, the width, and the mode strength for the -th Lorentz harmonic oscillator (h.o.), respectively. is then obtained from .
The fits of all spectra were extended up to 4x104 cm-1. Besides the Drude contribution, four Lorentz h.o.’s for each compound are required to fit all features at finite frequencies. The three lowest frequency h.o.’s will be associated below with the CDW gap excitation, while the fourth one will represent the first excitation at the onset of the high frequency electronic transitions. This is explicitly shown in the inset of Fig. 2 for the Ce-compound, where the fit components are displayed together with the total fit. The fit quality is astonishingly good for both investigated compounds.
III Discussion
The depletion in the spectrum (Fig. 2) between the Drude component and the absorption feature at about 6000 cm-1 bears a rather striking similarity with the situation encountered in the absorption spectrum of the bilayer Te3 sacchettiprb . Therefore making use of the analogous notation of Ref. sacchettiprb, , we claim that such a depletion in identifies the onset for the excitation across the CDW gap into the single particle () states, giving rise to the mid infrared absorption. From now on we will refer to this mid infrared absorption as peak. We note from Fig. 2 and its inset that the peak coincides with the third Lorentz h.o. at about 5000 and 6000 cm-1 for CeTe2 and LaTe2, respectively. Nonetheless, this absorption feature is also characterized by a rather broad low frequency tail (represented in the fit by the two lowest h.o.’s), which extends well within the high frequency tail of the Drude component. This might indicate, on the one hand, that the metallic component is not simply Drude-like and that some localization occurs, or on the other hand, that the peak in each compound can be thought as composed by the superposition of several excitations. These latter excitations, in analogy to Te3 sacchettiprb , would mimic a continuous distribution of gap values, as seen in ARPES shin ; kang . This would also mean that the CDW gap differently affects the Fermi surface (FS), with perfectly nested regions of FS with a large gap and non-perfectly nested ones with a small gap.
Following our previous work on Te3 sacchettiprb and tending towards the scenario in which the data are described by a distribution of gaps, we can similarly introduce a so-called averaged quantity :
| (2) |
which represents the center of mass of the excitation. We believe that provides an average single energy scale, estimating the optical CDW gap. Table I displays the values of for both compounds. for the rare-earth di-tellurides decreases by almost a factor of two going from La to Ce, while it was almost identical between CeTe3 and LaTe3. in LaTe2 is comparable to the value for LaTe3 and in CeTe2 is smaller than in CeTe3 sacchettiprb . Our gap values in Te2 lie in the interval of CDW gaps, estimated from ARPES data shin ; kang .
The spectral weight encountered in the Drude component is also of interest: the plasma frequency in the CDW state remains almost constant (Table I) in the La and Ce di-tellurides, while it slightly increases from LaTe3 to CeTe3. obviously refers to the ungapped fraction of FS, thus responsible for the effective metallic behaviour even within the CDW phase. For these ungapped carriers in the CDW state, we assume a 2D free-holes scenario. The Sommerfeld -value of the specific heat and the charge carriers effective mass in the CDW phase are related by sacchettiprb :
| (3) |
Using J/molK2 for LaTe2 shin ; notegamma , we achieve for both compounds, as reported in Table I. We can now exploit in order to obtain the free charge carriers concentration in the CDW state, listed in Table I, as well.
| Samples | |||||||
|---|---|---|---|---|---|---|---|
| LaTe2 | 6840 | 5502 | 0.0845 | 1.2 | 1.3 | 0.3 | 0.03 |
| CeTe2 | 6658 | 3165 | 0.0805 | 1.2 | 1.4 | 0.3 | 0.03 |
It is now worth extending this analysis to the hypothetical normal state (NS), which should develop at temperatures much higher than 300 K. Again we make use of our previous analysis for the rare earth tri-tellurides sacchettiprb and we exploit an elementary 2D tight-binding calculation involving the Te px and py orbitals shin . The Fermi energy, associated to the holelike charge-carriers, is eV. Therefore, considering a parabolic expansion of the 2D bands around their maximum, is then related to the effective mass in the (hypothetical) NS by sacchettiprb :
| (4) |
where is the 2D hole density in NS. With (=4.5 Å, for both compounds LattConst ), the resulting are reported in Table I. and describe the average curvature of the free charge carriers bands in CDW and NS, respectively. There is approximately a factor of four between and (in the Te3 compounds it was a factor of 2 sacchettiprb ). Such a difference suggests again that in the CDW phase the average curvature of the bands is larger than in NS.
The values allow us to extract the NS charge carrier’s concentration , which can be then directly compared with , estimated from the chemical counting kang . Prerequisite for the achievement of is first of all the estimation of the total spectral weight associated to the itinerant charge carriers in NS. If we assume the conservation of the spectral weight between the CDW and the normal state, and that there will be no peak in the (hypothetical) NS, the Drude contribution in NS would then have a total spectral weight given by sacchettiprb . Therefore, from we obtain as reported in Table I. The values are indeed very close to =2 nchem . While differences in the stoichiometry of the two compounds due to Te vacancies might account for a small part of this difference, the origin of the discrepancy most likely lies in the approximations we have used to extract . Given the experimental uncertainties, the rather fair agreement between and adds confidence to the reliability of our analysis.
From our data we can also estimate the quantity (Table I), representing the ratio between the spectral weight of the Drude peak and the total spectral weight of the Drude term and mid infrared absorption. roughly measures, as previously shown in Ref. sacchettiprb, , the fraction of the ungapped FS area (i.e., those parts of FS which are not affected by the CDW state). Since is proportional to (), it turns out to be about a factor four larger than the carriers’ ratio in both systems (Table I). The very small values of , however comparable to those of Te3 sacchettiprb , confirm that a large (and almost equal) portion of FS for both La and Ce di-tellurides is gapped. Large gapped regions of FS has been also evinced from recent ARPES data, even though the relative ratio of the gapped regions was found to be rather different for the two compounds shin . The presence of only a very small numbers of carriers at the Fermi energy would explain the bad metallicity observed by electrical conductivity as well as heat capacity shin . We also note that there is a substantial disorder in the La compound arising from the Te vacancies, an effect all but absent in the stoichiometric tri-telluride compounds. Therefore, polaronic and/or localization effects may also play a significant role in substantially reducing the conductivity.
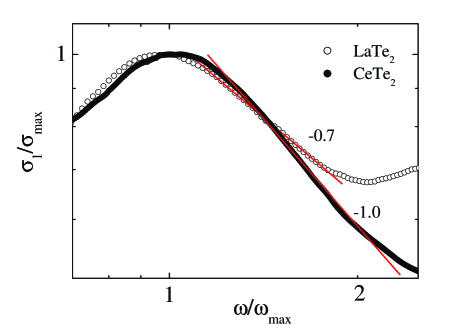
We have also observed a power-law behaviour () in Te2 for frequencies above . This is shown in Fig. 3 for both investigated compounds, using a scaled representation. for Te2 ranges between -0.7 and -1 for the La and Ce compounds, respectively. These values compare rather well with those in Te3 and the power-law behaviour extends over an equivalent spectral range, as well sacchettiprb . Such a power-law behaviour may be a further evidence for a typical Tomonaga-Luttinger liquid scenario, and emphasizes a non-negligible contribution of 1D correlation effects in the physics of these 2D compounds vescoli ; sacchettiprb ; giamarchi . An exponent close to -1 could suggest a so-called antiadiabatic limit in the sense that one could integrate over the phonon field. The phonon fluctuations would then introduce an effective interaction between the particles. However, this scenario would be extremely unlikely since one would need characteristic phonon modes above 1 eV sacchettiprb ; giamarchi . Alternatively an exponent of the order of -1 could be reconciled with the theory if one assumes direct interaction between electrons, as source for Umklapp scattering giamarchi . As shown already for Te3 sacchettiprb , this theoretical framework would then be in reasonable agreement with the observed experimental behaviour in Te2, as well. Consequently a standard electron-phonon mechanism in Te2, as well as in Te3, may not be enough to fully account for the CDW formation.
Finally, we note that the low frequency side of below the peak also possibly hints to a power-law behaviour with (not shown). However, such an exponent in Te2 differentiates quite substantially from the values encountered in the Ce and La tri-tellurides sacchettiprb . In these latter compounds at , which has been considered as a further clear indication for Umklapp processes; the dominant source of scattering underlying a 1D Mott (insulating) state giamarchi . Any attempt to elucidate such a puzzling difference in the low frequency power-law behaviour between di- and tri-tellurides would be rather speculative at this point, since the observed low frequency power-law in Te2 develops over too small of a spectral range.
IV Conclusions
In summary, we have described the optical response in Te2 for =La and Ce. Our data, besides revealing the excitation across the CDW gap, also indicate that a large portion of FS is gapped for both compounds. This strengthens the view of the rare-earth di-tellurides as poor metals with small density of states at the Fermi level. From the high frequency power-law behaviour we evinced a hidden one-dimensional behaviour in these quasi-2D layered compounds, similar to that which is observed for the closely related Te3 compounds.
ARPES and thermodynamic experiments have pointed out the sensitive role played by perturbation, like Te vacancies, on the CDW state shin . Such a sensitivity is even stronger than in Te3 and it has been mainly associated with the observation that the nesting wave vectors, particularly in CeTe2, are somewhat poorly defined shin . Besides the Te deficiencies, changes in the rare earth (chemical pressure) may also lead to subtle differences in the lattice modulation. Therefore, applied pressure might also affect to some extent the electronic structure and the CDW condensate and might therefore be used to differentiate between the effects of chemical pressure and vacancy concentration in determining the differences between these two compounds. Analogous to Te3 sacchettipressure pressure dependent optical investigations may be of great relevance. Such investigations are in progress and will be reported elsewhere.
Acknowledgements.
The authors wish to thank J. Müller for technical help and V. Brouet for fruitful discussions. One of us (A.S.) wishes to acknowledge financial support from the Della Riccia Foundation. This work has been supported by the Swiss National Foundation for the Scientific Research within the NCCR MaNEP pool. This work is also supported by the Department of Energy, Office of Basic Energy Sciences under contract DE-AC02-76SF00515.References
- (1) R. Peierls, Quantum Theory of Solids, Clarendon Press, Oxford (1955).
- (2) G. Grüner, Density Waves in Solids, Addison Wesley, Reading, MA (1994).
- (3) Strong Interactions in Low Dimensions, Eds. D. Baeriswyl and L. Degiorgi, Kluwer Academic Publishers, Dordrecht (2004).
- (4) V. Vescoli, F. Zwick, W. Henderson, L. Degiorgi, M. Grioni, G. Gruner, and L.K. Montgomery, Eur. Phys. J. B 13, 503 (2000).
- (5) K.Y. Shin, V. Brouet, N. Ru, Z.X. Shen and I.R. Fisher, Phys. Rev. B 72, 085132 (2005), and references therein
- (6) J.-S. Kang, C.G. Olson, Y.S. Kwon, J.H. Shim and B.I. Min, Phys. Rev. B 74, 085115 (2006).
- (7) E. DiMasi, B. Foran, M.C. Aronson and S. Lee, Phys. Rev. B 54, 13587 (1996).
- (8) K. Stowe, J. Solid State Chem. 149, 155 (2000) and J. Alloys and Compounds 307, 101 (2000).
- (9) M.H. Jung, T. Ekino, Y.S. Kwon and T. Takabatake, Phys. Rev. B 63, 035101 (2000).
- (10) The gap values determined from the ARPES experiments are always referred with respect to the Fermi energy. Assuming the Fermi energy in the middle of the gap, means that the optically determined gap is about twice as large as the ARPES one.
- (11) A. Sacchetti, L. Degiorgi, T. Giamarchi, N. Ru and I.R. Fisher, Phys. Rev. B 74, 125115 (2006), and references therein.
- (12) M. Dressel, and G. Grüner, Electrodynamics of Solids, Cambridge University Press (2002).
- (13) F. Wooten, Optical Properties of Solids, Academic Press, New York (1972).
- (14) Analogous to Te3 sacchettiprb , we use the value of LaTe2 for CeTe2, as well. For magnetic members of the rare-earth series is difficult to extract from thermodynamic experiments. However, since the chemical and structural changes across the series are small and even though the modulation wave vectors and density of states at are rather different among the two compounds shin ; kang , the assumption of equal for both compounds seems at this point to be a reasonable approximation.
- (15) P. Villars and L.D. Calvert, Pearson’s Handbook of Crystallographic Data for Intermetallic Phases, American Society for Metals, Metals Park, OH (1991).
- (16) The ionic configuration of Te2 is considered to be Te(2)2-Te(1)1- so as to produce hole carriers in the Te(1) sheets, precisely one hole for each formula unit. Since the unit-cell contains 2 formula unit, the number of the hole carriers () inside the unit cell is 2, as the number of Te(1)1- atoms in the planar sheets kang . We note that corresponds to a 3/4 full band, since the pz orbitals are filled.
- (17) T. Giamarchi, Quantum Physics in One Dimension, Oxford University Press, Oxford (2004).
- (18) A. Sacchetti, E. Arcangeletti, A. Perucchi, L. Baldassarre, P. Postorino, S. Lupi, N. Ru, I.R. Fisher and L. Degiorgi, Phys. Rev. Lett. 98, 026401 (2007).