A length scale for the superconducting Nernst signal above Tc in Nb0.15Si0.85
Abstract
We present a study of the Nernst effect in amorphous superconducting thin films of Nb0.15Si0.85. The field dependence of the Nernst coefficient above Tc displays two distinct regimes separated by a field scale set by the Ginzburg-Landau correlation length. A single function , with the correlation length as its unique argument set either by the zero-field correlation length (in the low magnetic field limit) or by the magnetic length (in the opposite limit), describes the Nernst coefficient. We conclude that the Nernst signal observed on a wide temperature () and field () range is exclusively generated by short-lived Cooper pairs.
pacs:
74.70.Tx, 72.15.Jf, 71.27.+aThe observation of a finite Nernst signal in the normal state of high- cupratesWang et al. (2006) has revived interest in the study of superconducting fluctuations. In low-temperature conventional superconductors, short-lived Cooper pairs above have been mostly examined through the phenomena of paraconductivityGlover (1967) and fluctuation diamagnetismGollub et al. (1973). Due to a sizeable contribution coming from free electrons to conductivity and magnetic susceptibility, the sensitivity of these probes to superconducting fluctuations is limited to a narrow region close to the superconducting transitionSkocpol and Tinkham (1975).
Because of a low superfluid density, the superconducting state in underdoped cuprates is particularly vulnerable to phase fluctuationsEmery and Kivelson (1995). Therefore, long-lived Cooper pairs without phase coherence and vortex-like excitations associated with them were considered as the main source of the anomalous Nernst effect observed in an extended temperature window above Tc in underdoped cupratesWang et al. (2006).
In a recent experiment on amorphous thin films of the conventional superconductor Nb0.15Si0.85Pourret et al. (2006), we found that a Nernst signal generated by short-lived Cooper pairs could be detected up to very high temperatures () and high magnetic field () in the normal state. In these amorphous films, the contribution of free electrons to the Nernst signal is negligible. Indeed, the Nernst coefficient of a metal scales with electron mobilityBehnia et al. (2006). The extremely short mean free path of electrons in amorphous Nb0.15Si0.85 damps the normal-state Nernst effect and allows a direct comparison of the data with theory. In the zero-field limit and close to , the magnitude of the Nernst coefficient was found to be in quantitative agreement with a theoretical predictionUssishkin et al. (2002) by Ussishkin, Sondhi and Huse, (USH) invoking the superconducting correlation length as its single parameter. At high temperature and finite magnetic field, the data was found to deviate from the theoretical expression.
In this Letter, we extend our measurements and analysis of the Nernst signal to high magnetic field and temperatures well above Tc. The Nernst coefficient, , is reduced as one increases either the temperature or the magnetic field. We will show here that both these variations reflect a unique dependence on a single length scale. A striking visualization of this emerges when one substitutes temperature and magnetic field by their associated length scales: the zero-field superconducting correlation length and the magnetic length . The symmetric contour lines of in the (, ) plane shows that its dependence on both field and temperature can be described by a single function with the superconducting correlation length as its unique argument. In the low-field limit, the correlation length is set by and in the high-field limit by . In the intermediate regime, when , the correlation length is a simple combination of these two lengths. This observation is additional proof that the Nernst signal observed up to high temperature () and high magnetic field () in this system is exclusively generated by superconducting fluctuations – i.e. short-lived Cooper pairs. Hence the functional dependence of the Nernst coefficient on the correlation length is empirically determined in a wide range extending from the long correlation length regime, where the data follows the prediction of USH theory, to the short correlation length regime, where the Ginzburg-Landau approximation fails and no theoretical expression is yet available.
Amorphous thin films of NbxSi1-x were prepared in ultrahigh vacuum by electron beam co-evaporation of Nb and Si, with special care over the control and homogeneity of the concentrations. The competition between superconducting, metallic and insulating ground states is controlled by the Nb concentration, the thickness of the films, or the magnetic fieldMarnieros et al. (2000); Lee et al. (2000); Aubin et al. (2006). Two samples of identical stoichiometry – Nb0.15Si0.85 – but with different thicknesses and are used in this study. Sample 1 (2) was 12.5 (35) nm thick and its midpoint was 0.165 (0.380) K. The physical properties of these two samples as well as the experimental set-up were detailed in our previous communication, which also presented part of the data discussed herePourret et al. (2006).
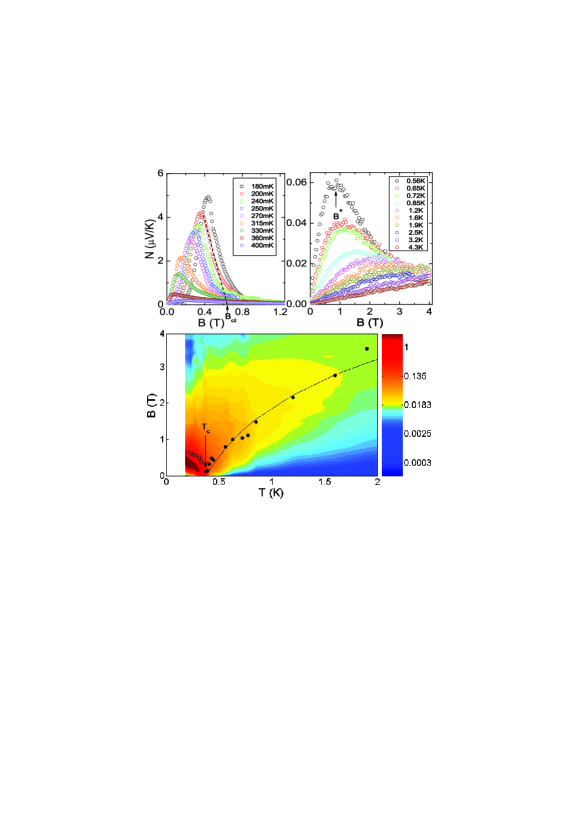
Figure 1 shows the Nernst signal, as a function of magnetic field and temperature, for sample 2. Below , the magnetic field dependence shows the characteristic features of vortex-induced Nernst effect, well known from previous studies on conventional superconductorsHuebener and Seher (1969) and high- cupratesWang et al. (2006). For each temperature, the Nernst signal increases steeply when the vortices become mobile following the melting of the vortex solid state. It reaches a maximum and decreases at higher fields when the excess entropy of the vortex core is reduced. As the temperature decreases the position of this maximum shifts towards higher magnetic fields. This is not surprising, since in the superconducting state, all field scales associated with superconductivity are expected to increase with decreasing temperature. In particular, this is the case of the upper critical field, , which can be roughly estimated by a linear extrapolation of the Nernst signal to zero as it has been done in cupratesWang et al. (2006).
Above , the temperature dependence of the characteristic field scale is reversed. In this regime, at low magnetic field, the Nernst signal increases linearly with field, as expected from the USH theory where follows the simple expressionUssishkin et al. (2002) :
| (1) |
[Note that here we use the definition of , which differs by a factor of from what was used in ref.Ussishkin et al. (2002) and Pourret et al. (2006). This, for obvious reasons to appear below.] Upon increasing the magnetic field, the Nernst signal deviates from this linear field dependence, reaches a maximum at a field scale and decreases afterwards to a weakly temperature-dependent magnitude. In contrast to the superconducting state (), the position of the maximum shifts to higher fields with increasing temperature. The contour plot in the (T,B) plane (lower panel) shows that these two field scales, and , evolve symmetrically with respect to the critical temperature. One major observation here is that the magnitude and the temperature dependence of follows the field scale set by the Ginzburg-Landau correlation length through the relation where is the flux quantum and the reduced temperature. [This field scale was dubbed “the ghost critical field” by Kapitulnik and co-workersA. Kapitulnik and Deutscher (1985).] The value for the correlation length at zero-temperature is determined from the BCS formula in the dirty limit , where vF m2s-1 is estimated using the known values of electrical conductivity and specific heatPourret et al. (2006).
Thus, the decrease of the Nernst signal at the field scale is the consequence of the reduction of the correlation length when the cyclotron diameter becomes shorter than the zero-field correlation length , at a given temperature. This phenomena is well known from studies of fluctuations diamagnetism in low temperature superconductorsGollub et al. (1973) and cupratesCarballeira et al. (2000). While in the low field limit, the magnetic susceptibility should be independent of the magnetic field – i.e. in the Schmidt limitSchmid (1969) –, the magnetic susceptibility is experimentally observed to decrease with the magnetic field, following the Prange’s formulaPrange (1970); which is an exact result within the Ginzburg-Landau formalism that takes into account the reduction of the correlation length by the magnetic field. In this regime, the amplitude fluctuations are described as evanescent Cooper pairs arising from free electrons with quantized cyclotron orbitsSkocpol and Tinkham (1975). In our experiment, we can clearly distinguish the low-field limit – where the cyclotron length is larger than the correlation length – from the high-field limit, where the correlation length has been reduced from its value at zero field to a shorter value given by the magnetic length.
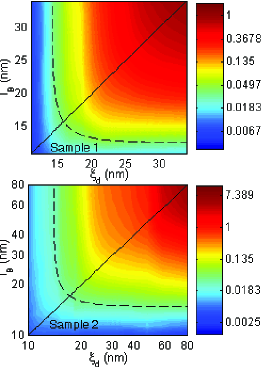
Figure 2 presents a contour plot (with a logarithmic scale of the colors) of the Nernst coefficient in the (, ) plane. [Note that in contrast to Figure 1, and not is plotted here]. These graphs are instructive. When , the contour lines are parallel to the magnetic length axis, meaning that the Nernst coefficient depends only on . On the other side of the diagonal, when , the contour lines are parallel to the correlation length axis, meaning that the Nernst coefficient depends only on . Furthermore, in both samples, the contour lines are almost symmetric with respect to the line. In other words, the Nernst coefficient appears to be uniquely determined by the correlation length, no matter whether or sets it.
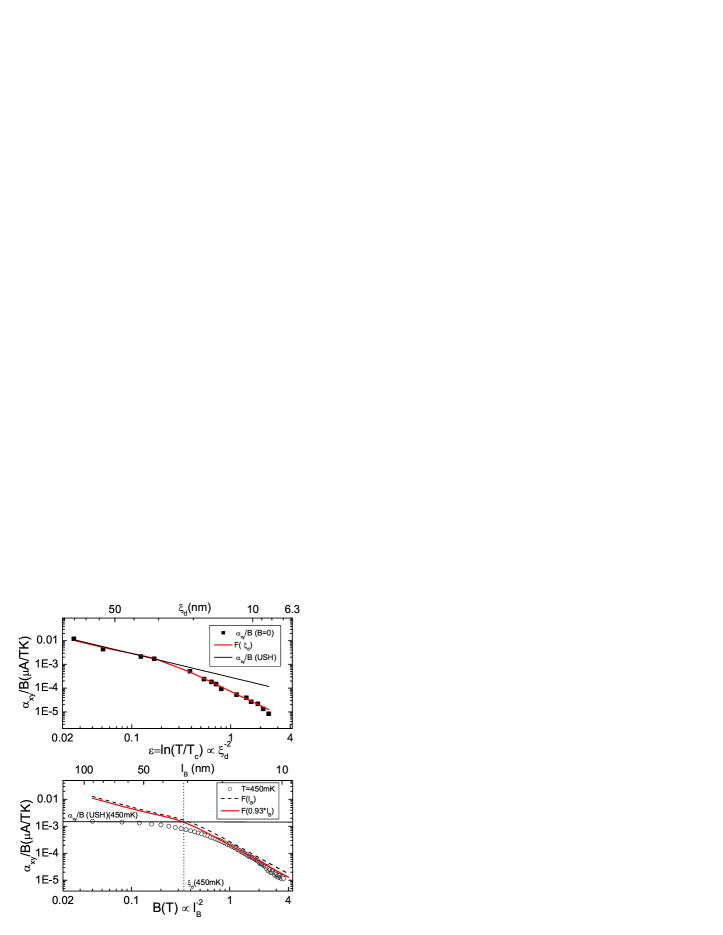
Therefore, we are entitled to assume that there exists a function which links to the correlation length. In the zero-field limit, the latter is set by , and we can empirically extract from our data a function such as . This function is shown in figure 3(upper panel). For large , it is proportional to , in agreement with the USH expression. For small , however, we find that this function becomes roughly proportional to . Now a remarkable observation follows : when this function is plotted with the magnetic length as argument, as shown in the lower panel of figure 3, we find that it almost describes the magnitude and the field dependence of the Nernst coefficient at high magnetic field. This demonstrate that in these two opposite limits, ( and ), the Nernst coefficient is determined by this single function that depends uniquely on the correlation length.
This function, extracted from the zero field data and observed to describe the data at high magnetic field, should also be valid at intermediate field, when . In this intermediate region, with the increasing magnetic field, the correlation length progressively evolves from to . A simple relation for that verifies the conditions, when , and when is given by :
| (2) |
where the pre-factor c and the exponent are to be determined from the experimental data. The pre-factors for sample 1 and for sample 2 are determined such as gives precisely the field dependence of the Nernst coefficient at high magnetic field, shown figure 3. The slight difference between the pre-factors for the two samples is not understood at this stage. It appears to be larger than the experimental margin of error and suggests that other parameters not taken into account in this analysis may be involved, such as the thickness of the samples. To get the value of the exponent , we first note that the curves , for temperature , collapse on a unique curve when they are plotted as a function of , as shown figure 4. Then, using – as previously observed for – and using equation 2, we find that depends only on the ratio , and so has the appropriate functional form to describe the collapsed data. For both samples, the best fit is obtained when , as shown Figure 4 for sample 2. Such a value of implies that the first non-linear correction to the field dependence of is proportional to (i.e ), in agreement with analyticity arguments111M. Feigelman, Private Communication. With these parameters just determined, figure 2 shows that the contour lines of equal Nernst coefficient can be described by curves of constant correlation length as given by equation 2. Thus, as shown figure 4, above , the magnitude of the Nernst coefficient at any temperature and magnetic field is given by this unique function , determined experimentally at zero field, where the correlation length is given by equation 2.
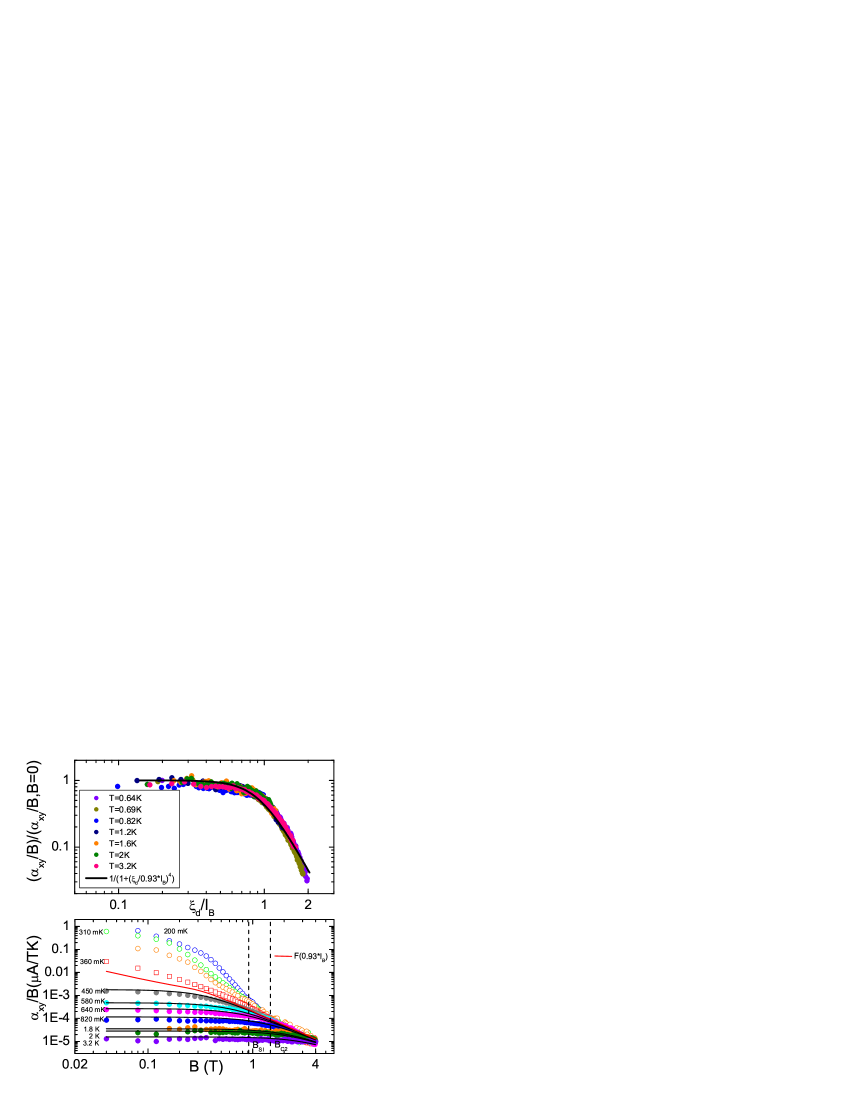
Figure 4 also shows that the magnitude and field dependence of the Nernst signal, measured for temperatures and high magnetic field (), can also be described by . In particular, we see that the Nernst data measured at a temperature close to follows closely the curve on a wide magnetic field range; this is expected for the diverging Ginzburg-Landau correlation length when approaching . It is remarkable to note that the curve , extracted from the data at zero-field, and plotted as a function of , gives precisely the separatrix between the curves measured above and below . Below , joins the function at a critical field , which is larger than the critical field of the superconductor-insulator transition, , defined as the crossing field of curvesAubin et al. (2006).
The overall consistency of this analysis demonstrates that the off-diagonal component of the Peltier tensor, , is set by over a wide temperature range. As noticed previously, when is large, is consistent with USH expression. However, below a correlation length of the order of , it deviates downward from the USH formula. Such a deviation is actually expected for theories based on the Ginzburg-Landau formalism, which are notoriously known to overestimate the effect of short-wave length fluctuationsSkocpol and Tinkham (1975). In fluctuations diamagnetism experiments, the data were observed to fall systematically below the Prange’s limit above some scaling field, of the order of in dirty materials, i.e. .
Let us conclude by briefly commenting the case of cuprates. One crucial issue to address is the existence of the “ghost critical field” detected here. We note that such a field scale has not been identified in the analysis of the cuprate dataWang et al. (2006). However, one shall not forget that the normal state of the underdoped cuprates is not a simple dirty metal. The contribution of normal electrons to the Nernst signal is too large to be entirely negligible. This makes any comparison between theory and data less straightforward than the analysis performed here. Moreover, in Nb0.15Si0.85 there is a single temperature scale, , for the destruction of superconductivity. In contrast, the situation in the cuprates may be complicated by the possible existence of two distinct temperature scales, the pairing temperature and a Kosterlitz-Thouless-like temperature leading to a phase-fluctuating superconductorPodolsky et al. (2006).
To summarize, in the regime of short-lived Cooper pairs, the Nernst coefficient was found to only depend on the superconducting correlation length. We could clearly distinguish the regime where the correlation length is set by the Ginzburg-Landau correlation length at zero-field from the high-field regime where the correlation length is set by the magnetic length. In the intermediate region where , the correlation length is a simple combination of these two lengths. These results demonstrate that the Nernst signal observed at high field and temperature in amorphous films of Nb0.15Si0.85 is generated by superconducting fluctuations characterized by short-lived Cooper pairs, implying both amplitude and phase fluctuations of the superconducting order parameter.
We acknowledge useful discussions with S. Caprara, M.V. Feigelman, M. Grilli, D. Huse, S. Sondhi , I. Ussishkin and A.A. Varlamov. This work was partially supported by Agence Nationale de la Recherche and Fondation Langlois through “Prix de la Recherche Jean Langlois”.
———————————-
References
- Wang et al. (2006) Y. Wang, L. Li, and N. P. Ong, Phys. Rev. B 73, 024510 (2006).
- Glover (1967) R. E. Glover, Physics Letters A 25, 542 (1967).
- Gollub et al. (1973) J. P. Gollub, M. R. Beasley, R. Callarot, and M. Tinkham, Physical Review B 7, 3039 (1973).
- Skocpol and Tinkham (1975) W. J. Skocpol and M. Tinkham, Reports on Progress in Physics 38, 1049 (1975).
- Emery and Kivelson (1995) V. J. Emery and S. A. Kivelson, Nature 374, 434 (1995).
- Pourret et al. (2006) A. Pourret, H. Aubin, J. Lesueur, C. A. Marrache-Kikuchi, L. Bergé, L. Dumoulin, and K. Behnia, Nature Physics 2, 683 (2006).
- Behnia et al. (2006) K. Behnia, M. Measson, and Y. Kopelevich, cond-mat p. 0611136 (2006).
- Ussishkin et al. (2002) I. Ussishkin, S. L. Sondhi, and D. A. Huse, Phys. Rev. Lett. 89, 287001 (2002).
- Marnieros et al. (2000) S. Marnieros, L. Bergé, A. Juillard, and L. Dumoulin, Physical Review Letters 84, 2469 (2000).
- Lee et al. (2000) H. L. Lee, J. P. Carini, D. V. Baxter, W. Henderson, and G. Gruner, Science 287, 633 (2000).
- Aubin et al. (2006) H. Aubin, C. A. Marrache-Kikuchi, A. Pourret, K. Behnia, L. Bergé, L. Dumoulin, and J. Lesueur, Phys. Rev. B 73, 094521 (2006).
- Huebener and Seher (1969) R. P. Huebener and A. Seher, Physical Review 181, 710 (1969).
- A. Kapitulnik and Deutscher (1985) A. P. A. Kapitulnik and G. Deutscher, J. Phys. C: Solid State Phys. 18, 1305 (1985).
- Carballeira et al. (2000) C. Carballeira, J. Mosqueira, A. Revcolevschi, and F. Vidal, Physical Review Letters 84, 3157 (2000).
- Schmid (1969) A. Schmid, Physical Review 180, 527 (1969).
- Prange (1970) R. E. Prange, Physical Review B 1, 2349 (1970).
- Podolsky et al. (2006) D. Podolsky, S. Raghu, and A. Vishwanath, cond-mat/0612096 (2006).