Also at ]Institut für Festkörperphysik, Technische Universität Dresden, D-01062 Dresden, Germany
A crystallographic phase transition within the magnetically ordered state of Ce2Fe17
Abstract
X-ray diffraction experiments were performed on polycrystalline and single-crystal specimens of Ce2Fe17 at temperatures between 10 K and 300 K. Below = 1182 K, additional weak superstructure reflections were observed in the antiferromagnetically ordered state. The superstructure can be described by a doubling of the chemical unit cell along the direction in hexagonal notation with the same space group as the room-temperature structure. The additional antiferromagnetic satellite reflections observed in earlier neutron diffraction experiments can be conclusively related to the appearance of this superstructure.
pacs:
61.10.Nz, 61.12.Ld, 61.50.Ks, 75.50.Bb, 75.50.EeI Introduction
The magnetic states in Fe17 compounds ( = rare earth) are mainly determined by the exchange interactions between the Fe moments,Buschow77 where competition between antiferromagnetic and ferromagnetic interactions results in the appearance of an antiferromagnetic or ferromagnetic ground state related to the ion’s moment, anisotropy and/or size.Coey93 ; Makihara03 The balance between these interactions seems particularly delicate for Ce2Fe17, where even slight structural or chemical changes can strongly modify the magnetic behavior.Janssen97
Ce2Fe17 orders antiferromagnetically below the Néel temperature K. At K a second transition is observed into a modified antiferromagnetic state.Janssen97 Several publications have also reported a ferromagnetic state for their samples at low temperatures,Makihara03 ; Kuchin00 ; Prokhnenko02a but this is most likely caused by small amounts of dopants in the investigated samples.Janssen06 This interpretation is supported by systematic studies of series of samples with partial substitution of Fe by Al, Si or Mn.Mishra96 ; Artigas98 ; Kuchin00 ; Kuchin00a ; Pirogov00 Furthermore, a Ce2Fe17 sample with a ferromagnetic state at = 40 K at ambient pressure shows a transition into an antiferromagnetic order under isostatic compression at 3 kbar.Prokhnenko02a ; Prokhnenko02 ; Prokhnenko04 These studies indicate that the magnetic behavior is extremely sensitive to slight changes of the crystal structure either through modifications of the chemical composition or thermodynamic parameters, like pressure. Significant magneto-elastic coupling has also been observed in the course of a study of the magnetic phase diagram where it was noticed that some phase transitions, in an applied magnetic field, were associated with dramatic changes in the shape of the sample.Janssen06 So far, the relationship between the magnetic behavior and changes in the crystal structure in Ce2Fe17 have been mainly based on analysis of lattice parameters or the volume of the crystallographic unit cell. Here, we present an x-ray investigation on powder and single crystals focussed on qualitative changes in the crystal structure of Ce2Fe17.
Ce2Fe17 crystallizes in the Th2Zn17-type structure with the rhombohedral space group (No. 166).Buschow77 In the following, the hexagonal description is used. At room temperature the lattice parameters are = 8.4890 Å and = 12.410 Å. The Ce atoms are located on the Wyckoff site 6 (0, 0, 0.3435). The Fe atoms occupy four different sites, 6 (0, 0, 0.0968), 9 (1/2, 0, 1/2), 18 (0.2905, 0, 0), and 18 (0.5015, 0.4985, 0.1550).Janssen06 In two independent neutron diffraction investigations, satellite reflections were observed below related to the antiferromagnetic structure with an incommensurate propagation vector in the hexagonal direction. Below additional magnetic satellite reflections were present. Interestingly, these reflections were indexed as (0 0 3/2)± identifying them as satellites to a reference vector (0 0 3/2).Plumier74 ; Fukuda99 ; Fukuda99a The authors concluded that the incommensurate antiferromagnetic structure “is derived from a superstructure magnetic cell with a parameter twice as large as the one of the nuclear cell”.Plumier74 However, in all scattering studies to date no reflections at the position of the reference vector (0 0 3/2) have been reported.
In the present investigation, these corresponding superstructure
reflections have been observed in well-characterized
Ce2Fe17 samples. The superstructure reflections related
to (0 0 3/2) were studied as function of temperature between 10 K
and 300 K. Furthermore, entire reciprocal planes were measured,
using high-energy x-rays and image-plate technology, in order to
identify additional superstructure reflections. This
superstructure will be discussed in terms of its relation to the
room-temperature structure and its interactions with the magnetic
and electronic properties.
II Sample Preparation and Experimental Conditions
Ce2Fe17 samples were grown by a self-flux technique.Janssen06 Two types of samples were prepared for the present investigations. Single crystals with shiny surfaces were prepared in the same manner as the samples investigated in Ref. Janssen06 . For the x-ray powder diffraction measurements, a polycrystalline sample was prepared by grinding one single crystal into fine powder which was kept under acetone to prevent oxidation. In order to achieve a uniform x-ray path through the sample, this polycrystalline material was pressed into the hole of a 3 mm diameter copper disk that measured 1.2 mm thick. Both sides of the disk were covered with kapton foil to keep the powder in place. For single-crystal x-ray diffraction experiments, a plate-like single crystal with dimensions 3 x 2 x 0.5 mm3 was selected and attached to a flat copper sample holder. The same single crystal was used in all single-crystal measurements.
For both the x-ray powder and single crystal diffraction measurements, the samples were mounted on the cold finger of a helium closed-cycle cryostat where the temperature can be varied between 10 K and 300 K. Two configurations for thermal shielding were employed in these measurements. First, three beryllium domes were used for thermal isolation. The inner dome was filled with helium gas to ensure good thermal exchange. A second dome between the inner and the outer domes provided additional heat shielding. The outer dome served as a vacuum enclosure. However, even though the elastic scattering of x-rays by beryllium is weak, the strongly textured Debye-Scherrer rings were found to impair the observation of very weak reflections from the sample. Therefore, during the search for superstructure reflections, an aluminum can with kapton windows was used. Although the sample temperature was no longer as well defined, the sample enclosure produced only a weak diffuse background. To define the sample temperature, measurements were performed in both configurations by keeping the sample in place and exchanging only the sample enclosures.
Two x-ray scattering instruments were employed. Preliminary single crystal measurements were made on a standard four-circle diffractometer using Cu- radiation from a high intensity rotating anode x-ray source, selected by a silicon (1 1 1) monochromator. The synchrotron x-ray diffraction measurements on the powder and single crystal samples were performed using a six-circle diffractometer at the 6-ID-D station in the MU-CAT sector at the Advanced Photon Source, Argonne. The synchrotron radiation, with a selected energy of 88 keV, allowed investigations of bulk samples because the absorption length is approximately 2.2 mm for Ce2Fe17, larger than the thickness of either the polycrystalline or single crystal samples. The beam size was 500 x 500 m2 limited by a rectangular slit system. For the high-energy x-ray measurements of both the powder and single crystal samples, the full two-dimensional diffraction patterns were recorded using a MAR345 image-plate system positioned 730 mm behind the sample. The active detection area of 3450 x 3450 pixels of size 100 x 100 m2 covered a total scattering angle 2 of 13 deg, or a reciprocal space range of 12 Å-1 at this energy.
III Measurements and Results
III.1 Laboratory x-ray measurements of a single crystal
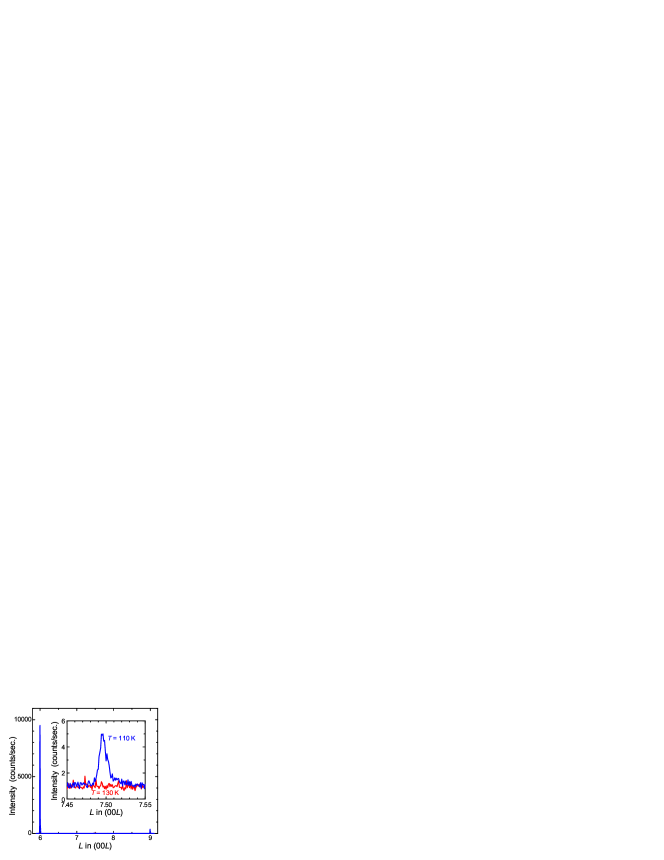
In the preliminary diffraction study of a Ce2Fe17 single crystal on a standard four-circle diffractometer, strong reflections were found at positions () in hexagonal notation with where , , , and integers according to the space group for the known room-temperature crystal structure. In what follows, we categorize these reflections as the main reflections. Below , additional reflections were systematically observed at positions (), as shown in FIG. 1. Even though these additional reflections are weak, they indicate an enlarged unit cell, or crystallographic superstructure. Hence these reflections are categorized superstructure reflections. Their measured intensity is nearly four orders of magnitude lower than that of the main reflections, as illustrated in FIG. 1. The transverse peak widths of both sets of reflections (rocking curves), however, are similar (0.03 deg). While these measurements clearly establish the existence of a crystallographic superstructure in Ce2Fe17 below , elucidation of the nature of the modified unit cell requires more extensive measurements of the superstructure diffraction peaks.
III.2 High-energy x-ray diffraction measurements of a powder sample
In an attempt to collect additional superstructure peaks associated with the modified chemical unit cell below , diffraction patterns of the polycrystalline Ce2Fe17 sample were measured at different temperatures between = 10 K and 300 K using the high-energy x-rays available in Station 6ID-D of the MUCAT Sector at the Advanced Photon Source. For the polycrystalline sample, the data were integrated over the Debye-Scherrer cone, collected by the area detector, to obtain the diffracted intensity as a function of the scattering angle 2. Additionally, the sample was continuously rocked around its vertical axis up to 2.9 deg. An adequate averaging over sample grains was thus achieved.
FIG. 2 shows patterns measured at base temperature, = 10 K, and at 130 K, which is slightly above the transition temperature . The lower panel shows the difference between the two diffraction patterns. The difference is dominated by the decrease of the intensity of Bragg reflections with increasing temperature due to thermal motion. Additionally, the thermal lattice expansion yields small shifts of the reflections yielding differences in the patterns. Beside these effects the diffraction patterns remain essentially the same. Therefore, the main features of the crystallographic structure are unchanged between = 10 K and 130 K.
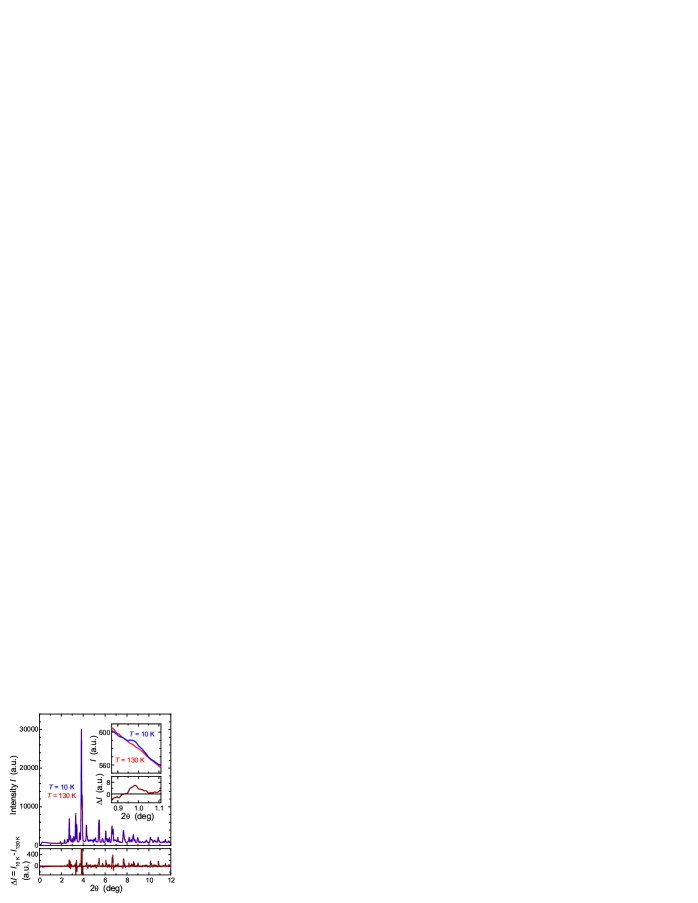
Below , however, a very weak additional reflection was observed at low scattering angles, 2. The inset in FIG. 2 shows this reflection which can be indexed as (0 0 3/2). Its intensity increases with decreasing temperature, and it is about four orders of magnitude lower than the strongest reflections at room temperature, consistent with the superstructure observed in the laboratory measurements described above. Unfortunately, observations of related superlattice reflections at higher scattering angles 2 failed due to the overlap with much stronger reflections corresponding to the room-temperature crystal structure.
III.3 High-energy x-ray diffraction measurements of a single crystal
In order to unambiguously determine the nature of the superstructure below in Ce2Fe17, measurements of single crystals over a wide range of reciprocal space are required. For the single crystal, a special rocking technique was applied to record the diffraction intensity within planes in reciprocal space. The scattering geometry of FIG. 3 describes the experiment. In FIG. 3b) the scattering geometry is represented by an Ewald sphere fixed in the coordinate system of the instrument. The image plate records all points on the Ewald sphere, up to the maximum scattering angle 2 given by the ratio of the dimension of the image plate and the distance between sample and detector. The origin of reciprocal lattice is located at the center of the recorded pattern. The orientation of the reciprocal lattice relative to the Ewald sphere is given by the orientation of the sample in the instrument (FIG. 3a)). It can be modified by two independent tilting angles perpendicular to the incoming beam. If the designated reciprocal plane is perpendicular to the incident beam, only one point, the origin, is intersected by the Ewald sphere. If the sample is now tilted by a small angle, the intersection between the Ewald sphere and the designated reciprocal plane is a circle, and can be recorded. The diameter of this circle increases with increasing tilting angle. In any experimental measurement the resolution is finite, and consequently an annulus is recorded as illustrated in FIG. 3c). By tilting the sample through both angles, and summing the recorded patterns, an extended piece of the designated reciprocal plane can be recorded. To obtain the entire reciprocal plane without gaps, both tilting angles have to be scanned in a two dimensional mesh, and the step size for the sampling mesh has to be adjusted to the instrumental resolution and the mosaic spread of the sample.
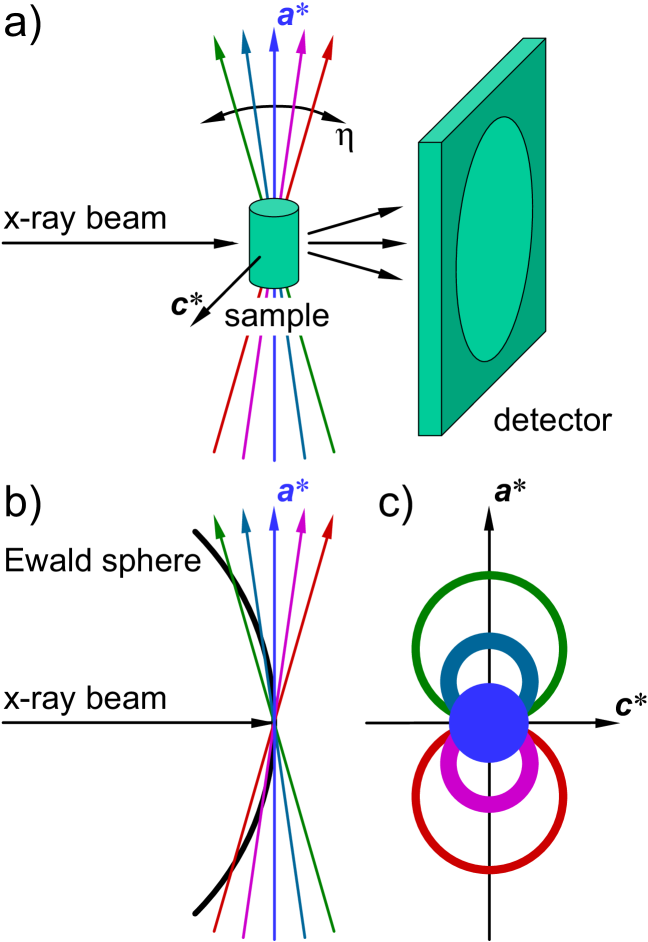
Unfortunately, points away from the designated reciprocal plane are also recorded. Depending on the dimensions of the reciprocal lattice and the tilting angles, reciprocal planes other than the designated plane will also intersect the Ewald sphere. This limits the analyzable area of the recorded pattern and, accordingly, the maximum range of meaningful tilting angles. The diameter of the analyzable area is proportional to the radius of the Ewald sphere given by the length of the wave vector of the incident x-rays. The use of high-energy x-rays significantly enhances this study because the relatively short wavelength corresponds to large a magnitude of the incident wavevector. A considerable amount of time was required to read out the image plate. Therefore, the image plate was exposed during the full time of meshing both tilting angles rather than recording separate patterns at stepwise increments in the tilting angles. An additional advantage of this method is the opportunity to scan one tilting angle continuously, as only the second tilting angle needs to be changed stepwise.
The study of the Ce2Fe17 single crystal was performed by scanning the horizontal angle up to 1.8 deg and stepping the vertical angle up to 1.8 deg with a step size of 0.15 deg. The total exposure time was 150 sec. for each pattern, which was determined by the maximum motor speed for the tilting angles. Aluminum attenuators were used to adapt the scattered intensity to the dynamic range of the image-plate system. Furthermore, to eliminate extraneous reflections from the Be domes as discussed above, an aluminum enclosure with kapton windows was used for these measurements. In FIG. 4 diffraction patterns are shown for the three most relevant reciprocal planes (), (), and ().
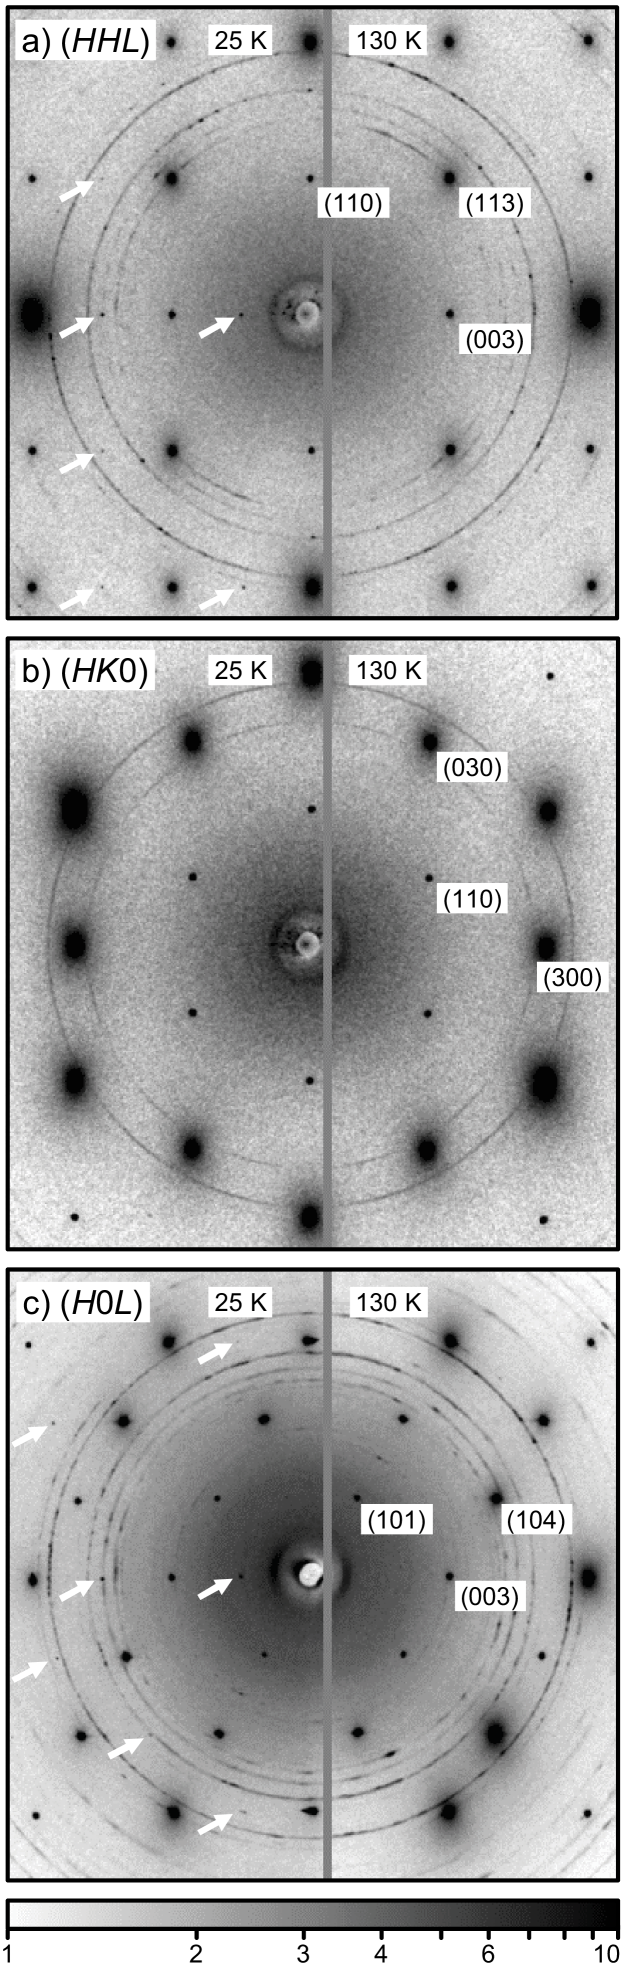
Above , the diffraction patterns were consistent with the room-temperature crystal structure. Weak ring-like scattering features in the patterns arose from small amounts of polycrystalline CeFe2 and an undefined polycrystalline sample impurity. In the () plane, only a two-fold rotation axis perpendicular to the diffraction pattern was found as a symmetry element. Reflections were observed at positions () with where , , and are integers, according to the space group . Interestingly, no reflections were found at positions () with where , , and are integers, expected for a twinned single crystal. Below , superstructure reflections were observed in the () and () plane at positions displaced by (0 0 3/2) from positions related to the room-temperature crystal structure. No other extra reflections were observed. In the () plane, no superstructure reflections were found. All diffraction patterns measured at low temperatures are consistent with a unit cell doubled along the direction based on the dimensions of the room-temperature unit cell.

To measure the temperature dependence of the superlattice
reflections, diffraction patterns of the () plane were
recorded, but with the sample enclosed by the beryllium domes.
The reflection intensity was determined as function of the
well-defined sample temperature by fitting two-dimensional
gaussian-shaped peaks to the diffraction patterns. FIG. 5 shows
the result for selected superstructure reflections. The good
agreement between the intensity of corresponding Friedel-pair
reflections indicates a properly chosen experimental geometry.
The temperature-dependent data are well described by a power law.
A transition temperature = 1182 K was
consistently determined for all investigated reflections. This
transition temperature is consistent with that observed in
low-field magnetization measurements of the same sample. The
transition temperature is slightly lower than for the samples in
Ref. Janssen06 . The difference is likely caused by a small
amount of a dopant. Recently, for example, we have found that a
doping by only 0.1% of Al for Fe causes a decrease in
by
about 10 K.Janssen07
IV Discussion
IV.1 Superstructure and crystallographic phase transition
In Ce2Fe17, a crystallographic superstructure was found below = 1182 K. In addition to the measurements described here, we have observed similar crystallographic superstructure reflections in recent neutron diffraction experiments as well as x-ray resonant magnetic scattering (XRMS) studies, which will be presented elsewhere. However, it is worth emphasizing here that the sample penetration depth for all of these structural probes covers a large range from 2 m in the XRMS study at the Ce- absorption edge, to 2.2 mm for the high-energy x-ray diffraction experiments, and up to few cm for the scattering of thermal neutrons, respectively. Thus these experiments have probed the formation of the superstructure in different parts of the sample, from near-surface regions through the entire bulk. In all cases the widths of the superstructure reflections were similar to the widths of main reflections. This indicates that the superstructure forms with the same degree of perfection as the main crystal structure in every part of the sample. The intensity ratio between the superstructure and main reflections was consistent in all these studies. From these results it can be concluded that the superstructure is uniform throughout the entire Ce2Fe17 sample.
We now turn to a discussion of the space group of the low-temperature superstructure as determined by an analysis of possible crystallographic subgroups of the room-temperature space group . The observed doubling of the unit cell in the hexagonal direction corresponds to a doubling of the length along the body diagonal in the rhombohedral lattice. Only two subgroups of the space group are related to a doubling of the unit cell in the direction, the non-isomorphic subgroup (A) (, , ) and the isomorphic subgroups (B) (, , ).IntTab96 The prime symbol (’) denotes the subgroup. Both subgroups (A) and (B) yield a general condition for () reflections with which can be satisfied by the observed diffraction patterns considering the transformation . The subgroup (A) contains an additional general condition for () reflections with and caused by the glide plane.IntTab96 However, the observed reflections violate this condition, e.g. reflections were present at (0 0 3/2) and (0 0 9/2) positions which would be (0 0 3) and (0 0 9), respectively, in the notation of the subgroup. As result, only subgroup (B) is possible. All observed diffraction patterns are in agreement with this subgroup, (, , ) as space group for the low-temperature phase.
The doubling of the unit cell in relates to a substitution of the symmetry element translation with the vector by a translation with the vector 2, which corresponds to twofold reduction of the symmetry. Therefore, the transition from the room-temperature structure to the low-temperature superstructure can be described by a transition to a direct subgroup of the original space group of index two.IntTab96
| room : | low : | |||||||||
| Ce | 0 | 0 | 0 | 0 | /2 | |||||
| 0 | 0 | /2+1/2 | ||||||||
| Fe | 0 | 0 | 0 | 0 | /2 | |||||
| 0 | 0 | /2+1/2 | ||||||||
| Fe | 1/2 | 0 | 1/2 | 0.5 | -0.5 | 0.25 | ||||
| Fe | 0 | 0 | - | 0 | 0 | |||||
| - | 0 | 1/2 | ||||||||
| Fe | - | - | /2 | |||||||
| - | /2+1/2 |
TABLE 1 lists the transformation of the atomic positions and their Wyckoff sites according to the subgroup description defined above. For atoms on the original Wyckoff sites 6, 18, and 18, the site symmetry is not changed by the phase transition. Consequently, these sites split up into two new sites with a doubling of the number of free parameters for the atomic positions according to the index two of the subgroup. The situation is different for the original Wyckoff site 9 which transforms to the new Wyckoff site 18. The new site symmetry is, by index two, lower than the original site symmetry . The missing symmetry element yields two new free parameters for the new Wyckoff position, (), in contrast to the fixed original Wyckoff position, (),IntTab96 see TABLE 1.
The observed intensity of superstructure reflections can be used for an order-of-magnitude estimate of the corresponding displacement of atoms from their room-temperature position with higher symmetry. The observed intensity ratio between the superstructure reflection (0 0 15/2) at = 110 K and the main reflection (0 0 6) at = 130 K, respectively, is roughly 4 : 9500 as shown in FIG. 1. This intensity ratio depends only on the position of the atoms because (0 0 ) reflections average structure features perpendicular to the direction. Two different cases of atomic displacements are considered. In the first, the superstructure is caused by a displacement of only one atomic site, the Fe site , for example. A relative displacement of 0.005 r.l.u. along the direction is required to obtain the observed intensity ratio. In a second scenario, all atoms are displaced in direction by an equal distance. The sense of direction for the displacement is chosen in such a manner that the intensity ratio is maximized. The result is a relative displacement of 0.0002 r.l.u. These two cases represent roughly the upper and lower limit for atomic displacements related to the observed superstructure. These very slight changes in the crystal structure are consistent with the observed marginal changes of the main reflections.
According to Landau’s theory, a phase transition described by a subgroup relation is consistent with a second order phase transition where a symmetry element is broken and an order parameter starts to develop.Landau37 The atomic displacement must follow the temperature dependence of the intensity, because the intensity of superstructure reflections depends quadratically on the value of the atomic displacement. Hence the atomic displacement can be considered as the order parameter of this phase transition. It starts at the transition temperature without a jump. Therefore, no abrupt re-arrangement of atoms is necessary to originate the observed behavior around the phase transition. It can be described as a diffusion-less movement of atoms consistent with a second order phase transition.
IV.2 Influence of the crystallographic phase transition on magnetic and electronic properties
As discussed in the introduction, the magnetic properties of Ce2Fe17 seem particularly sensitive to small changes in chemistry and structure. The magnetic and electronic properties can be influenced in several manners by the observed crystallographic phase transition. We now consider the effect of the change in local symmetries and of the additional freedom in atomic positions as well as the consequences of the doubling of the unit cell.
A lowering of the site symmetry is associated with a lowering of the symmetry of the crystal-electric field for the atoms on this site. However, only minor changes in the magneto-crystalline anisotropy are expected because crystal-electric field effects are less important in Ce2Fe17. More relevant for the magnetism, is the splitting of original single Wyckoff sites into pairs of Wyckoff sites. The related doubling of the number of free parameters for the atomic positions yields changes in the distance and angle between magnetic neighbor atoms which can, in principle, affect the strength of the magnetic exchange.Coehoorn89 ; Givord74 This can be important for Ce2Fe17 in light of the delicate balance between antiferromagnetic and ferromagnetic interactions. For example, for the Fe atoms originally located on the Wyckoff site 9, the effect is not only quantitative, it is qualitative due to the change in the local symmetry at the phase transition. For the room-temperature structure, these atoms are located on a two-fold rotation axis. Thus, neighbor atoms are pairwise symmetry-coupled, and the distances between them are equal. This condition is lost in the low-temperature structure, and the distances between these neighboring atoms are different. Consequently, the strength of the magnetic exchange between these neighboring atoms is no longer equal, possibly leading, in some cases, to a change in sign of the magnetic exchange.
In the low-temperature phase, the doubling of the unit cell along the hexagonal direction in real space halves the Brillouin zone in direction, and the shape of the Brillouin zone changes accordingly, because the dimension in direction is now much smaller than in other directions. This is evidenced in FIG. 4 by the smaller distances along the direction between reflections, normal and superstructure reflections together, in comparison to other directions. Modifications of the electronic band structure, associated with the opening of a new superzone gap, can be expected and can result in changes in the transport properties. Indeed, in measurements of the electric conductivity on Ce2Fe17 single crystals, a strong increase in resistivity was observed below the transition temperature .Janssen06 This increase is strongly anisotropic; it is much larger for the current flowing parallel to the direction than for the current flowing perpendicular to the direction. A detailed description of this effect consistent with the formation of anisotropic superzone gaps is given in Ref. Janssen06 . It should be mentioned, that the crystallographic phase transition occurs in the antiferromagnetically ordered state with an incommensurate propagation vector in direction. Both superstructures, the crystallographic superstructure and the antiferromagnetic superstructure, can yield superzone gaps and, therefore, can cause the change in resistivity at the phase transition temperature . In break-junction measurements, the differential conductance exhibits gap features associated with the low-temperature phase below .Ekino99 Remarkably, features were determined at two energy scales 12-14 meV and 26-32 meV on a polycrystalline sample at = 4.2 K. This could be related to the existence of two different gap features probably caused by the changes in the crystal structure and in the magnetic order.
In addition to generating superlattice reflections, the change in the chemical unit cell below also modifies the description of the magnetic order in reciprocal space and, accordingly, the pattern for magnetic scattering. In neutron powder experiments, satellite reflections related to the antiferromagnetic structure with an incommensurate propagation vector in the hexagonal direction were observed below .Plumier74 ; Fukuda99 ; Fukuda99a Below additional satellite reflections were observed, which could be indexed with the same propagation vector, but starting from the reference position (0 0 3/2). The crystal superstructure determined in the present publication yield new lattice points at just such positions. Therefore, the results of the earlier neutron scattering experimentsPlumier74 ; Fukuda99 ; Fukuda99a can be reinterpreted as the observation of magnetic satellite reflections according to the same incommensurate propagation vector based upon the lattice of the new superstructure. Accordingly, the number of pairs of observed antiferromagnetic satellite reflections is doubled below in comparison to the number above .
Based on these results, additional information can now be extracted from the neutron powder diffraction patterns of Ce2Fe17 measured under isotropic pressures up to 5 kbar.Prokhnenko02a ; Prokhnenko02 ; Prokhnenko04 At ambient pressure, a ferromagnetic state was observed in this sample. Possible reasons for this different magnetic state are related to sample preparation and discussed in Ref. Janssen06 . An antiferromagnetic state can be induced by pressures higher than 3 kbar at = 40 K.Prokhnenko02a Two groups of antiferromagnetic satellite reflections appear. The first group consists of satellite reflections related to an incommensurate propagation vector similar to those observed for antiferromagnetic order at higher temperatures at ambient pressure. The second group of reflections were indexed with a new, different incommensurate propagation vector.Prokhnenko02a However, these new satellite reflection at 2 11 deg. shown in FIG. 11 of Ref. Prokhnenko02a can be indexed by (0 0 3/2)-. All new satellite reflections can be indexed in the same way as the low-temperature antiferromagnetic phase discussed in the present work. This reinterpretation is supported by the pressure dependence of the positions of these reflections, the (0 0 3/2)- reflection moves in the opposite direction to the (0 0 0)+ reflection. This suggests that the ferromagnetic-antiferromagnetic phase transition at a pressure of 3 kbar is connected with the appearance of a similar superstructure as observed in Ce2Fe17 samples, which show an antiferromagnetic state at low temperatures at ambient pressure.
V Conclusions
In conclusion, a superstructure was observed in Ce2Fe17, which appears below = 1182 K in the antiferromagnetically ordered state. It can be described by a doubling of the unit cell in hexagonal direction and the same space group as the room-temperature structure. The second order phase transition is realized by a diffusion-less movement of atoms. The additional freedom in atomic positions and the change in local symmetry for the Fe atoms at the original Wyckoff sites 9 can influence the magnetic behavior due to the delicate balance between antiferromagnetic and ferromagnetic interactions which are strongly dependent on the distance between neighbor Fe atoms. The halving of the Brillouin zone in direction can cause a superzone gap in the electronic structure, which is consistent with observations of an anisotropic increase in the electric resistivity below . Additional antiferromagnetic satellite reflections observed in former neutron diffraction experiments can be conclusively related to the appearance of the crystallographic superstructure.
VI ACKNOWLEDGEMENTS
The authors thank J. Frederick and S. Jia for the assistance in sample preparation. Ames Laboratory is supported by the Department of Energy, Office of Science under Contract No. W-7405-ENG-82. Use of the Advanced Photon Source (APS) is supported by the U.S. Department of Energy, Basic Energy Sciences, Office of Science, under Contract No. W-31-109-ENG-38. The Midwest Universities Collaborative Access Team sector at the APS is supported by the Department of Energy, Office of Science through the Ames Laboratory Contract No. W-7405-ENG-82.
References
- (1) K. J. H. Buschow, Rep. Prog. Phys. 40 (1977) 1179.
- (2) J. M. D. Coey, J. E. M. Allan, A. A. Minakov, and Yu. V. Bugaslavsky, J. Appl. Phys. 73 (1993) 5430.
- (3) Y. Makihara, H. Fujii, T. Fujiwara, K. Watanabe, K. Takahashi, K. Koyama, and M. Motokawa, Physica B 329-333 (2003) 663.
- (4) Y. Janssen, H. Fujii, T. Ekino, K. Izawa, T. Suzuki, T. Fujita, and F. R. de Boer, Phys. Rev. B 56 (1997) 13716.
- (5) A. G. Kuchin, A. N. Pirogov, V. I. Khrabrov, A. E. Teplykh, A. S. Ermolenko, and E. V. Belozerov, J. Alloys Comp. 313 (2000) 7.
- (6) O. Prokhnenko, C. Ritter, Z. Arnold, O. Isnard, J. Kamarád, A. Pirogov, A. Teplykh, and A. Kuchin, J. Appl. Phys. 92 (2002) 385.
- (7) Y. Janssen, S. Chang, A. Kreyssig, A. Kracher, Y. Mozharivskyi, S. Misra, and P. C. Canfield, submitted to Phys. Rev. B (2006).
- (8) M. Artigas, D. Fruchart, O. Isnard, S. Miraglia, and J. L. Soubeyroux, J. Alloys Comp. 270 (1998) 28.
- (9) A. G. Kuchin, V. I. Khrabrov, A. S. Ermolenko, E. V. Belozerov, and G. M. Makarova, Phys. Met. Met. 90 (2000) 123.
- (10) A. N. Pirogov, A. E. Teplykh, A. G. Kuchin, and E. V. Belozerov, Phys. Met. Met. 90 (2000) 186.
- (11) S. R. Mishra, G. J. Long, O. A. Pringle, D. P. Middleton, Z. Hu, W. B. Yelon, F. Grandjean, and K. H. Buschow, J. Appl. Phys. 79 (1996) 3145.
- (12) O. Prokhnenko, C. Ritter, Z. Arnold, O. Isnard, A. Teplykh, J. Kamarád, A. Pirogov, and A. Kuchin, Appl. Phys. A 74 (2002) S610.
- (13) O. Prokhnenko, I. Goncharenko, Z. Arnold, and J. Kamarád, Physica B 350 (2004) 63.
- (14) R. Plumier and M. Sougi, Int. Conf. Magn. Moscow 1973, Nauka 3 (1974) 487.
- (15) H. Fukuda, Y. Janssen, H. Fujii, T. Ekino, and Y. Morii, JAERI-Review 1999 99-007 (1999) 94.
- (16) H. Fukuda, Y. Janssen, H. Fujii, T. Ekino, and Y. Morii, Nippon Oyo Jiki Gakkaishi 23 (1999) 108.
- (17) Y. Janssen et al., publ. in preparation.
- (18) T. Hahn (Ed.), Int. tables for cryst. A, Kluwer Academic Publishers, Dordrecht (1996).
- (19) L. D. Landau, Zh. Eksp. Teor. Fiz. (Sov. Phys. JETP) 7 (1937) 19.
- (20) R. Coehoorn, Phys. Rev. B 39 (1989) 13072.
- (21) D. Givord and R. Lemaire, IEEE Trans. Magn. MAG-10 (1974) 109.
- (22) T. Ekino, H. Umeda, H. Fukuda, Y. Janssen, H. Fujii, J. Magn. Soc. Japan 23 (1999) 111.