The Fermi edge singularity of spin polarized electrons
Abstract
We study the absorption spectrum of a two-dimensional electron gas (2DEG) in a magnetic field. We find that that at low temperatures, when the 2DEG is spin polarized, the absorption spectra, which correspond to the creation of spin up or spin down electron, differ in magnitude, linewidth and filling factor dependence. We show that these differences can be explained as resulting from creation of a Mahan exciton in one case, and of a power law Fermi edge singularity in the other.
pacs:
73.43.Lp, 78.67.-n, 71.35.Pq, 73.21.-bThe role of Coulomb interactions in the optical absorption spectrum of a Fermi sea of electrons has attracted interest for several decades. The response of the electron gas to the sudden creation of the hole attractive potential is manifested in a singularity at the photon energy for which an electron is excited to the Fermi level. This singularity, known as the Fermi edge singularity (FES), was first studied by Mahan Mahan67a ; Mahan67b in the context of the X-ray absorption edge of metals and the interband spectrum of degenerate semiconductors. Using a ladder diagram approach he was able to show that the absorption is singular at the threshold energy h , where is the gap energy, is the electron Fermi momentum, and is the electron-hole reduced mass. At higher energies, the absorption intensity decays as , where is a dimensionless coupling constant describing the interaction between the electrons and the deep hole created in the absorption process. An exact expression for the absorption spectrum was later derived by Combescot and Noziers Nozieres69 ; Combescot71 , and practically verified Mahan’s predictions.
A two-dimensional electron gas (2DEG) in modulation doped quantum wells has proven to be particularly convenient for observing and studying the FES. The ability to vary the electron density, , and the ratio between temperature and Fermi energy provides an important handle on the behavior of the singularity. Indeed, in the last two decades there has been a rich body of theoretical Ruckenstein87 ; Sham90 ; Hawrylak91 ; Westfahl98 and experimental work Skolnick87 ; Kalt87 ; Lee87 ; Brown96 ; Huard00 ; Yusa00 ; Kim92 ; Bar-Ad94 ; Brener95 ; Chen92 ; Rubio97 ; Geim94 on various aspects of the singularity in this system. In particular, photoluminescence measurements have shown that the singularity persists when a magnetic field is applied Skolnick87 ; Chen92 ; Rubio97 : the envelope of the Landau levels (LL) resembles the FES lineshape at zero magnetic field Westfahl98 . The role of the spin degree of freedom was, however, commonly assumed to be limited to the degeneracy in the density of states. Yet, it is plausible to expect that the 2DEG spin polarization would affect the FES in a profound way: electron-electron scattering, which plays a key role in the singularity Mahan67b , is strongly suppressed when the spin of the photo-excited electron is opposite to that of the Fermi sea electrons.
In this paper we study the absorption spectrum of a high mobility 2DEG in a magnetic field. Our main finding is that at low temperatures, when the 2DEG is spin polarized, the absorption spectra which correspond to the creation of a or electron differ in magnitude, linewidth and filling factor dependence. We show that these differences can be explained as resulting from the creation of a Mahan exciton Mahan67a in one case, and of a power law FES Mahan67b in the other.
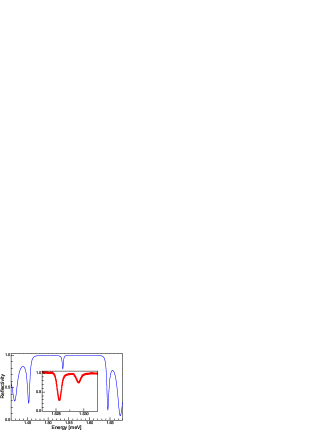
Measuring the absorption spectrum of a single GaAs quantum well (QW) at low temperatures has always been a difficult task. Here we introduce a new technique for measuring the absorption spectrum of a single QW, using very weak white light in a reflection geometry. The idea is growing a cavity structure in which the QW is located at an anti-node of a standing wave formed by the optical field. The structure consists of a Bragg reflector, made of pairs of layers of AlAs and Al0.3Ga0.70As ( nm), with its top layer is at a distance of from the surface. The Bragg reflector and the sample surface form a microcavity with a broad stop-band, in which all wavelengths are back reflected (). A modulation-doped GaAs QW, which is 20 nm wide and is embedded in Al0.38Ga0.62As barriers, is grown in the middle of the cavity, at a distance of from the Bragg mirror and the surface. Figure 1 shows the calculated reflectivity spectra, assuming typical excitonic parameters of a GaAs QW. The broad stop-band is seen to extend from to eV, with a deep notch at the exciton energy , eV. We find that the exciton lineshape is very sensitive to the location of the QW within the cavity, and one can get a Lorentzian or dispersive lineshape by varying it Zheng88 . The inset shows a reflectivity measurement of an optimized sample with a single modulation-doped QW at T. It can be seen that the reflectivity at the lowest LL energy is , corresponding to an order of magnitude enhancement relative to the single pass absorption. The whole structure is grown on an layer that serves as a back gate. The wafer was processed to form a mesa structure, with ohmic contacts to the QW and to the back gate, such that can be tuned in the range cm-2. The measured electron mobility is cm2 V-1 s-1. We used a tungsten halogen lamp to illuminate the sample, and selected a spectral range of 20 nm, centered around the heavy hole (hh) transition of the QW. The reflected light is analyzed with a circular polarizer, then dispersed in a spectrometer and detected in a CCD camera. This configuration allowed us to measure the absorption spectrum over a broad spectral range in a fraction of a second using sub-nW light intensity.
The experiment is performed in two systems: (i) A dilution refrigerator with optical windows at its base temperature of mK. (ii) A He cryostat with a fiber based system for illumination and collection and a temperature range of K. The magnetic field in both systems is applied parallel to the the growth direction. Changing the sign of while keeping the circular polarizer fixed corresponds to changing the circular polarization of the light: at positive fields we detect transitions from the hh band to the lower electron Zeeman spin subband (LZ) and at negative field - to the upper electron Zeeman spin subband (UZ). We label the transition to LZ as , and to UZ as .
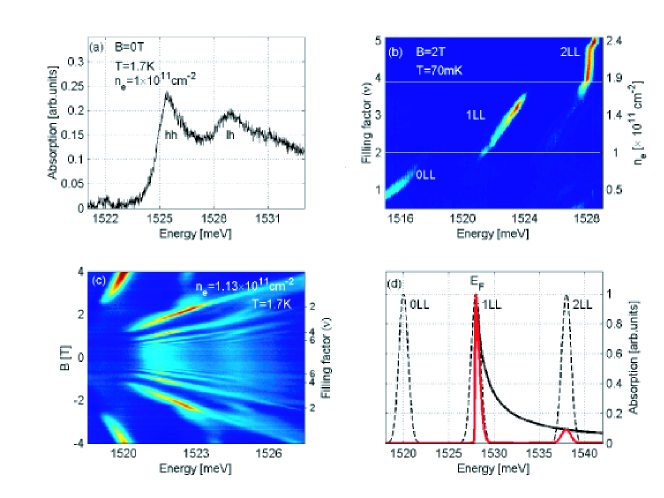
Figure 2a shows a typical absorption spectrum at and cm-2. Two peaks, corresponding to transitions from the heavy and light hole bands, can be clearly resolved. We note that the peaks are broad and have the characteristic asymmetric FES lineshape. Indeed, at this electron density the exciton and trion, which characterize the spectrum at lower densities, no longer exist. As we turn on the magnetic field the broad FES line splits into discrete LLs. Figure 2b shows a compilation of absorption spectra at T, in the range cm-2, which corresponds to the filling factor range . It can be seen that the absorption into a certain LL is strong only within a limited range. For example, absorption into the first LL (1LL) is significant only in the range : at electron densities above and below this range the absorption is substantially weaker. Similar behavior is observed when we fix and change . Figure 2c shows a compilation of absorption spectra measured at cm-2 for both signs of the magnetic field. For example, it can be seen that the 1LL absorption at negative fields is turned on at T (), reaches a maximum at T, and then gradually decays with increasing field. The appearance of absorption to a certain LL above a critical field (or below a critical ) could be explained by a band filling argument: Absorption to a LL is inhibited as long as it is full, and becomes allowed when its degeneracy is increased by increasing (or its occupation is decreased by decreasing ) Groshaus2004 . The behavior at the other limit is surprising: Why would the absorption to an empty LL be lower than to a partially filled one?
The answer to this question lies in the FES behavior, which is schematically depicted in Fig. 2d. The dashed line describes the LL single particle joint density of states, while the solid black line depicts the FES function when the Fermi energy () is at the center of the 1LL. The resulting absorption is described by the red line, which is the product of the dashed and solid black lines. It can be seen that the absorption of the 2LL is weak, even though it is empty of electrons. This description implies that the absorption is strong only at the LL at which resides, as indeed is observed in the experiment.
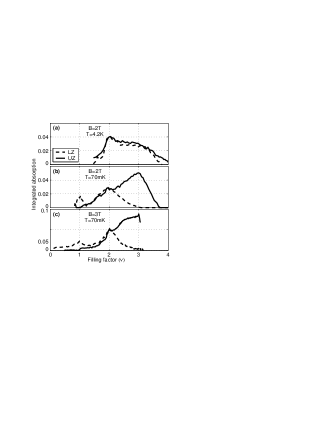
Let us now consider the role of the electron spin polarization in the FES. We start with measurements done at a high temperature of K and weak magnetic field of T, where the electrons should be spin depolarized. Figure 3a shows the integrated absorption at the 1LL as a function of filling factor, while keeping constant. Considering the scheme of Fig. 2d, this curve describes the dependence of the area under the central peak on . The onset of absorption at and its drop at are clearly visible. As expected for spin depolarized 2DEG, the absorption to both Zeeman levels is nearly identical.
This behavior drastically changes as we cool down the sample and the electrons become spin polarized. Figure 3b compares the integrated absorption to the UZ and LZ at 70 mK and T. We can see that at , where is in the 0LL and both Zeeman levels of the 1LL are empty, the absorption is essentially the same (there is a difference near ). At the two absorption lines behave markedly different: The absorption to the LZ decreases monotonically and vanishes at , when this level is fully occupied and jumps to the UZ. The absorption into the UZ, on the other hand, increases first, reaches a maximum at , and then falls steeply and vanishes slightly below . In fact, in the range the sum of the two absorption curves is nearly constant: The drop in the absorption of the LZ line is compensated by the rise in the absorption of the UZ. We can see that this picture repeats when we increase the field to T (Fig. 3c): The increase in degeneracy with increasing the field causes the UZ and LZ absorption to increase by , yet the dependence on remains the same. Furthermore, we find the same qualitative behavior at the 2LL at the corresponding ’s.
The fact that the two absorption curves are identical at K implies that the oscillator strength of the two Zeeman levels is the same, and the observed differences at low temperature are due to the difference in occupation of the two Zeeman levels. To explain this behavior we focus on the range . In this range absorption of a photon into the UZ creates an electron with on a background of a Fermi sea of electrons (left scheme, Fig. 4). On the other hand, when a photon is absorbed the photo-created electron has the same spin as the background 2DEG (right scheme, Fig. 4). Hence, the two measurements represent different relations between the spin orientation of the photo-excited and the background electrons, one of counter-polarization () and one of co-polarization ().
In his first paper on the subject, Mahan Mahan67a considered the screening of the electron-hole interaction by the Fermi sea of electrons and predicted that an excitonic state is formed in the absorption process, with a binding energy /, where . This so-called ”Mahan exciton” was predicted to appear in the optical absorption spectrum at an energy h . The calculation included the sum of ladder diagrams representing the scattering of the electron by the (screened) hole potential. In a subsequent paper Mahan67b , published shortly after, the analysis was extended to include crossed-diagrams, which describe processes in which the electron hole interaction is mediated by electron-electron scattering. It was found that the bound state no longer exists. Rather, the absorption spectrum has a power law singularity at the Fermi energy. The notion of the Mahan exciton was therefore widely considered as erroneous, ”resulting from an incomplete analysis. We argue that Mahan’s first analysis Mahan67a is applicable when the photo-excited electron spin is opposite to the 2DEG polarization. The crossed-diagrams, which describe virtual processes in which the optically excited electron is exchanged with an electron from the 2DEG having the same spin, are forbidden. In the second case of co-polarization, the crossed-diagrams are allowed and should be included, and we get back to the classical description of the FES. We therefore suggest that in a absorption we create a Mahan exciton, which has a stronger oscillator strength than the FES.
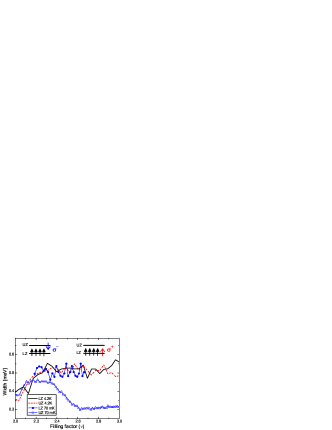
Experimental support for this argument comes from analysis of the width of the absorption lines in the two processes. Figure 4 compares the full width at half maximum of the and lines in the filling factor range at high and low temperature. We find that at K the width of the two lines is identical: Both exhibit a slight rise of the width with increasing , and then remain constant at a value of meV. The behavior at mK is radically different: While the width of the line follows the same behavior as at K, the width of the line drops to meV, almost half of the width. The fact that this narrowing of the peak occurs only at low temperatures, oppositely to the behavior of the peak, proves that it is related to the electron’s spin polarization, rather than to an intrinsic difference between the properties of the UZ and LZ levels. The accumulated evidence, of a narrower and stronger peak, are consistent with an excitonic resonance.
This work was supported by the Binational Science Foundation. We wish to acknowledge Wiktor Maslana for his help in obtaining the data of Fig. 1, and Alexander Finkel′stein for fruitful discussions. The work at Columbia University is supported the National Science Foundation under Award Number DMR-03-52738, the Department of Energy under award DE-AIO2-04ER46133, the Nanoscale Science and Engineering Initiative of the National Science Foundation under NSF Award Numbers CHE-0117752 and CHE-0641523, and by the New York State Office of Science, Technology and Academic Research (NYSTAR), and by a research grant of the W.M. Keck Foundation.
References
- (1) G. D. Mahan, Phys. Rev., 153,882 (1967).
- (2) G. D. Mahan, Phys. Rev. , 163,612 (1967).
- (3) P. Noziéres and C. T. de Dominicis, Phys. Rev. 178, 1097 (1969).
- (4) M. Combescot and P. Noziéres, J. Phys. (France) 32, 913 (1971).
- (5) A. E. Ruckenstein and S. Schmitt - Rink, Phys. Rev. B 35, 7551 (1987).
- (6) T. Uenoyama and L. J. Sham, Phys. Rev. Lett. 65,1048 (1990)
- (7) P. Hawrylak, Phys. Rev. B 44, 3821 (1991).
- (8) H. Westfahl et al., Phys. Rev. Lett. 80, 2953 (1998).
- (9) M. S. Skolnick et al., Phys. Rev. Lett. 58, 2130 (1987).
- (10) H. Kalt et al., Phys. Rev. B 40, R12017 (1987).
- (11) J. S. Lee, Y. Iwasa and N. Miura, Semicond. Sci. Technol. 2, 675 (1987).
- (12) S. A. Brown et al., Phys. Rev. B 54, R11082 (1996).
- (13) V. Huard et al., Phys. Rev. Lett. 84, 187 (2000).
- (14) G. Yusa, H. Shtrikman and I. Bar-Joseph, Phys. Rev. B 62,15390 (2000).
- (15) D.-S. Kim et al., Phys. Rev. Lett. 68, 2838 (1992).
- (16) S. Bar-Ad et al. Phys. Rev. Lett. 72, 776 (1994).
- (17) I. Brener, W. H. Knox and W. Schäefer, Phys. Rev. B 51, R2005 (1995).
- (18) W. Chen et al., Phys. Rev. B. 45, 8464 (1992).
- (19) J. Rubio et al., Phys. Rev. B 55, 16390 (1997).
- (20) A. K. Geim et al., Phys. Rev. Lett. 72, 2061 (1994).
- (21) X. L. Zheng et al., Appl. Phys. Lett. 52, 287 (1988).
- (22) J.G. Groshaus et al., Phys. Rev. Lett. 93, 96802 (2004).