Ultrafast Critical Dynamics of Ferroelectric Phase Transition in Pb1-xGexTe
Abstract
Transient responses of the electronic excitation and coherent soft phonon are investigated both above and below the ferroelectric phase transition temperature Tc in Pb1-xGexTe by using an optical pump-probe technique. The coherent soft mode shows large red-shift and heavily over-damped decay as the temperature approaching Tc from the low temperature side and the soft mode disappears above Tc. The transient electronic response exhibits an abrupt change across Tc. The critical behaviors of both the phononic and electronic dynamics are interpreted by the ferroelectric phase transition.
pacs:
78.47.+p, 77.80.Bh, 63.20.Kr, 64.70.KbUntil now optical rewritable memory media commonly used in commercial disks is Ge2Sb2Te3 (GST) system,Kolobov04 in which the laser-induced phase change between crystalline and amorphous phases predominates the recording process. The rapid phase transition time in GST was found to be several nanoseconds range. On the other hands, utilizing the reversal of ferroelectric domains by ultrashort optical pulses, optical data storage or optical switching with time scale of less than 10 picoseconds has been proposed.Fahy94 In this optical switch, one may switch the orientation of ferroelectric domains within a few phonon periods in time using femtosecond laser excitation, where the phonon displacement reaches a critical displacement of an order of 1% of the inter-atomic distance.Decamp01 ; Hase02
Ferroelectric structural phase transition has been extensively investigated by monitoring the soft mode, i.e., the lowest frequency transverse optical (TO) phonon, whose zone center frequency is drastically reduced toward zero near the critical point Tc.Brinc74 ; Scott74 By using frequency domain techniques, such as Raman and neutron scattering, temperature dependence of has been examined,Scott74 although the observation of the soft mode near Tc is very difficult because of the extremely low frequency and broad linewidth of the soft mode.
Motivated by the observation of real-time dynamics of ferroelectric phase transitions, a few researches have examined femtosecond pump-probe measurements of the coherent soft modes in order-disorder type perovskites, such as KNbO3Dougherty92 and SrTiO3,Kohmoto06 and in displacive type ferroelectric semiconductor GeTe.Hase03 The generation mechanism of the coherent soft mode in perovskites was considered to be non-resonant impulsive stimulated Raman scattering (NR-ISRS),Dougherty92 while in optically absorbing media, like GeTe, the coherent phonon can be generated by resonant impulsive stimulated Raman scattering (R-ISRS),Stevens02 which is recognized to be the general case of the displacive excitation of coherent phonons (DECP) mechanism.Zeiger92 Note that those pump-probe measurements were not done at the higher temperature than Tc because the soft mode becomes Raman inactive due to the symmetry changes and thus it will disappear at T Tc.
Femtosecond pump-probe reflectivity technique has also been applied to observing coherent phonon dynamics in GST film by Först et al.Forst00 They observed drastic changes of the coherent optical phonon properties across the phase transition temperatures, and concluded that there was a metastable phase between the crystalline and amorphous phases. Until now, however, the time-domain study of the soft mode and electronic transient responses associated with the ferroelectric phase transition at the temperatures both above and below Tc is still missing.
In this paper, we investigate both the coherent soft phonon and transient electronic response in Pb1-xGexTe (PGT) utilizing a femtosecond optical pump-probe technique in a wide range of the lattice temperature. The ferroelectric material PGT is a narrow band-gap semiconductor (Eg0.3 eV) with a high carrier mobility and is useful for infrared laser and detectors.Suski82 It exhibits structural phase change from rhombohedrally-distorted structure below Tc to cubic rocksalt structure above Tc, and Tc depends on the composition , promising that one can control Tc by changing .Murase79 ; Hager86 ; Teraoka82 The spectroscopic measurements revealed that the band-gap energy in PGT is very sensitive to the ferroelectric phase transition,Teraoka82 suggesting that ultrafast dynamics of photogenerated carriers exhibit significant changes across Tc.
The time-resolved reflectivity measurement was performed on a single crystal of Pb1-xGexTe ( = 0.07) obtained by Bridgman method. At this composition , Tc is expected to be 160170 K.Hager86 In PGT the TO phonons ( and symmetries) are soft modes, whose displacement is along the cubic (111) direction (A1 mode) and is perpendicular to the cubic (111) direction ( mode), and those modes are responsible for the phase transition.Murase79 The light source used was a mode-locked Ti:sapphire laser amplified with a center wavelength of 800 nm (1.55 eV) and a pulse duration of 150 fs. The pump and probe beams were focused on the sample to a diameter of 70 m and the pump fluence (Fp) was reduced to below 0.1 mJ/cm2 to prevent heating the sample. The probe fluence was fixed at 0.02 mJ/cm2. The transient isotropic reflectivity change () was recorded to observe the coherent A1 mode as a function of the time delay at the lattice temperature (Tl) from 8 to 200 K.
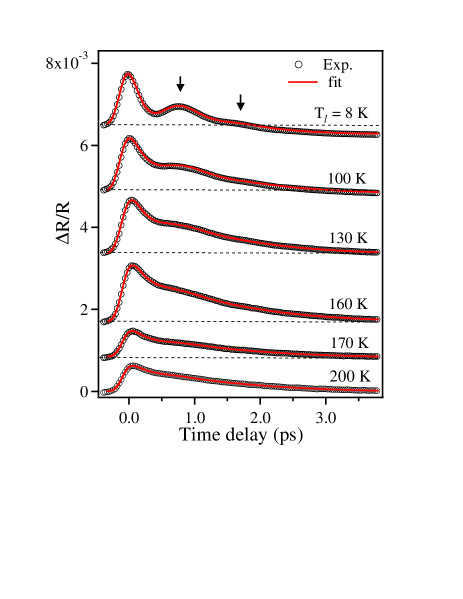
Figure 1 shows the signal observed at various Tl from 8 to 200 K at the constant fluence of Fp = 0.1 mJ/cm2. The fast transient signal arising from the negative time delay represents linear electronic response with a few picoseconds relaxation time,Note1 whereas the adjacent dip and the following coherent oscillation (indicated by arrows in Fig. 1.) is the contribution from the coherent lattice vibration. The frequency of the coherent lattice vibration is 1.0 THz (= 33 cm-1) at 8 K. The Raman measurements showed that the peak frequency of the A1 mode in Pb1-xGexTe with the different composition of = 0.05 was 23 cm-1.Murase79 The larger Ge composition of our sample ( = 0.07) would result in higher frequency of the A1 mode,Hager86 and in addition, we are using conventional isotropic reflectivity technique which dominates totally symmetric A1 mode rather than the E mode.Dekorsy95 Therefore, this coherent oscillation corresponds to the soft A1 mode. It should be emphasized that the fast electronic transient drastically changes: the transient electronic amplitude suddenly decreases around 170 K as shown in Fig. 1. These features imply that the phase transition occurs between 160 and 170 K, and this value is quite close to the Tc value reported by Raman scattering at the same Ge composition.Hager86
In order to subtract the transient electronic response from the time-domain data and to obtain only coherent soft phonon, we utilizes the following function to fit the data,
| (1) |
where, H(t) is the Heaviside function convoluted with Gaussian to account for the finite time resolution. A1 and A2 are the amplitudes, and and are the relaxation time of the fast and slow electronic responses, respectively.Note2 B, , and are respectively the amplitude, damping rate, frequency, and initial phase of the underdamped soft A1 phonon. As shown in Fig. 1, Eq. (1) fits the data very well at all Tl.
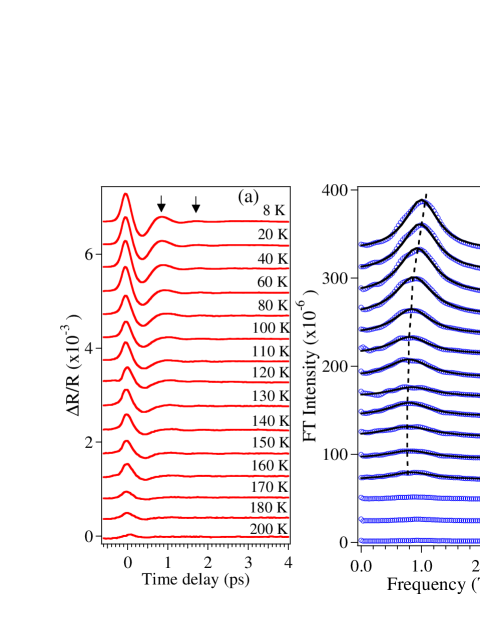
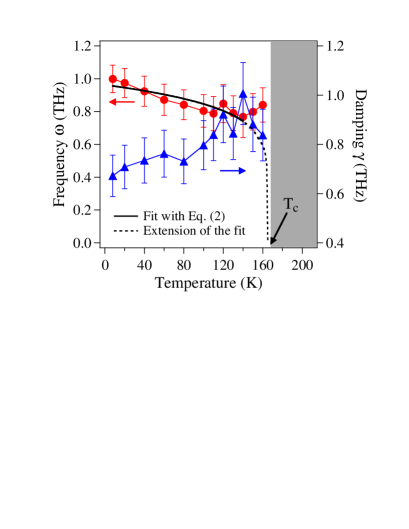
Figure 2(a) shows the oscillatory part of the changes of the reflectivity, which is obtained by extracting the exponential decay term from the above fitting at various Tl from 8 to 200 K at the constant Fp = 0.1 mJ/cm2. With increasing the Tl, the coherent A1 oscillation becomes weaker and almost vanishes at Tl 170 K. This is explained by the fact that the A1 mode is the soft mode, whose frequency reduces toward zero and damping becomes larger; we can detect only monocycle oscillation (the second cycle is rather weak ) below Tc (= 160 170 K). Figure 2(b) represents the Fourier transformed (FT) spectra obtained from the time-domain data in (a). In Fig. 2(b), at Tl = 170 K, the A1 mode almost disappears, supporting the idea that Tc is 160 170 K. The FT spectra show the decrease in the peak frequency and the broadening of the linewidth of the coherent A1 mode (this corresponds to the damping rate ) as Tl increases as shown in Fig. 3. The frequency gradually decreases with increasing Tl, while the damping increases until Tl 140 K. The broadening of the linewidth of the coherent phonon spectra with Tl is explained by the enhanced anharmonic phonon-phonon coupling between the soft optical phonon and acoustic phonons,Menendez84 as observed in Bi.Hase98 The Tl-dependence of just below Tc significantly deviates from the Landau’s mean field theoryLandau37 ;
| (2) |
which describes the second-order phase transition, where, amplitude and exponent are the fitting parameters. As a result of the best fitting using the data at Tl 140 K, = 0.47 and are obtained for the fixed value of Tc = 165 K. The deviation of the experimental from the Landau theory near Tc suggests that the ferroelectric phase transition in PGT may be a mixture of the first-order and the second-order characters in the critical region due to the very large fluctuation amplitudes of the atoms.Muller71
In figure 4, the amplitudes of the electronic transient and that of the coherent A1 mode are plotted as a function of Tl in order to discuss more details of the drastic change of the electronic transient as observed in Fig. 1.Note3 At Tl 165 K the electronic amplitude () decreases from 1.210-3 to 0.610-3, which corresponding to 50 % huge relative change. Since this huge change in occurs at the same temperature of the expected Tc value, we interpret the drastic change in the fast electronic transient in terms of the result of ferroelectric phase transition. On the other hand, the A1 mode amplitude () gradually decreases with Tl, and becomes almost zero at Tl = 170 K, being consistent with the ferroelectric character that the intensity of the soft mode becomes weak due to strong damping below Tc and it vanishes due to the symmetry change at Tl Tc.Scott74
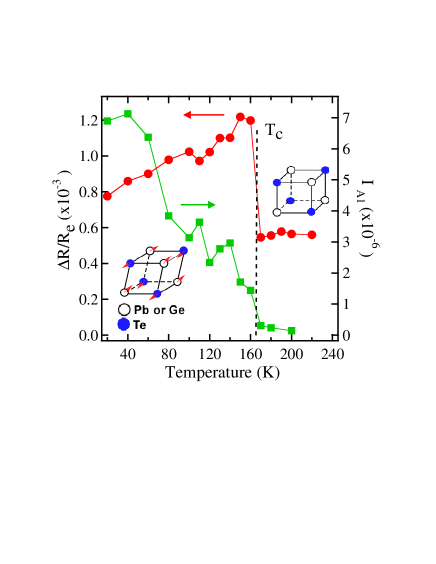
The structural phase transition from ferroelectric phase (TlTc) to paraelectric phase (TlTc) accompanies displacement of the ions in the unit cell and modifies the ionic polarization: the spontaneous polarization below Tc in the ferroelectric phase is large, while that above Tc in the paraelectric phase vanishes.Brinc74 This ferroelectric phase transition then induces the changes in the electronic band structures,Teraoka82 including the position of the acceptor levels.Benguigui96 Based on the above considerations, possible origins for the drastic change in are considered as follows. First, the change in the electronic band structures would result in the change in the band-gap via deformation potential (or more possibly piezoelectric effect due to spontaneous polarization) and also the change in the carrier mobility due to the electron-phonon interaction.Yu99 These effects would change the interband optical absorption coefficient, and thus may change the electronic response . Second, the change in the position of the acceptor levels affects the free carrier concentration,Benguigui96 and this effect will result in the modification of the free carrier absorption, which contributes to the electronic response . By using the huge change in the electronic transient across Tc, optical switching or optical memory using PGT can be proposed. In this case, photo-induced phase transition between ferroelectric and paraelectric phases is required. Such the photo-induced phase transition will be realized if one could precisely control both the amplitudeHase96 ; Iwai06 and the frequencyHase03 of the coherent soft phonon.
In summary, we have investigated ultrafast dynamics of both the coherent soft mode and the transient electronic polarization in ferroelectric semiconductor below and above Tc by using the pump-probe technique. Low frequency coherent soft mode in PGT was observed only below Tc, showing the red-shift of the frequency and heavily over-damped behavior as the temperature approaches Tc. The drastic decrease in the transient electronic response was revealed across Tc, suggesting the change in the electronic band structure, including the position of the acceptor levels.
The authors acknowledge J. Demsar and O. V. Misochko for helpful comments. This work was supported in part by a Grant-in-Aid for the Scientific Research from MEXT of Japan under grant KAKENHI -16032218, and by Iketani Science Technology Foundation of Japan.
References
- (1) A. V. Kolobov, P. Fons, A. I. Frenkel, A. L. Ankudinov, J. Tominaga, and T. Uruga, Nature Materials 3, 703 (2004).
- (2) S. Fahy and R. Merlin, Phys. Rev. Lett 73, 1122 (1994).
- (3) M. F. DeCamp, D. A. Reis, P. H. Bucksbaum, and R. Merlin, Phys. Rev. B 64, 092301 (2001).
- (4) M. Hase, M. Kitajima, S. I. Nakashima, and K. Mizoguchi, Phys. Rev. Lett. 88, 067401 (2002).
- (5) R. Brinc and B Zeks, in Soft modes in Ferroelectrics and Antiferroelectrics, (North-Holland, Amsterdam, 1974).
- (6) J. F. Scott, Rev. of Mod. Phys. 46, 83 (1974).
- (7) T. P. Dougherty, G. P. Wiederrecht, K. A. Nelson, M. H. Garrett, H. P. Jenssen, and C. Warde, Science 258, 770 (1992); Phys. Rev. B 50, 8996 (1994).
- (8) T. Kohmoto, K. Tada, T. Moriyasu, and Y. Fukuda, Phys. Rev. B 74, 064303 (2006).
- (9) M. Hase, M. Kitajima, S. Nakashima, and K. Mizoguchi, Appl. Phys. Lett. 83, 4921 (2003).
- (10) T. E. Stevens, J. Kuhl, and R. Merlin, Phys. Rev. B 65, 144304 (2002).
- (11) H. J. Zeiger, J. Vidal, T. K. Cheng, E. P. Ippen, G. Dresselhaus, and M. S. Dresselhaus, Phys. Rev. B 45, 768 (1992).
- (12) M. Först, T. Dekorsy, C. Trappe, M. Laurenzis, H. Kurz, and B. Béchevet, Appl. Phys. Lett. 77, 1964 (2000).
- (13) T. Suski, M. Baj, and K. Murase, J. Phys. C: Solid State Phys. 15, L377 (1982).
- (14) K. Murase and S. Sugai, Solid State Commun. 32, 89 (1979).
- (15) T. H. -Hager, G. Bauer and J. Brandmüller, J. Phys. C: Solid State Phys. 19, 2153 (1986).
- (16) S. Teraoka and K. Murase, J. Phys. Soc. Jpn, 51, 1857 (1982).
- (17) The possible origins of the transient electronic response are interband transition above the band-gap, and free carrier absorption in the valence bands [Pb1-xGexTe (= 0.07) is considered to be p-typeTeraoka82 ].
- (18) T. Dekorsy, H. Auer, C. Waschke, H. J. Bakker, H. G. Roskos, H. Kurz, V. Wagner, and P. Grosse, Phys. Rev. Lett. 74, 738 (1995).
- (19) The double exponential decay function in Eq. 1 is merely a matter of preference to subtract the electronic background and is not associated with some underlying relaxation mechanisms.
- (20) J. Menendez and M. Cardona, Phys. Rev. B 29, 2051 (1984).
- (21) M. Hase, K. Mizoguchi, H. Harima, S. I. Nakashima, and K. Sakai, Phys. Rev. B 58, 5448 (1998).
- (22) Landau, Phys. Z. Sowjetunion 11, 26 (1937).
- (23) K. A. Müller and W. Beringer, Phys. Rev. Lett. 26, 13 (1971).
- (24) We plot the amplitude of the electronic response by reading the maximum amplitude of (t) = plotted by using the fitting parameters.
- (25) L. Benguigui, R. Weil, A. Chack, E. Muranevich, and R. Nkum, Solid State Commun. 99, 619 (1996).
- (26) P. Y. Yu and M. Cardona, Chap. 3 in Fundamentals of Semiconductors, (Springer-Verlag, Berlin Heidelberg 1999).
- (27) M. Hase, K. Mizoguchi, H. Harima, S. Nakashima, M. Tani, K. Sakai, and M. Hangyo, Appl. Phys. Lett. 69, 2474 (1996).
- (28) S. Iwai, Y. Ishige, S. Tanaka, Y. Okimoto, Y. Tokura, and H. Okamoto, Phys. Rev. Lett. 96, 057403 (2006).