Island coarsening in one-dimensional models with partially and completely reversible aggregation
Abstract
Using computer simulations and scaling ideas, we study one-dimensional models of diffusion, aggregation and detachment of particles from islands in the post-deposition regime, i. e. without flux. The diffusion of isolated particles takes place with unit rate, aggregation occurs immediately upon contact with another particle or island, and detachment from an island occurs with rate , where is the related energy barrier. In the partially reversible model, dissociation is limited to islands of size larger than a critical value , while in the completely reversible model there is no restriction to that process (infinite ). Extending previous simulation results for the completely reversible case, we observe that a peaked island size distribution in the intermediate time regime, in which the mean island size is increasing, crosses over to the theoretically predicted exponentially decreasing distribution at long times. It contrasts with the partially reversible model, in which peaked distributions are obtained until the long time frozen state, which is attained with a crossover time . The mean island size at saturation varies as ( constant), while the completely reversible case shows an Ahrrenius dependence of the mean island size, . Thus, for different coverages, the effect of the critical size on the geometric features is much stronger than that of , which may be used to infer the relevance of size-dependent detachment rates in real systems and other models.
pacs:
68.43.Jk, 81.10.Aj, 68.55.AcI Introduction
The early stages of formation of a thin film (submonolayer regime) is dominated by the deposition and diffusion of adatoms and the formation and growth of islands, through nucleation, coalescence and capture of new adatoms. This problem has long been of fundamental and technological interest Venables because those processes also have a strong influence on the later stages of growth. More recently, this interest increased for the possibility of formation of novel nano-structures.
Systems where diffusion-mediated nucleation of islands competes with deposition of particles have been extensively studied both experimentally and theoretically Evans2006 ; Metois79 ; Brune98 . From the theoretical point of view, island formation (in one and two dimensions) has mainly been treated using scaling theories, rate equations and simulations. The models of deposition, diffusion and aggregation may be separated in three groups according to the conditions for the islands stability: models with completely irreversible aggregation BarteltEvans96 ; AmarFamilyLam ; Popescu01 , with completely reversible aggregation Ratsch94 ; BalesZangwill97 , or those which assume the existence of a critical island size , above which islands are stable against dissociation Venables ; AmarFamily95 ; Kandel97 . The critical island size is usually expected to represent thermal effects and the substrate geometry; for instance, corresponds to stable trimers in a triangular lattice and to stable tetramers in a square lattice AmarFamily95 . Other mechanisms that make island growth to be size-dependent may also justify such conditions.
Another important problem is the nucleation and growth of islands in the post-deposition regime, i. e. after the particle flux has stopped. Diffusion and nucleation in this regime are observed in several experiments Rosenfeld93 ; Mueller96 ; Evans2003 . One possible situation is growth at low enough temperatures so that adatom diffusion is negligible during deposition, but with adatom rearrangement into islands occurring during a much longer time interval after the flux has been shut off Mueller96 ; Evans2003 . This is certainly relevant for technological applications in which a system needs to have its properties preserved for long times. Other possible situation is that in which the sample is annealed Himpsel2001 . For the case of completely irreversible aggregation (), the post-deposition regime was studied in one and two dimensions by several authors Lam99 ; Tataru00 ; Ammi . The case was also considered in two-dimensions by Tataru et al Tataru00 . Only for a point island model Li1997 , the case of partially reversible aggregation in a one-dimensional substrate has been treated in the post-deposition regime for several values of the critical size (, and ). On the other hand, but also in one dimension, this post-deposition regime has been studied for completely reversible aggregation with an extended island model ReisSt2004 .
In this work, we consider one-dimensional models with critical size for islands coarsening in the post-deposition regime, focusing on the differences from the completely reversible situation (), whose results from previous works are extended. First, the particles are randomly deposited on a one-dimensional lattice, and diffusion, aggregation and detachment mechanisms subsequently take place. Diffusion of isolated particles occurs with rate (probability to move to each neighboring empty site), aggregation of a free particle immediately takes place upon contact with another particle or cluster, and detachment occurs with rate if the cluster size does not exceed the critical size (Fig. 1b). The unit rate for hopping of isolated particles defines the time scale of the problem, and the detachment rate is of order , where E is an energy barrier for dissociation. The time evolution of island size will be analyzed for different detachment rates, coverages and critical sizes, and the island size distributions in different regimes will be obtained. One of our aims is to know how suitable is the approximation of finite critical size to describe the island coarsening without particle flux in different time regimes.
At first sight, the restricted dimensionality considered here seem to have limited interest, but there are experimentally important cases of aggregate confinement, such as nucleation processes occurring along surface steps Himpsel2001 ; Gambardella2000 ; Gai2002 . Moreover, some experiments show atoms diffusing along steps without detaching from them at room temperature Giesen2001 , the formation of one-dimensional nano-structures on patterned substrates Nguyen ; Notzel and the formation of single-atom-wide metal rows due to inhibition of aggregation at their sides albao . Consequently, exploring nontrivial differences between these relatively simple models may be important for comparison with experimental data, as well as to design more complex models. This is illustrated, for instance, in recent work on two-dimensional irreversible island growth politi . For these reasons, we will perform a careful quantitative analysis of the island properties and the time scales in the models presented here.
The rest of this work is organized as follows. In Sec. 2 we present a brief review of previous results for the fully reversible model and simulation data for the island size distribution, whose shape shows significant changes in time. In Sec. 3 we discuss our results for the model with partially reversible aggregation. In Sec. 4 we summarize our results and present our conclusions.

II The completely reversible model
For the completely reversible model in the post-deposition regime ReisSt2004 , the particles are randomly deposited on a one-dimensional substrate at and immediately begin to diffuse according to the conditions of Fig. 1a, but with no restriction to detach from an island ().
The coarsening in this system was shown to be separated in three main regimes ReisSt2004 : (i) early fast attachment of isolated particles to each other; (ii) an intermediate regime in which detachment sets in, the mean island size increasing as
| (1) |
in the limit of small ; (iii) a slow (diffusive) evolution of the average cluster size as
| (2) |
where
| (3) |
for small . This last regime is diffusion-limited in the sense that the distances between clusters are still large so that a detached particle probably returns and reattaches many times before effectively diffuse to the nearest cluster. Actually this system does not attain neither an equilibrium nor a steady state. The behavior in regime (iii) and the corresponding island size distribution were predicted by a solution of the master equation in an independent interval approximation, while the behevior in regime (ii) was derived using scaling arguments ReisSt2004 .
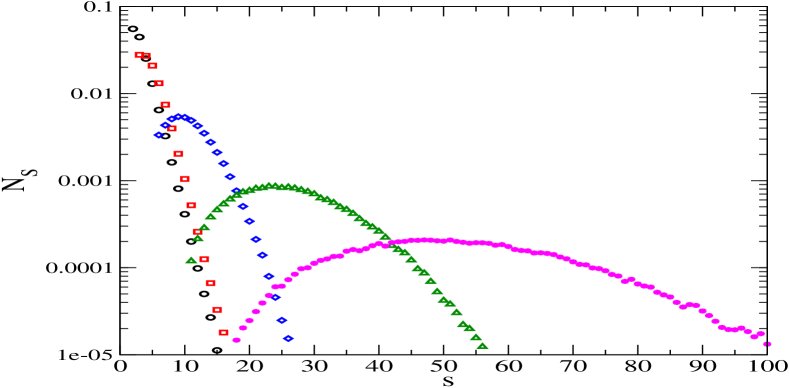
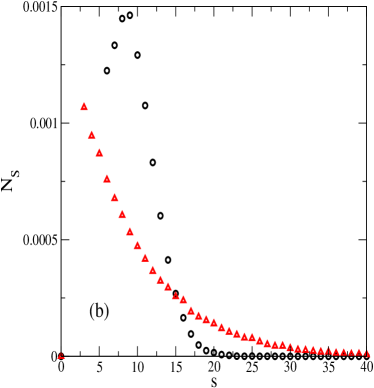
Extending previous kinetic Monte Carlo simulation, we confirmed the theoretically predicted island size distribution in the asymptotic state [regime (iii)] ReisSt2004 :
| (4) |
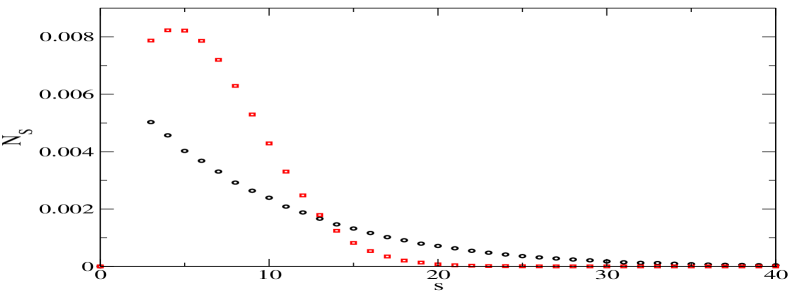
where is the island size and is the average size for coverage . This exponentially decreasing distribution is shown in Fig. 2 for and , at a sufficiently long time where the average cluster size is ( in this case). However, the distribution at early times [regime (ii)] shows a peak at a certain typical size , as illustrated in Fig. 2 for the same model parameters and . This new result was not predicted by the analytical solution which explained regime (iii). On the other hand, it is probably the reason for the successful derivation of Eq. (1) with a scaling approach that assumed the existence of a typical cluster size in the system in regime (ii). This assumption fails in the case of a very large number of small clusters, such as the asymptotic limit (iii).
The crossover from regime (ii) to regime (iii) is expected to take place at times of the order , which can be obtained by matching the typical sizes in Eqs. (1) and (3). The above results show that this is the expected time for a crossover from a peaked island size distribution to a monotonically decreasing one. This difference may be important for comparisons with experimental data and, as will be shown below, for a test of the reliability of the assumption of a critical island size.
At this point, the comparison with results for reversible models where deposition competes with aggregation is also important. Without accounting for the post-deposition behavior, peaked distributions are observed in several conditions Ratsch94 . Moreover, they were also obtained by Lam and co-workers Lam99 in the post-deposition regime, although a systematic search for an asymptotic regime was not performed there. Since this type of distribution is obtained in regime (ii) of our model, one naturally raises the question whether such crossover is also present in two dimensions. On the other hand, monotonically decreasing size distributions of one-dimensional islands were obtained in Ref. albao , and were explained by a highly anisotropic model of diffusion and completely irreversible aggregation () in a square lattice.
In models with conserved density, it is interesting to mention the case of Ref. girardi , in which increasing the concentration of amphiphiles leads to a crossover from monotonically decreasing cluster size distributions to peaked ones. Moreover, depending on the particular spin dynamics, both types of distributions were found with same temperature and concentration.
III The partially reversible model
In this model, after random deposition of a coverage at , diffusion, detachment and re-attachment of particles continue until all islands are stable (size larger than ), following the rules of Fig. 1b. We simulated this model in lattices of length , which are large enough to avoid finite-size effects, with coverages , and . The critical sizes analyzed here range from to and the diffusion rates range from to .
We observed a sequence of four regimes of aggregation in the simulations: (a) fast attachment of isolated particles to each other to form islands (b) an intermediate regime in which detachment sets in, allowing further coarsening, but the size of the islands are typically below , thus with negligible influence of the critical size; (c) a crossover region, which begins when a large quantity of stable islands are formed; (d) a frozen state where there is no more isolated atoms nor unstable islands. Regimes (a) and (b) are equivalent to regimes (i) and (ii) of the completely reversible model, which is justified by simulation results.
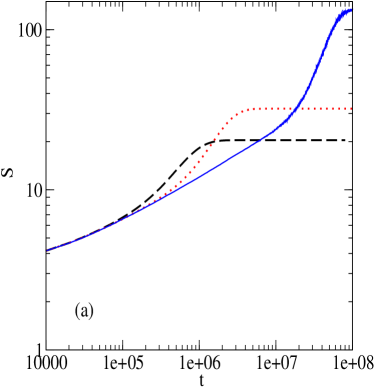
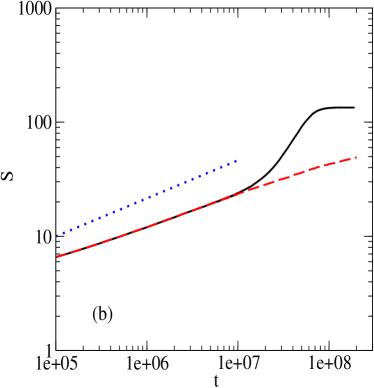
In all cases, the mean size increases in time and attains a saturated value that increases with , for fixed and . This is illustrated in Fig. 3a, where we compare the time evolution of for , and , with . In Fig. 3b we compare the result for with that for the completely reversible model with the same .
The results of Fig. 3a show that small values of have drastic effects at intermediate times. Due to the stability of small clusters, the mean size increases much earlier and exceeds the mean size for large values of . For instance, for is larger than for in a time interval which extends for more than one decade in . The very slow growth in regime (b) [or (ii) in the completely reversible case] contributes to this effect. Consequently, the short-time behavior of does not reveal the true asymptotics ( increasing with ) in cases where the critical size is a realistic assumption.
These results are related to the fact that the intermediate regime (b) is clear only for relatively large , otherwise the crossover to saturation takes place immediately after formation of small islands. Moreover, an increase of the mean cluster size similar to the fully reversible model [Eq. 1, regime (ii)] is observed only for very small , typically . This illustrated in Fig. 3b, where we show a line with slope , which is nearly parallel to the data for both models in that regime.
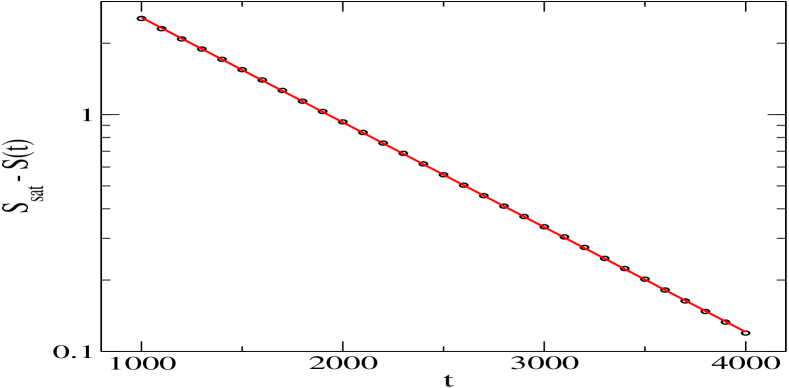
Contrary to the long time diffusive behavior of the completely reversible model (Eq. 2), in the present case the crossover to the frozen state, regime (c), shows the expected exponential decay to a saturation value, as
| (5) |
This is illustrated in Fig. 4 for , and . Smaller values of show much longer and well defined convergences to the saturation sizes.
For fixed , the mean island size in the frozen state, , increases approximately as
| (6) |
typically with small , which corresponds to a very weak dependence on in the low temperature regime. This is illustrated in Fig. 5, where we show versus for and different values of the coverage . Except for coverages very near , the saturation value for low temperatures () is nearly ; for instance, in Fig. 5 for and . This expected proportionality between and is also observed for larger values of i.
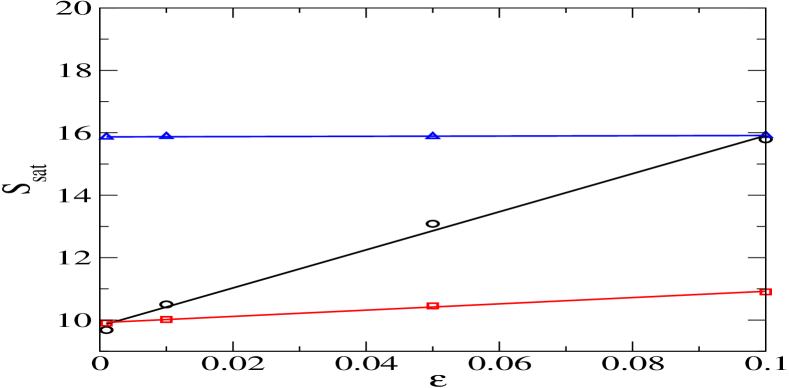
This result contrasts to the remarkable dependence of the mean island size on for the completely reversible case [regime (iii), Eq. 3]. Here, the critical island size is the main parameter to determine the features of the system in the saturation regime, while has an important role in determining the time scale of the problem. It is also the parameter which is the more closely connected to other geometric features, such as size distributions (discussed below).
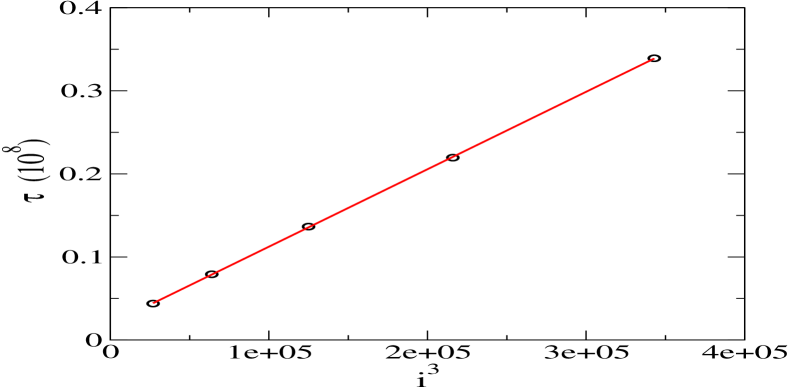
The crossover time in Eq. (5) can be estimated from the previously discussed features of both models. First recall that Eq. (1) governs the time evolution of the mean island size in intermediate times when both models have similar features (small , large ). On the other hand, at the crossover time , this size must match the saturation value for the present model ( is certainly intuitive). Thus we obtain
| (7) |
The result is expected because the detachment rate defines the time scale of the model; it is confirmed by simulation for small with good accuracy. However, much more interesting is the nontrivial dependence of on . In Fig. 6, it is confirmed by simulation with large values of ( to ), for and . Notice that, despite the small range of values of , varies by a factor larger than in Fig. 6. This scaling certainly requires relatively large values of and small to be observed. On the other hand, this analysis reinforces the conclusion that the intermediate time regime of this model, regime (b), has negligible differences from the model with completely reversible aggregation.
The final distribution of island sizes (frozen state) has a pronounced peak for small , due to the stability of small clusters that stop feeding the largest ones at early times. As expected, the distribution becomes larger when increases, as illustrated in Fig. 7. For fixed and , the distribution becomes narrower for smaller .
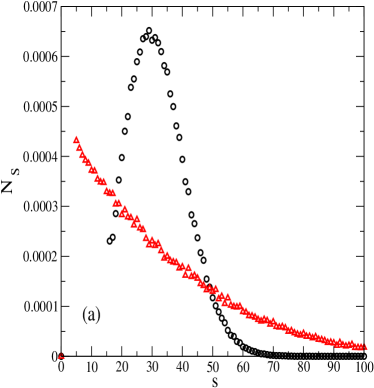
In order to illustrate the remarkable difference from the fully reversible model at long times, we compared the island size distributions for the same and , using . For instance, for and very small we obtain , and the same value for is obtained in the fully reversible model with . The distributions of both models are compared in Fig. 8a, with the same value of and for the model with critical size. The same comparison is also performed in Fig. 8b for , , and , where in both models. Thus, from the shape of the size distribution at very long times, we are able to test the reliability of each model for a given system.
IV Conclusion
We studied island coarsening in the post-deposition regime in one-dimensional models with completely and with partially reversible aggregation, the latter with critical size . Extending previous work on the fully reversible case, here we showed that the island size distributions are very different in the regime of island coarsening and in the long time limit, crossing over from a peaked distribution to an exponentially decreasing one. For the model with critical size , we systematically studied the influence of this parameter, the detachment rate and the coverage on the mean island size and the island size distribution . Contrary to the long time diffusive increase of the average island size in the fully reversible model, for the partially reversible model the crossover to a frozen state shows an exponential decay to the saturation value, with crossover time , a relation which follows from the fact that, at intermediate times, both models show the same coarsening. For fixed , the mean island size in the frozen state has a very weak dependence on , in contrast to the completely reversible model, where it varies as . Another particularly interesting result is that the peaked island size distribution at intermediate times for both models crosses over to a long time exponentially decreasing distribution only for the completely reversible model.
We believe that some of these features may motivate comparisons with real systems with effective one-dimensional behavior (see e. g. the recent discussion in Ref. phillips . For instance, the completely reversible model predicts an Ahrrenius temperature dependence of the mean island size (Eq. 3 with ) in the long time limit, i. e., when that size does not show significant time increase. Deviation from this dependence may suggest some size-dependence of detachment rates, and would eventually justify the assumption of a critical island size or another restriction to the growth of large islands for modeling the island coarsening. Moreover, peaked island size distributions may indicate deviations from the long time conditions of the completely reversible model, which may be interpreted as a finite-time behavior [regime (ii) of the same model] or as an effect of size-dependent detachment rates.
There are also many recent examples in which the solution of simple statistical models in one-dimension anticipate features of the more realistic two- or three-dimensional systems, such as non-equilibrium multilayer growth models sukarno , magnetic systems with rough surfaces noninteger and other aggregation models salazar . Thus, further systematic studies of island coarsening in the post-deposition regime in two dimensions are certainly motivated by the present work.
References
- (1) J.A. Venables , Phys. Rev. B 36 (1987) 4153.
- (2) J.W. Evans, P. A Thiel, M. C. Bartelt, Surface Science Reports 61 (2006) 1- 128.
- (3) R. Kern, G. Le Hay, J.J. Metois, in: E. Kaldis (Ed.), Current Topics in Materials Science, vol. 3, North Holland, Amsterdam ( 1979), pp. 131-420.
- (4) H. Brune, Surf. Sci. Rep. 31, 121 (1998).
- (5) M.C. Bartelt and J.W Evans, Phys. Rev B 54 (1996) R17359.
- (6) J. G. Amar, F. Family, P.-M. Lam, Phys. Rev. B 50 (1994) 8781.
- (7) M.N. Popescu, J. G. Amar and F. Family, Phys. Rev. B 64 (2001) 205404.
- (8) C. Ratsch, A. Zangwill, P. Smilauer and D.D. Vvedensky , Phys. Rev. Lett. 72 (1994) 3194.
- (9) G.S. Bales and A. Zangwill, Phys. Rev. B 55 (1997) R1973.
- (10) J.G Amar and F. Family, Phys. Rev. Lett. 74 (1995) 2066.
- (11) D. Kandel, Phys. Rev. Lett. 78 (1997) 499.
- (12) G. Rosenfeld, R. Servaty, C. Teichert, B. Poelsema, G. Comsa, Phys. Rev. Lett. 71 (1993) 895.
- (13) B. Muller, L. Nedelmann, B. Fischer,H. Brune and K. Kern, Phys. Rev. B 54 (1996) 17858.
- (14) S. Frank, H. Wedler, R.J. Behm, J. Rottler, P. Maass, K.J. Caspersen, C.R. Stoldt, P.A. Thiel, and J. W. Evans, Phys. Rev. B 66 (2002) 155435.
- (15) F.J. Himpsel et al Solid State Communications 117 (2001) 149.
- (16) P.-M. Lam, D. Bayayoko, and X.-Y. Hu, Surf. Sci. 429 (1999) 161.
- (17) O. Tataru, F. Family and J. G. Amar, Phys. Rev. B 62 (2000) 013129.
- (18) H. S. Ammi, A. Chame, M. Touzani, A. Benyoussef, O. Pierre-Louis, C. Misbah, Physical Review E , 71 (2005) 041603.
- (19) J. Li, A.G. Rojo, and L. Sander, Phys.Rev. Lett. 78 (1997) 1747.
- (20) F. D. A. Aarão Reis and R. Stinchcombe, Phys. Rev. E 70 (2004) 036109.
- (21) P. Gambardella, M. Blanc, H. Brune, K. Kuhnke, and K. Kern, Phys. Rev. B 61 (2001) 2254.
- (22) Z. Gai, G. A. Farnan. J. P. Pierce and J. Shen, App. Phys. Lett. 81 (2002) 742.
- (23) M. Giesen, Prog. Surf. Sci. 68 (2001) 1.
- (24) G. Jin, J. L. Liu, S.G. Thomas, Y. H. Luo, K. L. Wang and B. -Y. Nguyen, Appl. Phys. A: Mater. Sci. Process. 70 (2000) 551.
- (25) Q. Gong, R. Notzel,H. -P.Schonherr and K.H. Ploog, Physica E 13 (2002) 1176.
- (26) M. A. Albao, M. M. R. Evans, J. Nogami, D. Zorn, M. S. Gordon and J. W. Evans, Phys. Rev. B 72, 035426 (2005).
- (27) D. Vilone, C. Castellano, and P. Politi, Surf. Sci. 600 (2006) 2392.
- (28) M. Girardi and W. Figueiredo, Phys. Rev. E 62 (2000) 8344.
- (29) J. M. Phillips and J. G. Dash, J. Stat. Phys. 120 (2005) 721.
- (30) S. C. Ferreira Jr. and S. O. Ferreira, Phys. Lett. A 352 (2006) 216.
- (31) F. D. A. Aarão Reis, Phys. Rev. B 62 (2000) 6565.
- (32) R. Salazar and L. D. Gelb, Physica A 356 (2005) 190.