Magnetic field tuning of the low temperature state in YbNiSi3
Abstract
We present detailed, low temperature, magnetoresistance and specific heat data of single crystal YbNiSi3 measured in magnetic field applied along the easy magnetic axis, . An initially antiferromagnetic ground state changes into a field-induced metamagnetic phase at kOe (). On further increase of magnetic field, magnetic order is suppressed at kOe. The functional behaviors of the resistivity and specific heat are discussed in comparison with those of the few other stoichiometric, heavy fermion compounds with established field-induced quantum critical point.
pacs:
72.15.Qm,75.20.Hr,75.30.KzThe ”quantum criticality conundrum” Laughlin et al. (2001) continues to be a focus of attention for many theorists and experimentalists. Stewart (2001, 2006); Coleman et al. (2001); Sachdev (2000); Gegenwart et al. (2003); Continentino (2005); Coleman and Schofield (2005) In the particular case of magnetic intermetallic compounds that manifest heavy fermion ground states, magnetic ordering temperatures can be tuned by some control parameter to , bringing the material to a quantum critical point (QCP). This tuning is possible because of a delicate balance between the Ruderman - Kittel - Kasuya - Yoshida (RKKY) interaction, that defines the magnetic ordering temperature, and the Kondo effect, that causes screening of the magnetic moments and favors non-magnetic ground state.Doniach (1977) Recently, in addition to traditionally used pressure and chemical substitution, magnetic field has also emerged as a potential control parameter,Stewart (2001); Gegenwart et al. (2003) having an advantage of being a continuous and common parameter for a number of experimental techniques. However, the applicability of a single theoretical description for a QCP reached by using different tuning parameters, is still under discussion.
So far the number of stoichiometric materials exhibiting a field-induced QCP is rather small, with only few of them being Yb-based: YbRh2Si2,Gegenwart et al. (2002) YbAgGe,Bud’ko et al. (2004) YbPtIn,Morosan et al. (2006). The release of entropy associated with the magnetic ordering (which can be used as a rough caliper of the sise of the Yb magnetic moment in the ordered state) in the three materials ranges from for YbRh2Si2, to for YbAgGe, to for YbPtIn. Nevertheless the phase diagrams and functional behavior of a number of physical parameters in the vicinity of the field-induced QCP are very similar for all three of these compounds. Recently investigated YbNiSi3,Avila et al. (2004) an orthorhombic, moderately - heavy fermion compound with the Néel temperature, K, Sommerfeld coefficient, mJ/mol K2, and entropy associated with the magnetic ordering , seems to be a suitable candidate for further studies of the possible field-induced quantum criticality in stoichiometric, Yb-based, heavy fermions.
Single crystals of YbNiSi3 were grown from Sn flux (see Ref. Avila et al., 2004 for more details). Flux residue from the surface of the samples was polished or/and etched out to exclude the effect of elemental Sn on measured electrical transport properties. DC magnetization was measured up to 55 kOe and down to 1.8 K in a Quantum Design MPMS-5 SQUID magnetometer. Heat capacity and standard, 4-probe, AC ( Hz) resistivity in zero and applied field up to 140 kOe were measured in a Quantum Design PPMS-14 instrument using a 3He refrigerator with heat capacity and ACT options respectively. In all measurements an external field was applied along easy magnetic axis ().Avila et al. (2004) Resistivity in applied field was measured in a transverse, , configuration.
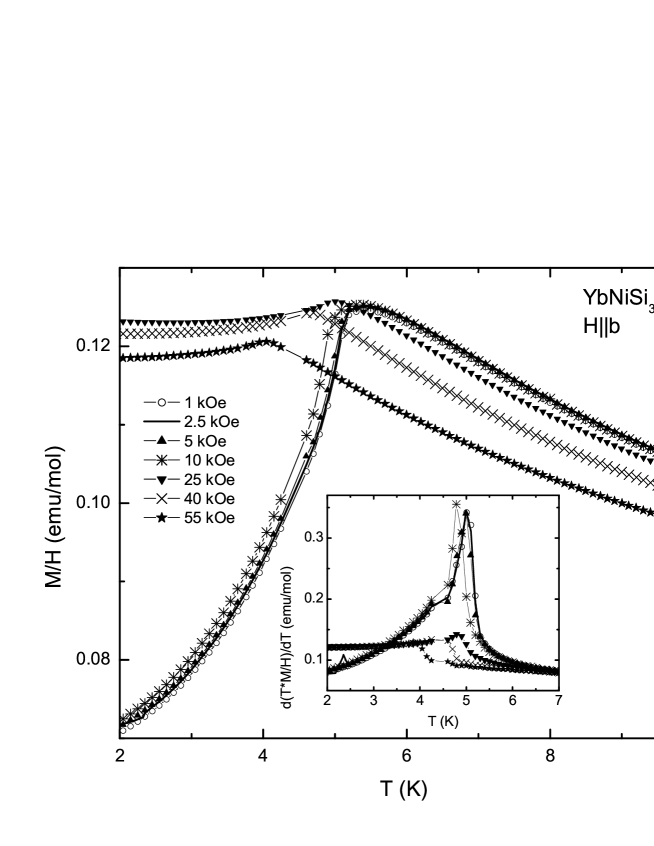
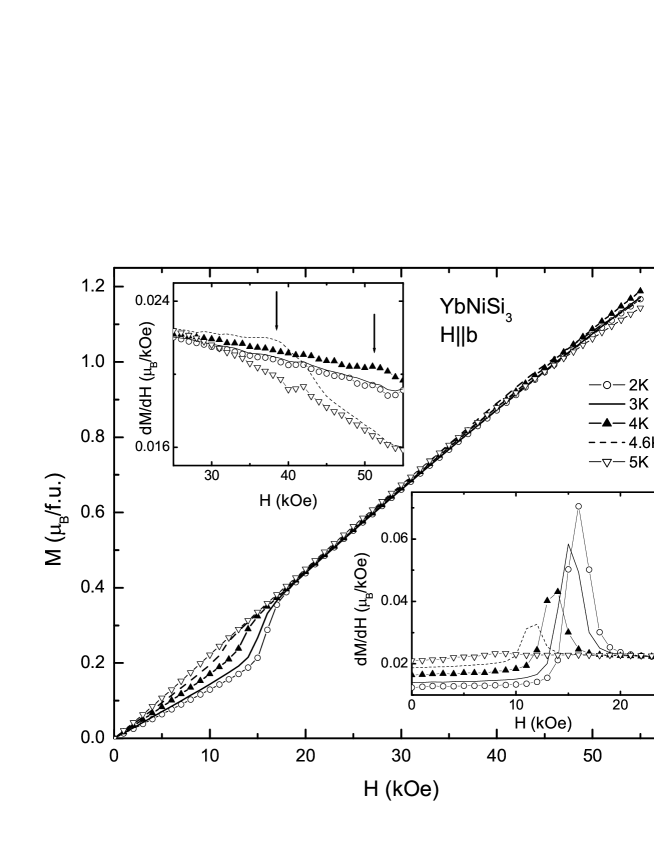
The low field magnetic susceptibility, , measurements and 2 K magnetization, , isotherms are consistent with the data reported in Ref. Avila et al., 2004. The feature associated with the antiferromagnetic transition in (or in )Fisher (1962) shifts to lower temperatures with increase of the magnetic field applied (Fig. 1). The lower field metamagnetic transition (Fig. 2) moves to lower fields with increase of temperature at which the data were taken, at higher temperatures the second feature moves to accessible field range (upper left inset to Fig. 2); this feature corresponds to high field break in slope reported previously Avila et al. (2004).
Field-dependent resistivity isotherms are shown in Fig. 3. Two features (marked with dashed lines), consistent with those seen in aforementioned magnetization () measurements, are easily recognizable and can be monitored in the domain of the experiments. The position of the lower field feature is almost temperature-independent, while the critical field associated with the higher field feature decreases with an increase of temperature.
Representative-temperature dependent resistivity, , curves are shown in Fig 4. No traces of the signal from residual Sn flux are seen in data. The resistivity at base temperature, mK, in zero field is cm, consistent with cm obtained from fit in [Avila et al., 2004]. A clear break of the slope and the lower temperature decrease of resistivity below the magnetic ordering temperature, , associated with a loss of spin-disorder scattering is observed up to 70 kOe. At higher fields no signature of magnetic transition can be seen. Moreover, there in no clear signature of traditional form of non-Fermi-liquid behavior (linear or close-to-linear temperature dependence of resistivity) at fields close to the one at which is suppressed to (Fig. 4, inset).
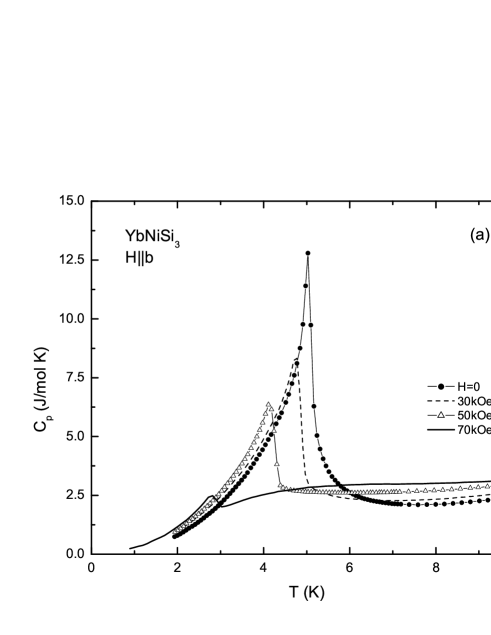
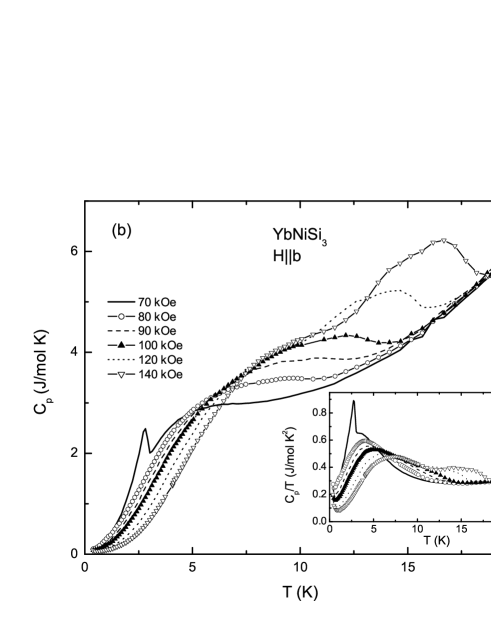
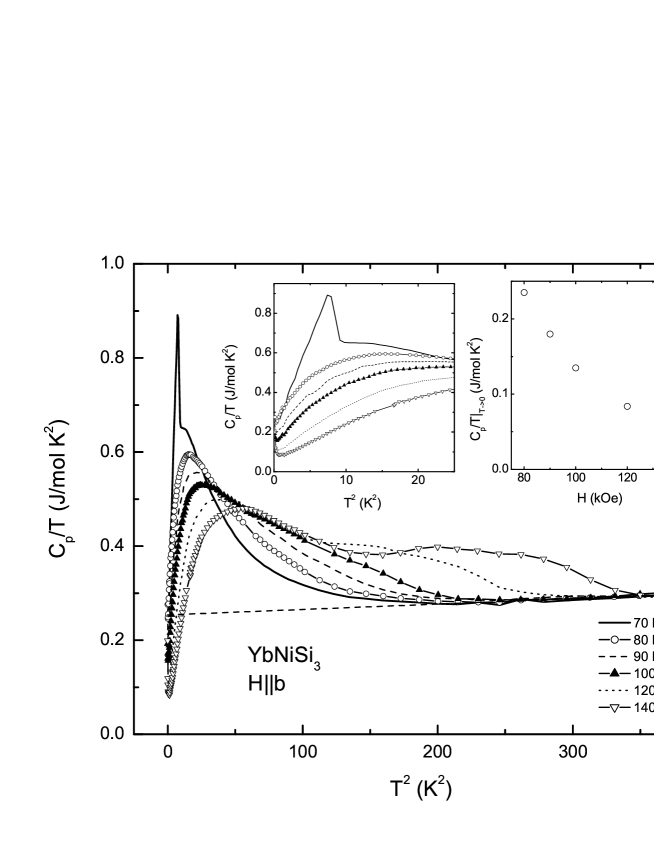
The temperature-dependent heat capacity is shown in Fig. 5. Results in zero field are consistent with the published data.Avila et al. (2004) Consistent to aforesaid, the peak in moves down with an increase of the applied magnetic field, it’s height decreases, and it is not recognized in the data at 80 kOe and above. Closer examination of kOe curve (Fig. 5b) reveals that the peak associated with the magnetic long range order is located on a background with a broad maximum. It is seen with more clarity if is plotted as a function of temperature (inset to Fig. 5b). This broad maximum moves up in temperature and acquires structure with an increase of applied field: the data for and 140 kOe can be deconvoluted to up to three broad peaks. For kOe these broad non-monotonic background is probably obscured by the feature in associated with the magnetic transition. The plausible explanation for these broad features is that they are Schottky-like contributions to the specific heat: the the degeneracy of crystal-electric-field-defined lower energy levels of YbNiSi3 (e.g. a quadruplet or two closely spaced doublets) is lifted by the Zeeman term of the hamiltonian, and the energy difference between different levels increases further on increase of the applied field. This explanation is in in dispute with the assumption of the doublet ground state of YbNiSi3 Avila et al. (2004) and calls for additional studies.
In order to evaluate the change of the electronic specific heat coefficient, , heat capacity data are re-plotted as vs. in Fig. 6. The small upturn at low temperatures (left inset to Fig. 6) that becomes more pronounced at higher fields is probably associated with the nuclear Schottky contribution to the specific heat. The Sommerfeld coefficient in the specific heat, , can be estimated by extrapolating the high temperature linear part of the vs. curves to (dashed line in Fig. 6). As a result of such procedure mJ/mol K2, practically independent of the applied field can be assessed. This value is close to the estimate in Ref. Avila et al., 2004 for . However, this estimate exceeds significantly the values of measured in regime for magnetic fields in which the magnetic order is suppressed, pointing out that, at least for 70 kOe 140 kOe, high temperature extrapolation of vs. is not an unique estimate of . This brings back the question of the estimate of the entropy associated with the magnetic transition Avila et al. (2004) and may point out that (in lieu of the data on non-magnetic analogue) the non-magnetic contribution, taken as extrapolation from above 10 K, was overestimated and the cited value of was underestimated.
Operationally, one can take the extrapolation to of the lowest temperature measurements plotted as
vs. , see left inset to Fig. 6 (ignoring the nuclear Schottky contribution), as an estimate of
. The obtained values (right inset to Fig. 6) seem to follow the trend generally observed in
materials close to QCP Gegenwart et al. (2002); Bud’ko et al. (2004); Morosan et al. (2006); Custers et al. (2003); Balicas et al. (2005). However, at least in the particular case of
YbNiSi3, one cannot discard the possibility that the shifts of the Schottky-like peaks to higher temperatures
with an increase of the applied field leads to a decreasing contribution (since it is taken further from the
maximum) to the apparent , and genuine behavior of the Sommerfeld coefficient is masked
by this fastly changing contribution.
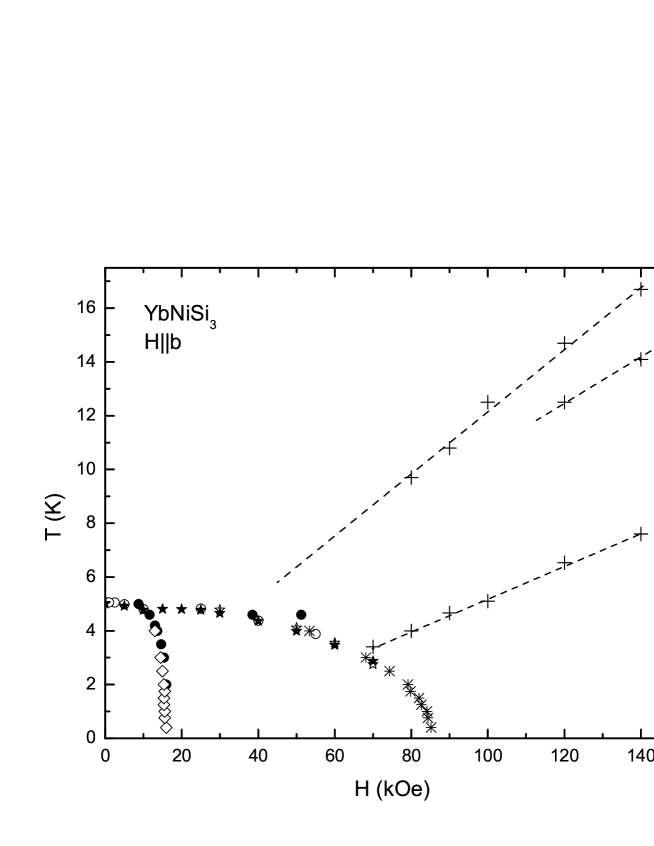
The thermodynamic and transport measurements on YbNiSi3 in magnetic field applied along the -axis define the phase diagram (Fig. 7). This phase diagram is consistent (in overlapping domains) with the one recently suggested Grube et al. (2006) from magnetoresistance isotherms for K. The phase diagram is rather simple, with only two phases in the ordered state, and a triple point. The positions of the Schottky-like anomalies are also shown, depending on the applied field in a close to linear fashion. A magnetic field of kOe suppresses the long range order, making the phase diagram look similarly to the cases of field-induced QCP recently discussed in several materials. Gegenwart et al. (2002); Bud’ko et al. (2004); Morosan et al. (2006); Custers et al. (2003); Balicas et al. (2005) Further understanding of the low temperature state of YbNiSi3 in applied field can be approached by detailed analysis of the magnetotransport and thermodynamic data.
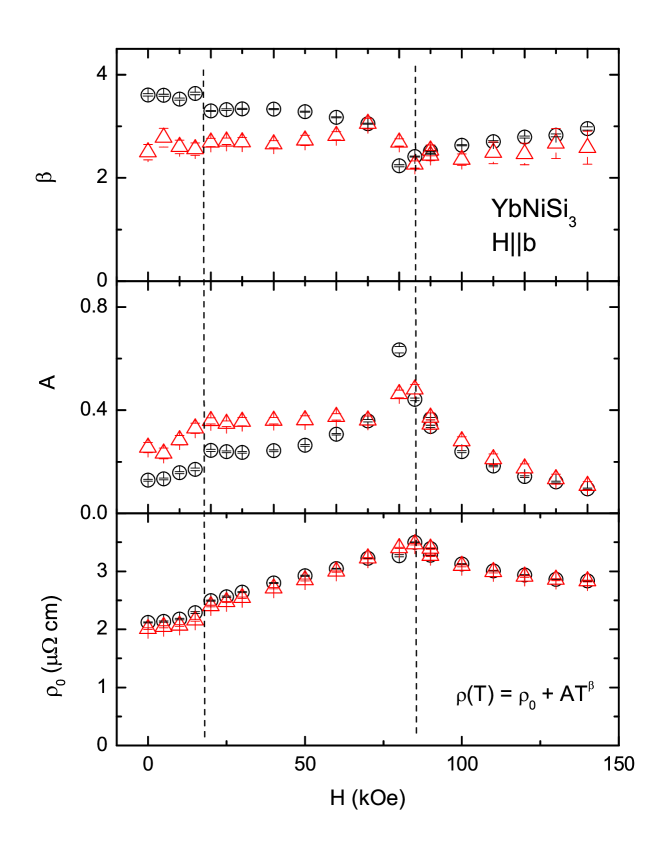
Low temperature resistivity () data measured in magnetic field were fitted with the equation (as e.g. in Ref. Niklowitz et al., 2006) with three fitting parameters: residual resistivity,
, pre-factor, , and exponent, . Two sets of fits were performed: from 3 K down to base
temperature ( K) and from 1.5 K down to base temperature. Both sets of fits are giving similar
results (Fig. 8). All three fitting parameters have features associated with the critical fields, the lower
critical field being essentially temperature-independent below 3 K and the upper one only shifting slightly as
decreases from 3 K to 1.5 K (as can be seen in and ). It is noteworthy that the exponent as
calculated from the data above K, does not fall below , and the changes in as
obtained from the 0.4 K 1.5 K are rather small (Fig. 8, upper panel). This is clearly
different from the case of field-induced QCP in YbRh2Si2, Gegenwart et al. (2002); Custers et al. (2003) YbAgGe Bud’ko et al. (2004); Niklowitz et al. (2006)
and other materials, although it is possible that approaches 1.0 for K, and in a very narrow
field range.
In summary, thermodynamic and transport measurements on YbNiSi3 () reveal phase diagram with two distinct, antiferromagnetic and metamagnetic, ordered phases and a triple point. An applied magnetic field of kOe suppresses the magnetic ordering temperature. As distinct from several known heavy fermions with field induced QCP, above 400 mK no non-Fermi-signature in resistivity was observed in the vicinity of the critical field for K, although they may well emerge for K data. Heat capacity measurements suggest that applied magnetic field splits degenerate ground state of YbNiSi3 and this field-dependent split of the energy levels manifest itself as Schottky-like anomalies. Additionally, possible artifacts in assessing of the Sommerfeld coefficient from heat capacity measurements, that have relevance beyond this particular compound, were disclosed.
Acknowledgements.
Ames Laboratory is operated for the U.S. Department of Energy by Iowa State University under Contract No. W-7405-Eng.-82. Work at Ames Laboratory was supported by the Director for Energy Research, Office of Basic Energy Sciences. Work in Hiroshima University was supported by a Grant-in-Aid for Scientific Research (COE Research 13CE2002) of MEXT Japan. PCC acknowledges R. A. Ribeiro for having devised the three-finger method of small sample manipulation. SLB acknowledges help of Kamotsuru on initial stage of this work.References
- Laughlin et al. (2001) R. B. Laughlin, G. G. Lonzarich, P. Monthoux, and D. Pines, Adv. Phys. 50, 361 (2001).
- Stewart (2001) G. R. Stewart, Rev. Mod. Phys. 73, 797 (2001).
- Stewart (2006) G. R. Stewart, Rev. Mod. Phys. 78, 743 (2006).
- Coleman et al. (2001) P. Coleman, C. Pépin, Q. Si, and R. Ramazashvili, J. Phys.: Cond. Mat. 13, R723 (2001).
- Sachdev (2000) S. Sachdev, Science 288, 475 (2000).
- Gegenwart et al. (2003) P. Gegenwart, J. Custers, T. Tayama, K. Tenya, C. Geibel, G. Sparn, N. Harrison, P. Kerschl, D. Eckert, K.-H. Müller, et al., J. Low Temp. Phys. 133, 3 (2003).
- Continentino (2005) M. A. Continentino, Braz. J. Phys. 35, 1 (2005).
- Coleman and Schofield (2005) P. Coleman and A. J. Schofield, Nature 433, 226 (2005).
- Doniach (1977) S. Doniach, in Valence Instabilities and Related Narrow-Band Phenomena, edited by R. D. Parks (Plenum Press, New York and London, 1977), p. 169.
- Gegenwart et al. (2002) P. Gegenwart, J. Custers, C. Geibel, K. Neumaier, T. Tayama, K. Tenya, O. Trovarelli, and F. Steglich, Phys. Rev. Lett. 89, 056402 (2002).
- Bud’ko et al. (2004) S. L. Bud’ko, E. Morosan, and P. C. Canfield, Phys. Rev. B 69, 014415 (2004).
- Morosan et al. (2006) E. Morosan, S. L. Bud’ko, Y. A. Mozharivskyj, and P. C. Canfield, Phys. Rev. B 73, 174432 (2006).
- Avila et al. (2004) M. A. Avila, M. Sera, and T. Takabatake, Phys. Rev. B 70, 100409 (2004).
- Fisher (1962) M. E. Fisher, Philos. Mag. 7, 1731 (1962).
- Custers et al. (2003) J. Custers, P. Gegenwart, H. Wilhelm, K. Neumaier, Y. Tokiwa, O. Trovarelli, C. Geibel, F. Steglich, C. Pépin, and P. Coleman, Nature 424, 524 (2003).
- Balicas et al. (2005) L. Balicas, S. Nakatsuji, H. Lee, P. Schlottmann, T. P. Murphy, and Z. Fisk, Phys. Rev. B 72, 0644228 (2005).
- Grube et al. (2006) K. Grube, T. Wolf, P. Adelmann, C. Meingastand, and H. von Löhneysen, Physica B 378-380, 750 (2006).
- Niklowitz et al. (2006) P. G. Niklowitz, G. Knebel, J. Flouquet, S. L. Bud’ko, and P. C. Canfield, Phys. Rev. B 73, 125101 (2006).