DRAFT July 13, 2006140 \draftcopySetScale70
Current address: ]National Institute of Standards and Technology (NIST), Gaithersburg, MD (USA)
Current address: ]School of Chemical and Biological Engineering, Seoul National University, Seoul (South Korea)
Capillary Filling of Anodized Alumina Nanopore Arrays
Abstract
The filling behavior of a room temperature solvent, perfluoro-methyl-cyclohexane, in 20 nm nanoporous alumina membranes was investigated in-situ with small angle x-ray scattering. Adsorption in the pores was controlled reversibly by varying the chemical potential between the sample and a liquid reservoir via a thermal offset, . The system exhibited a pronounced hysteretic capillary filling transition as liquid was condensed into the nanopores. These results are compared with the Kelvin-Cohan prediction, with a prediction in which the effect of the van der Waals potential is combined with the Derjaguin approximation and also with recent predictions by Cole and Saam.
pacs:
68.08.Bc, 61.10.Eq, 68.43. hNanoporous materials hold great potential in a wide variety of nanotechnology applications such as: DNA translocation Meller01 ; Rabin05 , nanofluidic transistors Karnik05 , templates for nanoparticle self-assembly Alvine06 ; Lahav03 , catalysis Benfield01 , and sensors for chemical agents Novak03 ; not to mention more commonplace applications such as filtering and humidity sensors Varghese02 . The breadth of nanopore research serves to underscore the need for a solid physical understanding of the evolution of liquids in such systems. Experimental studies have been done on porous network systems, such as the disordered Vycor Gelb98 and M41S silica materials Neimark01 . Unfortunately, these porous systems have very complicated network geometries that make it rather difficult to compare the measurements with simple theoretical predictions. Additionally, most of these studies are done at low temperatures that are impractical for all of the applications described above. Room temperature measurements on ordered nanoporous systems with nearly ideal geometry should provide insight into the physical processes governing liquid behavior in more general nanoporous systems.
We describe here in-situ small angle x-ray scattering (SAXS) experiments of the equilibrium wetting and capillary condensation of a room temperature solvent, perfluoro-methyl-cyclohexane (PFMC), within nanoporous alumina (Al2O3, pore diameter nm). The anodized alumina system had an ideal geometry described by a parallel arrangement of cylindrical nanopores with large aspect ratios 1:5,000, see Fig. 1. Masuda95 Experiments were carried out within an environmental chamber that allowed precise control of the amount of solvent condensed within the pores via changes in the chemical potential, , relative to liquid/vapor coexistence similar to studies of wetting on flat Tidswell91 and nanostructured surfaces Gang05 . Both adsorption and desorption processes were investigated reproducibly via this technique.
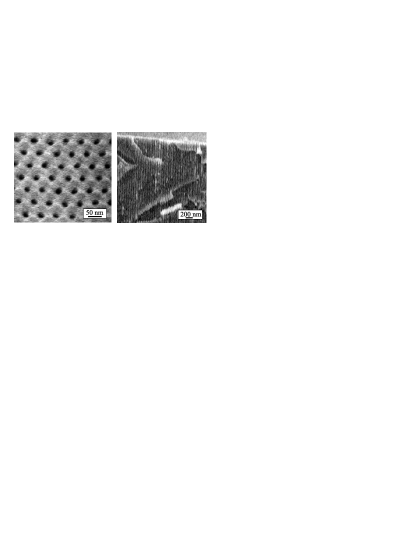
Porous alumina membranes were prepared electrochemically using a two-step anodization technique Masuda95 ; Shin04 and cleaned as described elsewhere Alvine06 . The resultant alumina membrane consisted of an array of cylindrical parallel pores running the entire thickness of the membrane and open on both ends. The macroscopic dimensions of the nanoporous membrane were about 1 cm 1 cm 90 microns. Pores formed a 2D local hexagonal order (see Fig. 1) with nearest neighbor distances (center to center) of 584 nm, and diameter of nm, determined via electron microscopy. After cleaning, samples were dried and loaded into a hermetically sealed environmental chamber under an atmosphere of “ultra-pure” grade N2.
The environmental chamber as described elsewhere Alvine06 ; Heilmann01 ; Tidswell91 , consisted of two concentric cylindrical metal chambers that allowed extremely stable (drift of mK/hr) temperature control of the sample with a precision of mK. Condensation of liquid solvent into the pores was precisely controlled via a positive offset between the sample temperature, and the temperature, , of a liquid PFMC (purum grade, 97% GC) reservoir, related to the chemical potential by . Alvine06 ; Heilmann01 ; Tidswell91 Here, kJ/mol is the heat of vaporization of PFMC. Good59 For large , little or no liquid condenses in the pores. As the (and thus ) is decreased toward zero, increasing amounts of liquid condense into the pores until saturation (complete volume filling) is obtained.
During the experiment, the inner and outer chambers were set at ∘C ( ∘C) and ∘C respectively. Although the sample was nearly thermally isolated from the inner chamber; for high sample temperatures, such as ∘C, the large heat loads on the sample increased and to 36 ∘C and 38 ∘C), respectively. At each measured however; the stability of was better than 50 mK.
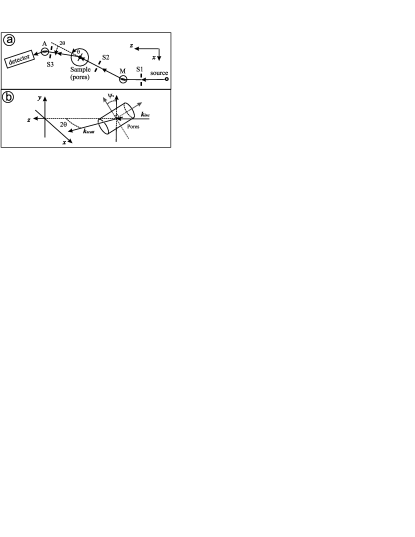
In-situ small angle x-ray scattering (SAXS) data were collected using incident monochromatic Cu-Kα1 radiation with high horizontal angular resolution of (87 rad) obtained using a triple-bounce channel cut Bonse-Hart Deutsch80 Ge(111) monochromator . High horizontal detector resolution was obtained by mounting an identical triple-bounce Ge(111) analyzer crystal after the sample, in the non-dispersive geometry Als-Nielsen01 (see Fig. 2). Scattered photons were collected with a scintillation detector.
The alumina membrane was mounted in a transmission geometry with the face of the membrane nearly perpendicular to the x-ray beam, aligning the long axis of the pores nearly parallel to the beam. In order to take advantage of the narrow horizontal angular resolution, the membrane was tilted in the vertical direction by . This tilt effectively confined the scattering to the horizontal plane and minimized wave-guide or multiple scattering effects due to grazing angle reflections from the pore walls. In this geometry the intensity of the powder diffraction peak, due to the 2D hexagonal packing arrangement of the co-aligned pores with a well defined pore-pore distance, was recorded in-situ as was varied between 0.1 K up to 27 K for both adsorption (cooling) and desorption (heating) paths.
Immediately prior to collecting the data presented here, the pores were cleaned in place by repeated “flushing” (produced by rapid thermal cycling over the full range) with PFMC over ten thermal cycles. The intensity of the diffraction peak gradually increased with flushing as compared at the highest ; then remained constant after three cycles.
As liquid condenses into the pores, replacing N2, the electron density contrast of the system decreases, eventually saturating when the pores are completely filled with liquid. This reduction in contrast is measured by a corresponding decrease in the scattering intensity of the powder diffraction peaks, , relative to the dry peak intensity, (see Fig. 3). Neglecting absorption, the added solvent volume fraction, , can be determined within the small angle approximation Alvine06 ; Gang05 from the lowest order peak as follows:
| (1) |
Due to van der Waals (vdW) interactions, the pores are, in practice, never ”dry” or empty making difficult to measure. Even at the large realized in this experiment we still expect monolayer adsorption of material onto the walls of the pores, evidenced by the necessity of “flushing”. For small , complete volume filling is easily observed by the intensity saturation. For the purposes of this analysis we calculated a theoretical value for from the ratio of the form factors squared for empty and PFMC filled pores. The form factor, a function of the radius, , liquid film thickness, , the electron densities, and , for PFMC and Al2O3 respectively, and scattering vector , is as follows:
| (2) |
The ratio, , combined with the saturated intensity at low , provided the necessary offset and normalization.
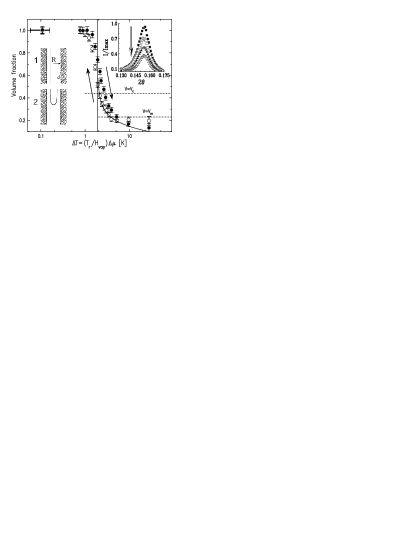
Values for the fractional volume condensed into the pores as a function of , derived from the diffraction peak intensity for both adsorption and desorption, are shown in Fig. 3. X-ray adsorption corrections were applied to the highest points where the heat load caused increased vapor pressure in the environmental chamber. The system exhibited a pronounced capillary transition upon filling, occurring at approximately K (at maximum slope). Utilizing the simple Kelvin equation for capillary filling:
| (3) |
where mN/m is the surface tension of the PFMC, and mol/m3 is the molar volume of the PFMC, this indicates a nanopore radius of nm, in agreement with electron microscopy measurements. Here vdW interactions have been ignored. The system also exhibited hysteresis common to porous systems Adamson97 with the desorption transition occurring at K. The width of this hysteresis is smaller by a factor of five than the prediction by Cohan Cohan38 for a desorption transition at due to pores emptying by retreating menisci from the pore ends. Thus, the simple Cohan argument cannot provide a complete description of the hysteresis observed here, indicating the necessity of using a more complex theory.
In their seminal work, Cole and Saam Cole74 ; Saam75 put forth a theoretical treatment which includes substrate interactions ignored by the Cohan-Kelvin theory. A brief outline of their capillary pore filling theory, including the influence of vdW interactions with the pore walls is given here. We make an additional assumption, valid for this system, that the capillary transition occurs when the adsorbed thickness of liquid on the pore walls is thin enough, with respect to the pore radius, to employ the Derjaguin approximation Derjaguin76 ; Israel92 , allowing a simplified analytical treatment.
The total free energy per unit length of a cylindrically symmetric film on the walls of the pore is:
| (4) |
where is the vdW potential between the liquid and the pore walls. For thin films relative to the pore radius, , is approximately that of a liquid film on a flat substrate (Derjaguin approximation) Israel92 :
| (5) |
where J is the effective Hamaker constant for PFMC on Al2O3 note1 . In the limit of vanishing film thickness, this term should be replaced by the interfacial tension term for the pore wall/liquid interface. The equilibrium condition is then given by:
| (6) | |||||
| (7) |
Equation 7 simplifies to the Kelvin equation when vdW interactions are ignored. Using Eq.( 7) we fit the pre-transition filling data for the absorption cycle as a function of yielding a value of (see Fig. 3 solid curve) in agreement with the Kelvin value above. Discrepancies with the fit at large are due to the film thickness being on the order of the monolayer thickness. The capillary transition to filled pores occurs when the chemical potential reaches the minimum allowed value, since further reduction of the chemical potential can only be achieved by complete filling of the pore, , in which case the surface tension term vanishes due to the vanishing of the interface. This stability or critical condition for the cylindrically symmetric film is satisfied for (in the limit ):
| (8) |
This demonstrates that the thin film is stabilized by the vdW interactions with the pore wall and that, at the transition, nm validating the use of the Derjaguin approximation, .
For our system with nm (using the fit value), numerical calculations of Cole and Saam predict an onset of instability for volume fraction (see Fig. 3 in Ref. Saam75 ) with nm for the PFMC/Al2O3 system. The estimate for the onset of the capillary transition, occurs at slightly higher than expected from the Kelvin and Derjaguin methods (see Fig. 3), but within the uncertainty given above.
Cole and Saam additionally make a prediction about the hysteresis upon desorption. They argue that the hysteresis occurs due to a partially filled pore with meniscus (see Fig. 3, upper insert (2)) being metastable with respect to a conformal thin film geometry (see Fig. 3, upper insert (1)). The metastable limit is also a function of the pore radius, R, and . Cole and Saam’s numerical analysis predicts a metastable volume fraction for our experimental parameters (see Fig. 3 in Ref. Saam75 ). The value approximately corresponds to the volume fraction where the desorption curve joins with the absorption curve, in good agreement with our experimental results, as indicated in Fig. 3. It is worth noting that this joining occurs at , where the Cohan argument predicts pores to empty by hemispherical menisci. Unfortunately there is no prediction of the where the desorption transition initiates, and it not possible to translate and into a hysteresis width.
The above analysis indicates that for systems with ideal capillary geometry, such as the porous anodized alumina system studied here, the theory of Cole and Saam provides a good description of the capillary filling transition. For the cylindrical pores described here, the Kelvin equation is a reasonable predictor of the filling transition as well, though it must become increasingly worse for decreasing pore size. The Kelvin-Cohan argument fails to qualitatively predict the observed hysteresis for the system. Cole and Saam’s theory, which includes vdW interactions, demonstrates good agreement with the experimental results in prediction of the capillary transition and does yield information about the observed hysteresis, yet there is not a satisfactory prediction of the observed width. It is clear from the experimental data that the desorption transition occurs at lower than either prediction. Some of the shift may be due to broadening of the transition by pore diameter polydispersity, though from Fig. 3 this effect seems insufficient to fully account for the shift. Also, large pore aspect ratios rule out the influence of end effects and suggests other mechanisms for desorption are required to explain this feature of the data.
We are grateful to M. W. Cole for helpful discussions and comments. This work was supported by the National Science Foundation Grants No. 03-03916 and No. 01-24936
References
- [1] A. Meller, L. Nivon, and D. Branton. Phys. Rev. Lett. 86, 3435 (2001)
- [2] Y. Rabin, and M. Tanaka. Phys. Rev. Lett. 94, 148103 (2005)
- [3] R. Karnik, R. Fan, M. Yue, D. Y. Li, P. D. Yang, and A. Majumdar. Nano Lett. 5, 943 (2005)
- [4] K. J. Alvine, O. G. Shpyrko, P. S. Pershan, D. J. Cookson, K. Shin, T. P. Russell, M. Brunnbauer, F. Stellacci, and O. Gang. Phys. Rev. B 73, 125412 (2006); K. J. Alvine. Thesis, Harard University (2006)
- [5] M. Lahav, T. Sehayek, A. Vaskevich, I. Rubinstein. Angew. Chem. Int. Ed. 42, 5576 (2003).
- [6] R. E. Benfield, D. Grandjean, M. Kröll, R. Pugin, T. Sawitowski, and G. Schmid. J. Phys. Chem. B 105, 1961 (2001).
- [7] J. P. Novak, E. S. Snow, E. J. Houser, D. Park, J. L. Stepnowski, and R. A. McGill. Appl. Phys. Lett. 83 4026 (2003).
- [8] O. K. Varghese, D. Gong, M. Paulose, K. G. Ong, C. A. Grimes. J. Mater. Res. 17 1162 (2002).
- [9] L. D. Gelb and K. E. Gubbins. Lang. 14, 2097 (1998).
- [10] A. V. Neimark, P. I. Ravikovitch Micropor. and Mesopor. Mater. 44, 697 (2001).
- [11] H. Masuda and K. Fukuda. Science 268, 1466 (1995).
- [12] I. M. Tidswell, T. A. Rabedeau, P. S. Pershan, and S. D. Kosowsky. Phys. Rev. Lett. 66, 2108 (1991).
- [13] O. Gang, K. J. Alvine, M. Fukuto, P. S. Pershan, C. T. Black, and B. M. Ocko. Phys. Rev. Lett. 95, 217801 (2005)
- [14] K. Shin, H. Xiang, S. I. Moon, T. Kim, T. J. McCarthy, and T. P. Russell. Science 306, 76 (2004).
- [15] R. K. Heilmann, M. Fukuto and P. S. Pershan. Phys. Rev. B 63, 205405 (2001).
- [16] M. Deutsch. J. Appl. Cryst. 13, 252 (1980)
- [17] J. Als-Nielsen, and D. McMorrow. Elements of Modern X-Ray Physics, Wiley, New York, USA, 2001) pg. 200
- [18] W. D. Good, D. R. Douslin, D. W. Scott, A. George, J. L. Lacina, J. P. Dawson, G. Waddington. J. Phys. Chem. 63, 1133 (1959)
- [19] A. W. Adamson, and A. P. Gast. Physical Chemistry of Surfaces, 6th ed., Wiley Interscience, New York, USA, 1997) pg. 665
- [20] L. H. Cohan. J. Am. Chem. Soc. 60, 433 (1938).
- [21] M. W. Cole, and W. F. Saam. Phys. Rev. Lett. 32, 985 (1974)
- [22] W. F. Saam, and M. W. Cole. Phys. Rev. B 11, 1086 (1975)
- [23] B. V. Derjaguin, and N. V. Churaev. J. Colloid Interf. Sci. 54 157 (1976).
- [24] J. M. Israelachvili. Intermolecular & Surface Forces, 2nd ed., (Academic Press, New York, USA, 1992)
- [25] This value for for PFMC on Al2O3 relies on the approximation (see Ref. [24]) and the values (PFMC) J (see Ref. [16]) and (Al2O3) J (see Ref. [24]).