Magnetization and EPR studies of the single molecule magnet Ni4
with integrated sensors
Abstract
Integrated magnetic sensors that allow simultaneous EPR and magnetization measurements have been developed to study single molecule magnets. A high frequency microstrip resonator has been integrated with a micro-Hall effect magnetometer. EPR spectroscopy is used to determine the energy splitting between the low lying spin-states of a Ni4 single crystal, with an ground state, as a function of applied fields, both longitudinal and transverse to the easy axis at 0.4 K. Concurrent magnetization measurements show changes in spin-population associated with microwave absorption. Such studies enable determination of the energy relaxation time of the spin system.
An understanding of decoherence and energy relaxation mechanisms in single molecule magnets (SMMs) is both of fundamental interest Chudnovsky et al. (2005) and important for the use of SMMs in quantum computing Leuenberger and Loss (2001). Quantum tunneling of magnetization (QTM) has been widely studied in SMMs Friedman et al. (1996); Thomas et al. (1996); Wernsdorfer and Sessoli (1999). A recent focus is on coherent QTM in which the tunneling rates may be faster than the rate of decoherence Hill et al. (2003); del Barco et al. (2004). Experiments on SMMs del Barco et al. (2004) and doped antiferromagnetic rings Wernsdorfer et al. (2005); Ardavan et al. (2006) have been reported. However, the basic relaxation mechanisms in SMMs are still under active investigation both experimentally and theoretically Chudnovsky and Garanin (2002).
We have developed sensors allowing simultaneous EPR and magnetization measurements at low temperatures (typically below 1 K) to study SMMs. A microstrip resonator Gupta et al. (1996) with resonance frequency between 25 and 30 GHz has been integrated on a chip with a micro-Hall effect magnetometer Kent et al. (1994). The high filling factor in such resonators allows measurement of photon absorption in very small crystals as well as the application of large microwave magnetic fields, needed for Rabi experiments. The fast response of the Hall sensor ( MHz) also enables time-resolved measurements of the magnetization
In this paper we show EPR spectroscopy of the two lowest energy levels associated with high spin states () of a Ni4 single crystal. We present simultaneous measurements of associated photon-induced changes in the magnetization. This represents an important advance from the experiments in refs. del Barco et al. (2004); Wernsdorfer et al. (2005), in which only photon induced magnetization changes were measured, and EPR studies were not possible. In particular, it enables a direct determination of the energy relaxation time of the spin system.
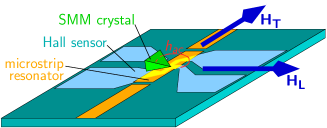
A schematic of our integrated sensor is presented in Fig. 1. The Hall sensor is fabricated from a GaAs/AlGaAs heterostructure 2D electron gas to form a cross of width m, chosen to optimize the coupling with a SMM crystal with lateral dimensions of about m. Our magnetometer has a Hall coefficient of T and a noise level of T with a current of A. This permits detection of changes in the magnetization smaller than of the saturation magnetization of our SMM crystals (m3), using a lock-in detection bandwith of 300 ms. The microstrip resonator, a 250 nm thick gold line, is evaporated on top of the Hall sensor and capacitively coupled to two feedlines, so that it can work in transmission mode. It is designed to be matched to 50 and its fundamental resonance frequency ranges between 25 and 30 GHz ( mm width and 1.5 mm length). The MW field, , is maximum and uniform above its center, aligned with the Hall cross. The strength of at the sample location was calibrated for each integrated sensor used: the circularly polarized saturation amplitude of DPPH ( Oe) corresponds to an incident power of about 50 mW. This value depends on the quality factor of the resonator, found to be about 20.
The sensor is in a 3He cryostat with a base temperature of 0.35 K. The two ports of the microstrip are connected through coaxial lines to an Agilent PNA 50 GHz vector network analyzer with copper and stainless steel sections to minimize thermal and MW losses (12 to 14 dB in our frequency range at low temperature). The PNA is used as a MW source and allows transmission measurement. Furthermore, it is possible to gate the source using a pulse pattern generator (no pulsed experiments will be presented in this paper). A high field superconducting vector magnet is used to apply DC magnetic fields in arbitrary directions with respect to the axes of the crystal.
To demonstrate the capabilities of our integrated sensor, we have studied [Ni(hmp)(dmb)Cl]4, henceforth referred to as Ni4. This is a particularly clean SMM with no solvate molecules present in its crystal phase and only 1% (natural abundance) of nuclear spins on the transition metal sites Yang et al. (2003). This results in narrower EPR peaks than in many SMMs Edwards et al. (2003). The spin Hamiltonian of Ni4 is to first approximation:
| (1) |
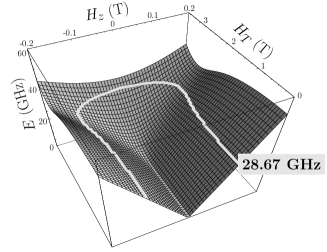
where the first term is the uniaxial anisotropy, the second the Zeeman energy, and the last one includes higher order anisotropy terms (i.e., ). The ground state of the molecule at low temperature is the consequence of ferromagnetic exchange interactions between the four Ni () ions. The uniaxial anisotropy leads to a large energy barrier K (anisotropy field T) to magnetization reversal between states of projection along the easy axis of the molecules (). The two lowest energy states are the symmetric () and antisymmetric () linear combinations of and states. In the presence of a transverse field , the latter are tilted away from the easy axis and have opposite projections del Barco et al. (2004). There is an energy separation between and , known as the tunnel splitting , which, in the field range in these experiments, increases with when equals zero. This energy separation also increases with due to the Zeeman term. Thus, when a sample is irradiated at constant frequency with a MW field aligned with , it is possible to induce transitions between and and to map out the constant energy splitting () locus in the (, ) phase space (cf. Fig. 2). These measurements enable determination of the spin-Hamiltonian parameters and set a lower bound of the decoherence time, as shown below. The transition rate is given by the Fermi golden rule:
| (2) |
where is the matrix element coupling the states and is a lorentzian of linewidth .
In steady state, the absorbed power is simply , where is the difference in population between states and . When these states have different projections on the -axis, the photon-induced transitions lead to a change in magnetization . If these projections on the -axis are opposite, one can deduce from energy conservation. It is simply linked to the absorbed power and to the energy relaxation time Bloembergen and Wang (1954):
| (3) |
where and are the difference in population between and and the magnetization in the absence of MW, respectively. Thus, simultaneous measurements of and yield . We emphasize that this latter may be different from the spin-phonon relaxation time, as in the case of the phonon bottleneck Abragam and Bleanley (1970); Garanin (2006).
At the temperatures used in our experiments only the two lowest lying spin-levels are thermally populated. Moreover, for the transverse fields used, the thermal energy is smaller than the photon energy, . A pyramidal Ni4 crystal is placed with one of its faces parallel to the plane of the sensor, in the middle of the microstrip resonator, and oriented so that is aligned with , along the axis of the pyramid. The Hall device responds to the average magnetic field perpendicular to the plane of the sensor, which for the sample shape and placement, is mainly due to the -component of the sample magnetization. Because of this pyramidal shape, the easy axis is not aligned (°) with , which lies in the sensor plane. There is also a second misalignment ° between and the projection of the axis on the sensor plane. The longitudinal field felt by the molecules is thus , whereas the transverse field is to a good approximation . Note that the EPR data are plotted versus .
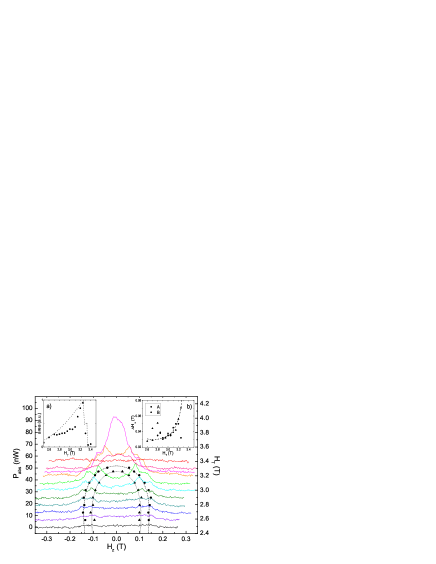
Fig. 3 presents the EPR signal measured at GHz for several values of as is swept at 0.1 Tmin. The power transmitted through the resonator is monitored in cw mode. The low power level used for this study induces a small increase of the sample temperature to 0.4 K. Two symmetric groups of peaks with respect to T are observed. They correspond to transitions between and . A multiple-lorentzian fit leads to two main peaks, A and B, assigned to two species of Ni4 molecules present in the crystal, associated with different molecular environments Edwards et al. (2003). As is increased, the amplitude of the peaks increases and the resonance occurs at smaller . As expected the EPR signal disappears at large as becomes larger than . A direct diagonalization of yields the dependence of the energy splitting on and . The dashed line is a fit of the peak A data (circles) using K, K, K, , . These parameters are in good agreement with high frequency cavity EPR measurements Edwards et al. (2003). The dotted line is the best fit for peak B (triangles), obtained for K, K, K, , . An extremely high value (unphysical) of is needed to fit the data points, which is not understood at present.
The curvature of the energy splitting as the longitudinal field goes to zero is evidence of level repulsion, as already noted in ref. del Barco et al. (2004). EPR has the advantage that one can meausre the splitting at small , where no or only small changes in the magnetization are expected. The inset (a) of Fig. 3 shows the area under the experimental absorption curves versus . The dashed line is the prediction from the direct diagonalization of and Eq. 2. The calculation shows some discrepancy with the data in the intermediate regime of . Nevertheless, it reproduces well the global behavior: the signal increases with until peak B first disappears, followed by peak A. Using a semi-classical model (strictly valid for ), an analytical expression for the linewidth of the EPR signal measured as is swept can be obtained:
| (4) |
where is the energy broadening of the two levels and . The dashed line in the inset (b) of Fig. 3 is a fit of the data with respect to . The fitting value corresponds to a transverse relaxation time of 0.2 ns. This should be viewed as a lower bound of the decoherence time, ns, which is consistent with ref. del Barco et al. (2004). We emphasize that no photon induced changes in the magnetization have been observed on this crystal, either at that low MW power, or in higher power pulsed MW experiments. Using Eq. 3, one can then deduce an upper bound for of s, i.e. much less than it had been found in ref. del Barco et al. (2004).
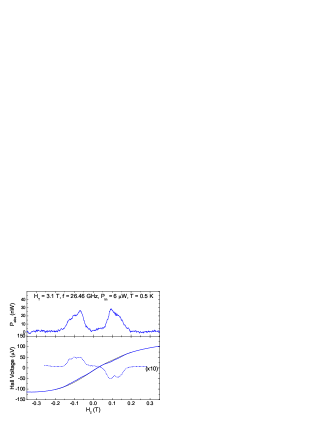
Fig. 4 presents the EPR signal and the simultaneous measured changes in the magnetization of a different crystal than reported in Fig. 3. The same EPR spectroscopy study as that described above yields similar results. However in that case, there is a clear evidence of changes in the magnetization, at a similar level of absorbed power. This is due to a much longer , found to be ms assuming that the same part of the crystal contributes to the signals measured by the Hall sensor and the PNA. We note that using the calibrated MW field strength, mOe, the estimation from the transition rate (Eq. 2) yields a power absorbed 30 times larger than that observed. One can thus infer that only 3% of the crystal is absorbing energy at the maximum of the resonance. We attribute that to inhomogeneous broadening of the absorption line.
In conclusion, simultaneous measurements of magnetization and EPR spectroscopy on tiny SMM single crystals have been demonstrated using an integrated sensor. The obtained EPR data are well explained using a direct diagonalization of the Hamiltonian of the spin system. Associated photon-induced changes in the magnetization depend on the the energy relaxation time. The latter is seen to vary greatly between different crystals. This is probably linked to the thermalization of the crystal Garanin (2006). A detailed study of such effects is in progress. Finally, the integrated sensors developed for this work are also promising to conduct Rabi and spin-echo experiments. Such experiments and real-time measurement of the magnetization should allow measurements of the intrinsic decoherence time and relaxation times in SMMs.
This work was suppported by NSF (Grant No. DMR-0506946).
References
- Chudnovsky et al. (2005) E. M. Chudnovsky et al., Phys. Rev. B 72, 094426 (2005).
- Leuenberger and Loss (2001) M. N. Leuenberger and D. Loss, Nature 410, 789 (2001).
- Friedman et al. (1996) J. R. Friedman et al., Phys. Rev. Lett. 76, 3830 (1996).
- Thomas et al. (1996) L. Thomas et al., Nature 383, 145 (1996).
- Wernsdorfer and Sessoli (1999) W. Wernsdorfer and R. Sessoli, Science 284, 133 (1999).
- Hill et al. (2003) S. Hill et al., Science 302, 1015 (2003).
- del Barco et al. (2004) E. del Barco et al., Phys. Rev. Lett. 93, 157202 (2004).
- Wernsdorfer et al. (2005) W. Wernsdorfer et al., Phys. Rev. B 72, 060409 (2005).
- Ardavan et al. (2006) A. Ardavan et al., quant-ph/0609143 (2006).
- Chudnovsky and Garanin (2002) E. M. Chudnovsky and D. A. Garanin, Phys. Rev. Lett. 89, 157201 (2002).
- Gupta et al. (1996) K. Gupta et al., Microstrip Lines and Slotlines (Artech House, 1996).
- Kent et al. (1994) A. D. Kent et al., J. Appl. Phys. 76, 6656 (1994).
- Yang et al. (2003) E.-C. Yang et al., Polyhedron 22, 1727 (2003).
- Edwards et al. (2003) R. S. Edwards et al., J. Appl. Phys. 93, 7807 (2003).
- Bloembergen and Wang (1954) N. Bloembergen and S. Wang, Phys. Rev. 93, 72 (1954).
- Abragam and Bleanley (1970) A. Abragam and A. Bleaney, Electron Paramagnetic Resonance of Transition Ions (Clarendon Press, Oxford, 1970).
- Garanin (2006) D. A. Garanin, cond-mat/0609379 (2006).