Break-down of the density-of-states description of scanning
tunneling spectroscopy
in supported metal clusters
Abstract
Low-temperature scanning tunneling spectroscopy allows to probe the electronic properties of clusters at surfaces with unprecedented accuracy. By means of quantum transport theory, using realistic tunneling tips, we obtain conductance curves which considerably deviate from the cluster’s density of states. Our study explains the remarkably small number of peaks in the conductance spectra observed in recent experiments. We demonstrate that the unambiguous characterization of the states on the supported clusters can be achieved with energy-resolved images, obtained from a theoretical analysis which mimics the experimental imaging procedure.
pacs:
73.22.-f, 73.63.-b, 36.40.CgThe investigation of the properties of atomic clusters is of great fundamental interest since this class of systems allows to bridge the gap between single atoms on one side and bulk material on the other side cluster . This applies to both free clusters in the gas phase and clusters deposited at surfaces. Compared to the gas phase, where characteristic effects like magic numbers and size dependent bond-character changes are well studied, the understanding of supported clusters is much less developed due to the the numerous technical difficulties the problem poses to both experiment and theory. However, there is a growing interest in supported clusters, mainly for two reasons: firstly, by means of a scanning tunneling microscope (STM) one is now able to perform single-cluster studies nier+99 , much more difficult to achieve in the gas phase because of the low beam intensity of mass-selected clusters. Additionally, scanning tunneling spectroscopy (STS) provides valuable information on the electronic properties, also allowing spatial resolution, in contrast to the non-local character of photoelectron spectroscopy hamo+04 . Secondly, supported clusters promise to be efficient catalysts as oxidation experiments with small gold clusters indicate vala+98 ; hesc00 . STM/STS techniques represent unique tools to analyze supported clusters and thus to shed light on the oxidation mechanism.
STS measurements of metallic clusters (platinum beko+98 , silver hogr+00 , and gold baho03 ; hoba06 ) on graphite surfaces were performed in recent years in order to verify the effect of the substrate on the electronic structure of the clusters. The STS spectra showed peaks which were unambiguously shown to be produced by cluster states. Also, experiments ruled out that for metal clusters at graphite the observed peaks are due to Coulomb blockade effects hogr+00 ; hoba06 . Surprisingly, the number of peaks obtained for the considered bias-voltage range was considerably smaller than the number of electronic states expected for the cluster within the corresponding energy interval beko+98 ; hogr+00 ; baho03 ; hoba06 . These facts clearly indicate that there are states of the clusters which do not contribute to the conductance, and that the simple interpretation of the STS spectra only in terms of the density of states (DOS) teha8385 is not sufficient. Moreover, no systematic trend of the peak distribution as a function of the cluster size could be singled out. Besides, repeated measurements of the same cluster showed variations in the spectra hoba06 . The blurry picture emerging from these observations calls for a theoretical analysis in order to evaluate the dependence of the conductance spectra on the details of the STS measurement.
In this Letter we demonstrate that the description of STS spectra only in terms of the DOS breaks down in the case of metallic clusters on graphite surfaces. Furthermore, we show that the interpretation and understanding of STS spectra requires the careful calculation of the electron transport through the cluster to the infinite supporting surface, taking into account a realistic shape for the STM tip. Our approach, based on non-equilibrium Green’s functions (NEGF), treats cluster and surface on an equal microscopic footing. It allows us to determine the differences between the DOS and the conductance for different cluster sizes, tip shapes and surface-tip distances. We will show that there is a crucial dependence of the STS spectra on the lateral position of the tip which should always be kept in mind when discussing experimental spectra. As we report in our simulations, a reliable characterization of the cluster states should be done by means of energy resolve imaging, therefore combining spectral information with spatial resolution.
We performed quantum transport calculations for silver clusters having up to 233 atoms on a perfect graphite surface. We consider the STM scenario in which the tip of the STM is at a distance of a few Å over the cluster and calculate the tunneling current between tip electrode and cluster; all the components are treated at the atomistic level. For the cluster we assume the lattice constant of the Ag fcc bulk crystal structure and use a Wulff construction hawo+99 to define the facets mesa+06 . By means of an effective surface energy for silver and graphite we can vary the width-to-height ratio of the clusters to match the experimental value hogr+00 . The lateral position of the cluster on the surface was found to be of minor importance; the cluster-surface distance was set to 2.5 Å, consistent with ab initio calculations for Ag monomers and dimers on graphite wabe+03 . The platinum electrode above the cluster is either just a flat ideal surface or a sharp pyramidal Pt tip mounted on the electrode surface. The flat electrode is used for reference calculations; the sharp tip, having a pyramidal structure of three layers with 1-3-6 atoms, can be considered as a model of a real STM tip stm-book .
The electronic structure and the transport properties of the whole system, i. e. graphite surface, silver cluster and platinum electrode/tip, are calculated by means of an NEGF approach da95 ; brmo+02 . The DOS and the current at a given bias are calculated from the Green’s functions of the cluster; they contain the interaction with the surface and the electrode/tip via tunneling self-energies da95 . We employ a self-consistent tight-binding model which is parameterized from density-functional calculations; atomic charge fluctuations (transfer and polarization) are taken into account elpo+98 . The procedure for calculating equilibrium properties, like the charge transfer to or from the cluster, and transport properties, like the current through the cluster, is described in Ref. mesa+06a .
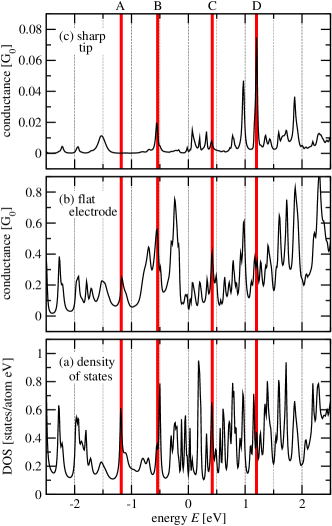
Figure 1 presents a comparison of the DOS with the conductance for Ag112, calculated for both tip shapes described above. Two different regions can be identified in the DOS of the supported cluster, based on the mean level spacing: a rich structure with many peaks and level distances of eV is visible above the Fermi energy (), while for the occupied states () we have a larger spacing, eV. The latter value is similar to the energy level spacing measured with photoelectron spectroscopy for Ag clusters of comparable size, cf. Fig. 2 of Ref. hamo+04 . One should mention that, in the case of supported silver clusters it is hardly possible to assign certain levels to the peaks as it is done for free clusters hamo+04 or supported fullerenes mesa+06a . By calculating the DOS of the clusters placed at different heights over the surface, we observed that, as the clusters approach the surface, the levels are not only broadened but are also shifted to higher or lower energies in a complicated way.
Next, we compare the DOS to the conductance patterns for the flat and the sharp tips, taken as representatives of two limiting cases. Panel (b) of Fig. 1 shows for the flat electrode. The relative peak height changes compared to the DOS; some peaks are reduced, for example the peak A at eV, while others are enhanced, for example at eV. Despite these variations, the overall picture is largely preserved and we conclude that the conductance measured with the artificially flat electrode would give a reasonable picture of the DOS of the cluster. The situation changes drastically for the sharp tip, as shown in panel (c) of Fig. 1. Due to the reduced number of atoms of the probe participating to the tunneling process, the conductance drops by more than an order of magnitude (in fact we observed that for the flat electrode the average conductance scales directly with the nuber of atoms in the top facet of the cluster). More remarkably, a few peaks completely disappear, for example the one labeled A, while many others are strongly suppressed. The discrepancy between the spectra obtained with the two kinds of electrodes can be understood as follows. While the flat electrode signal receives contribution from all atoms on the top facet, representing the average DOS, the sharp tip probes the local DOS in a small region, and the resulting conductance will be affected by the spatial dependence of the specific state (see below). Independently of the detailed structure of the probe in the experiments, we expect that the measured conductances should be related to our sharp-tip results. Any atom sticking out of the tip will carry almost all current in the tunneling regime.
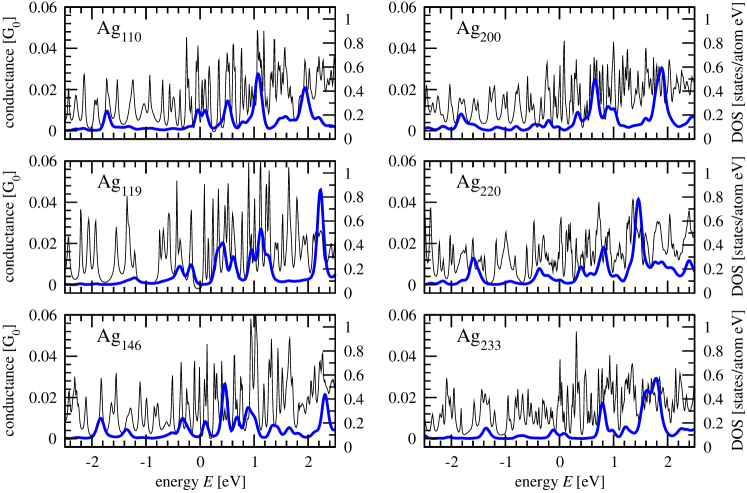
We have extended the study to other cluster sizes and present six of them in Fig. 2. In each of the graphs we compare the sharp-tip conductance with the DOS of the supported cluster. As in Fig. 1 we placed the tip centrally over the cluster. Additionally, the conductance curves were convoluted with a Gaussian function of 100 meV full width at half maximum, in order to reproduce the accuracy of experimental low-temperature measurements hoba06 . Even if the detailed shape of the curves differs from one cluster size to the next one, the general message is the same: the conductance is much less structured than the corresponding DOS. Thus we conclude that the experimentally found larger level spacing in supported cluster beko+98 ; hogr+00 ; baho03 ; hoba06 , if compared to the gas phase hamo+04 , is due to the local and selective character of the transport measurement. However, in accordance with the experimental observation hoba06 , positions and widths of the conductance peaks in Fig. 2 do not show any trend with the cluster size.
So far we have described situations in which the sharp tip was placed over the cluster center. Moving the tip laterally from the central position may change the observed conductance spectra substantially. Energy resolved maps are obtained by projecting the local conductance on a constant current isosurface at particular energies . The constraint of a constant current isosurface is necessary to compare conductance values measured at different positions over the sample. This point represents the main difficulty in the calculations, since tip trajectory invariably describes a complicated surface.
In Fig. 3 we report such maps for the states labeled A–D in Fig. 1. Figure 3 shows for each of the chosen energies the constant-density isosurface (upper row) and the conductance map (lower row). The former has been obtained by integrating the lesser Green’s function over a small energy interval of 20 meV centered around the energies , , , and in order to get the charge density in terms of the local atomic orbitals. The constant-density isosurfaces show that all four states are delocalized over the whole clusters. However, their shapes differ, in particular at the upper facet.
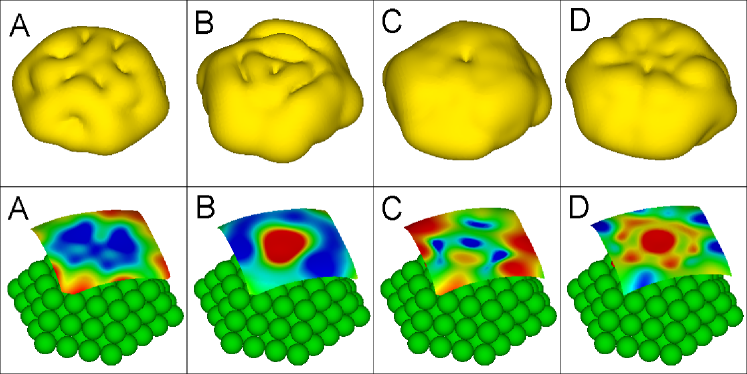
A much clearer picture of these different structures emerges from the conductance maps, shown in the lower row of Fig. 3. These maps display as a contour plot the conductance on a constant-current isosurface determined by the implicit equation . In the calculations, the tip was moved on a three-dimensional finite-element mesh with a grid spacing of 0.5 Å. At each grid point the current and the conductance were computed, and the constant-current isosurface was obtained by interpolation. Having this three-dimensional topographic image of the cluster we render conductance maps by showing the calculated values with a colored contour plot on it. The obtained patterns are dominated by the three-fold symmetry of the clusters, which is, however, disturbed by the coupling to the supporting surface. The central minima (blue spots in online version, black spots in print version) of the patterns A and C clearly reveal the reason for the disappearance of the corresponding peaks in the measurement with the tip over the centre, cf. Fig. 1. Furthermore, it becomes clear that placing the tip a few Å off the center leads to considerable changes in the conductance of these peaks. This may explain the observed discrepancies in the spectra obtained from measurements performed on the same cluster but at different times hoba06 .
Summarizing, we have shown that recent data from STS measurement of metallic clusters at surfaces can be understood only in terms of non-equilibrium transport calculations. The calculated current and conductance, respectively, depend crucially on the tip shape. A sharp tip is very selective, which explains the low number of states seen in the experiment compared to the richly structured DOS of the cluster. This selectivity depends strongly on the tip position, which leads to the requirement of a more complete experimental characterization based on energy-resolved imaging of the electronic states on the cluster lugr+0304 .
We acknowledge financial support by the Deutsche Forschungsgemeinschaft through the priority program SPP 1153 “Clusters in contact with surfaces: Electronic structure and magnetism”.
References
- (1) A. W. Castleman, Jr. and P. Jena, Proc. Natl. Acad. Sci. 103, 10552 (2006), special issue on Cluster Chemistry and Dynamics.
- (2) N. Nilius, N. Ernst, and H.-J. Freund, Phys. Rev. Lett. 84, 3994 (2000).
- (3) H. Häkkinen, M. Moseler, O. Kostko, N. Morgner, M. Astruc Hoffmann, and B. von Issendorff, Phys. Rev. Lett. 93, 093401 (2004).
- (4) M. Valden, X. Lai, and D. W. Goodman, Science 281, 1647 (1998).
- (5) U. Heiz and W.-D. Schneider, J. Phys. D 33, R 85 (2000).
- (6) K. Bromann, C. Félix, H. Brune, W. Harbich, R. Monot, J. Buttet, and K. Kern, Science 274, 956 (1996).
- (7) T. Irawan, D. Boecker, F. Ghaleh, C. Yin, B. von Issendorff, and H. Hövel, Appl. Phys. A 82, 81 (2006).
- (8) A. Bettac, L. Koller, V. Rank, and K. H. Meiwes-Broer, Surf. Sci. 404, 475 (1998).
- (9) H. Hövel, B. Grimm, M. Bödecker, K. Fieger, and B. Reihl, Surf. Sci. 463, L 603 (2000).
- (10) I. Barke and H. Hövel, Phys. Rev. Lett. 90, 166801 (2003).
- (11) H. Hövel and I. Barke, Prog. Surf. Sci. 81, 53 (2006).
- (12) J. Tersoff and D. R. Hamann, Phys. Rev. Lett. 50, 1998 (1983); Phys. Rev. B 31, 805 (1985).
- (13) K. Hørup Hansen, T. Worren, S. Stempel, E. Lægsgaard, M. Bäumer, H.-J. Freund, F. Besenbacher, and I. Stensgaard, Phys. Rev. Lett. 83, 4120 (1999).
- (14) M. De Menech, U. Saalmann, and M. E. Garcia, Appl. Phys. A 82, 113 (2006).
- (15) G. M. Wang, J. J. BelBruno, S. D. Kenny and R. Smith, Surf. Sci. 541, 91 (2003).
- (16) M. Tsukadsa et al., chapter 5 of Scanning Tunneling Microscopy III, R. Wiesendanger and H.-J. Güntherodt (eds.) Springer Berlin 1996.
- (17) S. Datta, Electronic Tranpsort in Mesoscopic Systems. Cambridge University Press 1995.
- (18) M. Brandbyge, J.-L. Mozos, P. Ordejón, J. Taylor, and K. Stokbro, Phys. Rev. B 65, 165401 (2002).
- (19) M. Elstner, D. Porezag, G. Jungnickel, J. Elsner, M. Haugk, T. Frauenheim, S. Suhai, and G. Seifert, Phys. Rev. B 58, 7260 (1998).
- (20) M. De Menech, U. Saalmann, and M. E. Garcia, Phys. Rev. B 73, 155407 (2006).
- (21) Energy-resolved imaging has already been demonstrated experimentally for C60 in: X. Lu, M. Grobis, K. H. Khoo, S. G. Louie, and M. F. Crommie, Phys. Rev. Lett. 90, 096802 (2003); Phys. Rev. B 70, 115418 (2004).