Valence Instability and Superconductivity in Heavy Fermion Systems
Abstract
Many cerium-based heavy fermion (HF) compounds have pressure-temperature phase diagrams in which a superconducting region extends far from a magnetic quantum critical point. In at least two compounds, CeCu2Si2 and CeCu2Ge2, an enhancement of the superconducting transition temperature was found to coincide with an abrupt valence change, with strong circumstantial evidence for pairing mediated by critical valence, or charge transfer, fluctuations. This pairing mechanism, and the valence instability, is a consequence of a Coulomb repulsion term in the hamiltonian. While some non-superconducting Ce compounds show a clear first order valence instability, analogous to the Ce transition, we argue that a weakly first order valence transition may be a general feature of Ce-based HF systems, and both magnetic and critical valence fluctuations may be responsible for the superconductivity in these systems.
1 Introduction
A resurgence of interest in heavy fermion (HF) superconductivity in the last few years has been strongly driven by the discovery of a large number of new Ce and U based intermetallic superconductors. Most analyses of their behaviour have focused on the relationship between superconductivity and magnetism, specifically on the idea that superconductivity in these systems is mediated by low energy magnetic fluctuations around a so-called magnetic quantum critical point (QCP), where a magnetic ordering temperature is driven to zero by an external parameter such as pressure or chemical substitution.
The aim of this article is to draw attention to another phenomenon in Ce compounds, namely a weakly first order valence instability also capable of generating superconductivity. In this case the pairing is mediated by the exchange of critical valence, or charge-transfer, fluctuations (CVF)[1]. It is the view of the authors that this scenario is of widespread importance, and must be taken into account for a complete understanding of the behaviour of all Ce-based HF compounds. We emphasise the heavy fermion nature of these superconductors; those Ce compounds in which the f-electrons play little role in their superconductivity do not concern us for the purposes of this discussion.
We will start by a brief description of the superconducting pressure-temperature phase diagram of all known Ce-based HF superconductors, followed by a discussion of the first order valence transition found in pure Cerium and a few other of its compounds. After reviewing the theoretical basis for CVF-mediated superconductivity, we will look at one compound in particular, CeCu2Si2, and show that there is very strong evidence for such a mechanism in this system, and in its isoelectronic sister compound CeCu2Ge2. Finally, we will discuss to what extent there is evidence for similar behaviour in other compounds.
2 Pea versus Potato
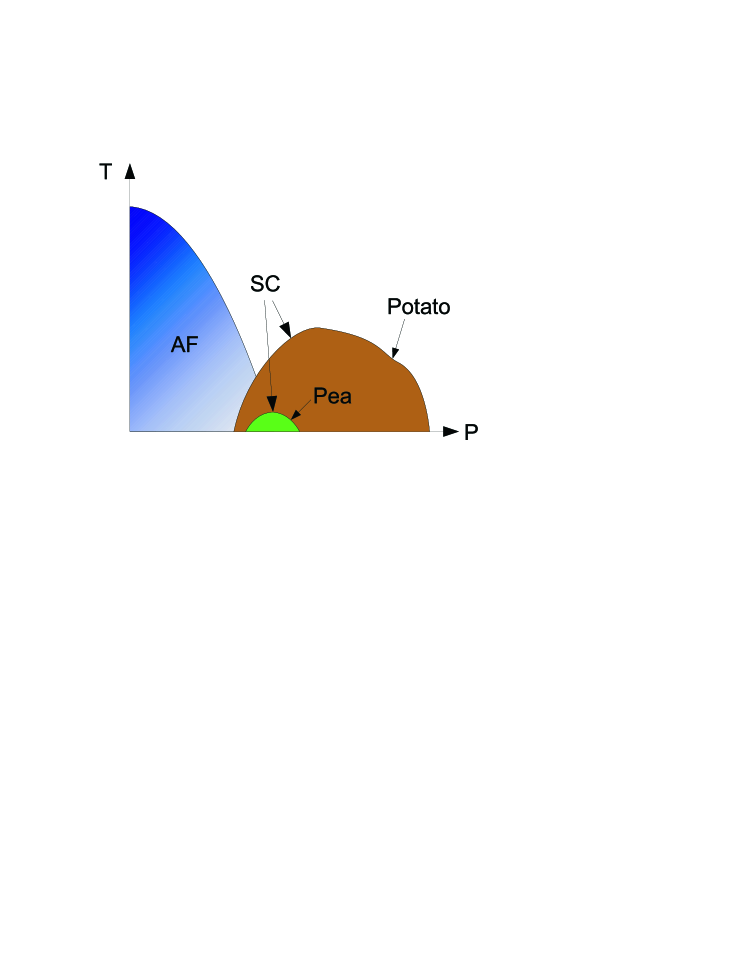
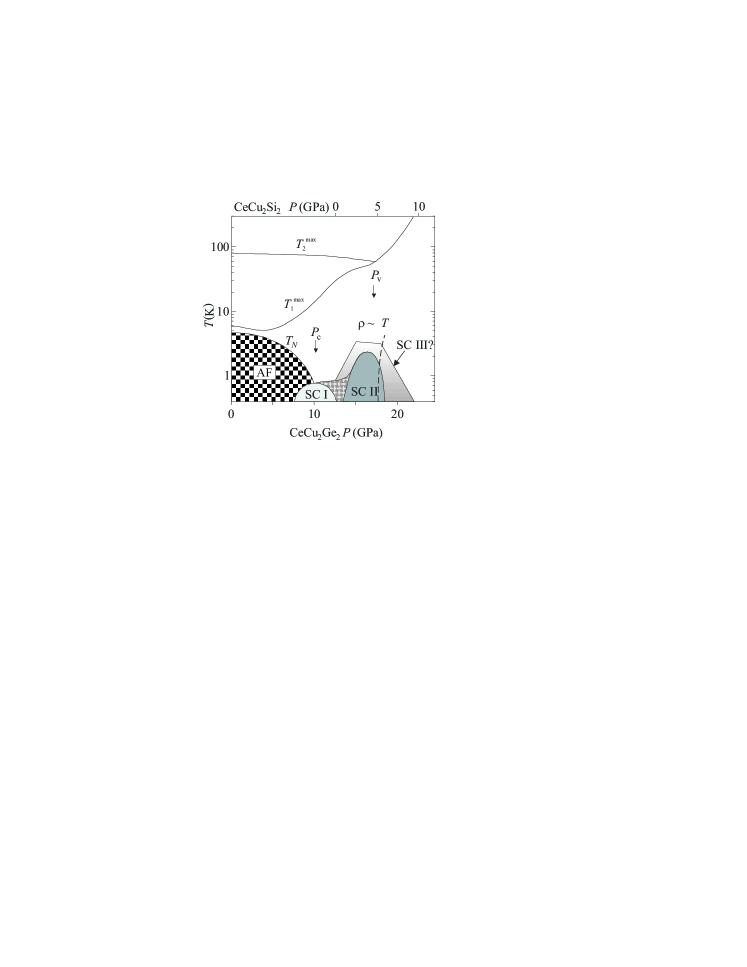
We can divide Ce-based HF superconductors into two categories, characterised by the shape of their superconducting region in the pressure-temperature phase diagram. We will call these two categories ‘pea’ and ‘potato’ (Fig. 1).
The first category contains those which show a small dome of superconductivity, typically with a pressure width of less than or equal to 1 GPa, symmetrically situated around the pressure where the Néel temperature tends to zero. This type of phase diagram is expected in a spin fluctuation mediated scenario, where the spin susceptibility diverges at the critical pressure , and the coherence length of the Cooper pairs increases with . When is less than the mean free path , superconductivity can occur, leading to a dome-shaped superconducting region around (small and round, like a pea).
In the second category, the ‘potatoes’, are compounds whose superconducting pressure domains are much less regularly shaped, typically having a higher maximum , which may not be situated exactly at . Superconductivity in these compounds can be found over a much broader pressure range than in the previous category, often extending far from .
| ‘Pea’ | ‘Potato’ |
|---|---|
| CeIn3[7], CePd2Si2[7], | CeCu2Si2[8], CeCu2Ge2[9],CeNi2Ge2[10], |
| CeRh2Si2[11], CeCu5Au*[12] | CeCoIn5[13], CeRhIn5[14], CeIrIn5[14], |
| CeCu2*[15] | Ce2RhIn8[16], CeNiGe3[17], |
| CePt3Si[18], CeRhSi3[19], CeIrSi3[20] |
Table 1 shows the classification of the known Ce-based HF superconductors for which sufficient data under pressure exist. Remarkably enough, the ‘potatoes’ outnumber the ‘peas’ by quite a considerable margin. The phase diagrams were mostly determined by resistivity. In CePd2Si2 for example, bulk superconductivity was found by specific heat measurements only at exactly [2].
In the spin-fluctuation scenario, the scale of is set by the characteristic spin-fluctuation temperature . In addition, it has been suggested with respect to the Ce115 compounds CeCoIn5, CeRhIn5, and CeIrIn5, that the enhancement of compared to CeIn3 is due to the quasi-two dimensional character of these compounds[3, 4, 5]. Considerations of dimensionality are almost certainly very important, but they do not resolve the question of the nature of the pairing mechanism, since the effect applies both to magnetic and density fluctuation mediated superconductivity [6].
We emphasise again that in seeking an explanation for the irregularly shaped superconducting regions found in the majority of Cerium-based HF superconductors, magnetic fluctuations and dimensionality are not the only items on the menu. Before considering a purely magnetic scenario, one must at least rule out the influence of critical valence fluctuations.
3 Local versus Itinerant Cerium f Electron
The behaviour of Ce and its compounds is dominated by its single 4f electron. It is rather loosely bound, and can easily be promoted into the conduction band leaving a non-magnetic Ce4+ ion, which has a smaller ionic radius than the Ce3+ ion. Pressure therefore tends to favour a Ce4+ configuration.
In the Ce3+ (trivalent) state the f electron is localised and carries a magnetic moment, which can order magnetically, or be screened by conduction electrons via the Kondo effect. In the trivalent state, pressure increases the coupling between the f and conduction electrons, which tends both to promote the formation of a Kondo-Yosida singlet, and to encourage magnetic ordering via the RKKY effect. The Kondo effect increases more rapidly with , so the overall effect is for magnetic order to be eventually suppressed, leading to the aforementioned magnetic QCP where the ordering temperature reaches zero.
Ce compounds at a given pressure can be classified by the nature of the f-electron into two categories, often referred to as the Kondo and valence fluctuation regimes respectively:
-
1.
Ce3+, 4f1 localised. Magnetic moment possibly ordered and/or (partially) screened by Kondo effect. Kondo temperature K. Properties corresponding to a strongly correlated electron system. Kadowaki-Woods ratio[21] cm mol2K2/J.
-
2.
Ce(3+δ)+, 4f4f0+[5d6s], itinerant. larger than or comparable to crystalline electric field (CEF) splitting. No magnetic order. Intermediate valence. Kadowaki-Woods ration cm mol2K2/J.
3.1 Ce transition
Cerium metal is well known for the first-order isostructural volume discontinuity, known as the transition, in its pressure-temperature phase diagram. This corresponds to a delocalisation of the Ce 4f electron, as described above. In pure Ce, the transition itself is strongly first order, with a large hysteresis, and a critical end point at rather high temperature, around 600 K and 20 kbar, with a large experimental uncertainty due to the nature of the transition[22].
3.2 First order transition in cerium compounds
There are a small number of Ce compounds which also show a first order valence transition, including CeNi[23], CeP[24], Ce0.74Th0.26[25] Ce(Rh0.69Ir0.31)Ge[26]. See also ref. \citenSvane01 and refs therein for a discussion of first order transitions in Ce, Yb and Eu chalcogenides and pnictides. These compounds are all notable for containing a high atomic percentage of Ce, and hence a small Ce-Ce interatomic separation. None of them display heavy fermion superconductivity.
4 Theory of Valence Transition and Critical-Valence-Fluctuation Mediated Superconductivity
The idea of CVF-mediated superconductivity and related anomalous phenomena can be backed up by a microscopic calculations on the basis of a generalized periodic Anderson model (GPAM)[1]:
| (1) | |||||
where notations are conventional except for , the local Coulomb repulsion between f- and conduction electorns, which is a crucial ingredient for a sharp valence transition.
4.1 Critical-valence-fluctuation mediated superconductivity
In ref. \citenOnishi00, the model Hamiltonian (1) with a spherical conduction band (i.e., , where is the Fermi energy of conduction electrons if it were decoupled from f-electrons) was treated by the mean-field (MF) approximation in the slave bosons formalism (with ) to discuss the possibility of valence transition, and by the Gaussian fluctuation theory around the mean-field solution to discuss a possible superconducting state. As shown in Fig. 2, the central results of ref. \citenOnishi00 are summarized as follows:
-
1)
Sharp valence change is caused by the effect of with moderate strength, of the order of the Fermi energy () of conduction electrons, when the f-level is tuned to mimic the effect of the pressure.
-
2)
The superconducting state is induced by the process of exchanging slave-boson fluctuations for the values of around which the sharp valence change occurs.
-
3)
The symmetry of the induced superconducting state is -wave if a spherical model is adopted for conduction electron. However, as seen in the argument below, anisotropic pairing is induced by the CVF modes due to their almost local nature.
The peak of occurs at slightly smaller than that corresponding to the steepest slope of vs relation, where denotes f-electron number per site and “spin”. Since simulates the pressure variation, this aspect of the pressure dependence of reproduces well that observed experimentally in CeCu2Ge2 under pressure [9]. It is also remarked that a sharp change of is related to that of the mass enhancement by a canonical relation in strongly correlated limit:[28, 29]
| (2) |
which in turn implies a drastic decrease of the coefficient of the -term of the resistivity , because is proportional to [21, 30].

The -dependence of is smooth without , while its dependence becomes steep as is increased to a moderate strength of . These results are consistent with a physical picture that the rapid valence change occurs at the condition (the Fermi energy of the -state) where the energy of the - and -state are degenerate, leading to enhanced valence fluctuations. For much larger values of or smaller values of than those presented in Fig. 2, there occurs a first-order like discontinuous transitions although they are not shown here. However, the valence change occurs more sharply if we treat the problem in much more proper approximation on the extended Gutzwiller variational wave function [31].
It is remarked that can exist only for the -wave () channel as far as the channels, and , are concerned. There exists a sharp peak of at around where starts to show a rapid decrease. Its tendency becomes more drastic as increases, making the valence change sharper. In the region where the f-electron number is decreased enough, is strongly suppressed. This suggests that the CVF associated with the sharp valence change of Ce ions is the origin of the pairing.
The pairing interaction ( with q) is calculated by taking into account the Gaussian fluctuations of slave bosons around the MF solution as mentioned above. The result is shown in Fig. 3 for the parameter set and [1]. One can see clearly that the scattering process (f,f)(f,c) or (f,c)(f,f), in which the valence of f-electrons is changed, plays a dominant role. It is also remarked that is almost -independent up to , reflecting the local nature of the valence transition.

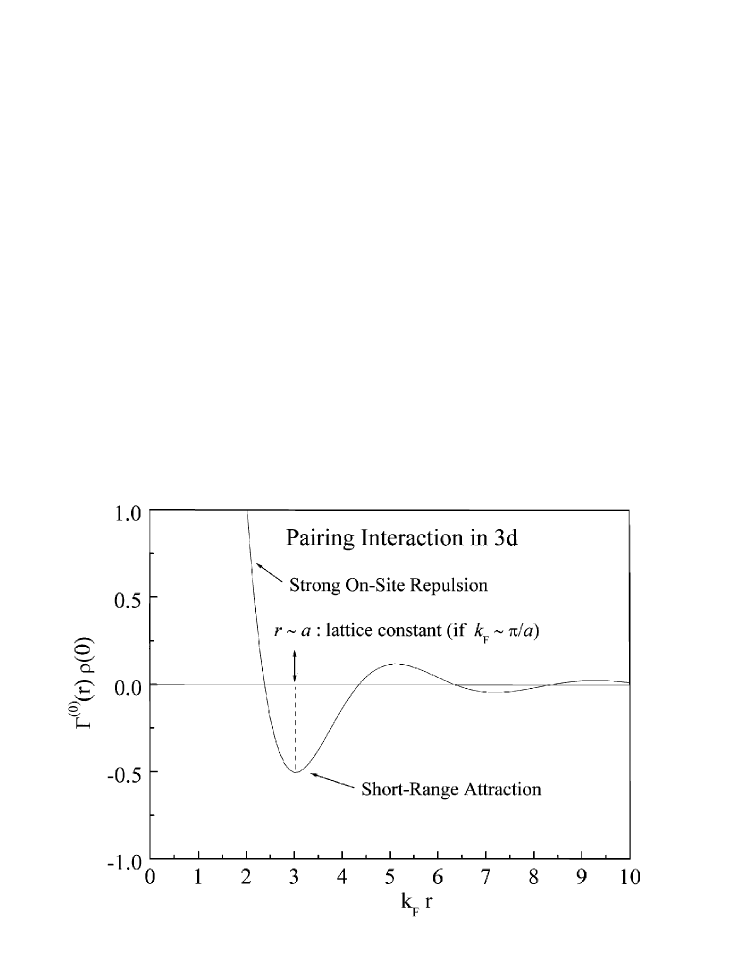
The reason why -wave pairing can be realized is understood in the following way. While is always positive and almost constant at , giving a short-range strong repulsion, the sharp decrease at gives an extended attraction, leading to pairing of non-zero angular momentum, such as and . One can see this more vividly by inspecting a real space picture of the pairing interaction
| (3) |
The result for is shown in Fig. 4 for the same parameter set as Fig. 3. This clearly shows an existence of the extended attraction together with the on-site strong repulsion. If we assume , being the lattice constant as in typical metals, the attraction works between nearest neighbor sites. Then, according to the discussion in ref. \citenMSRV, pairing of -wave symmetry is promoted. Pairing with -wave symmetry is also possible in principle in this case because the attraction mediated by the valence fluctuation has no spin dependence.
Quite recently, Watanabe et al. [33] reported results on the density-matrix-renormalisation-group analysis for the one-dimensional (1d) version of the model Hamiltonian (1) in which the conduction band is given as
| (4) |
where is the nearest-neighbour hopping integral. For an electron number 7/4 per site, and , a first order valence-transition line in - plane has been determined, showing that the region of uniform phase is stabilized and phase separation is suppressed due to quantum fluctuations. By analysis of the exponent of the long-range behaviour of correlation functions of inter-site pairing, it has been shown that superconducting correlations become dominant against charge and spin density wave correlations near the QCP of the valence transition in the region of uniform phase. This result supports the overall picture of CVF-mediated unconventional superconductivity discussed in ref. \citenOnishi00.
4.2 -linear resistivity and enhanced Sommerfeld coefficient
Here we briefly discuss how a critical behavior of the resistivity and the specific heat arises around the critical valence transition at . The local nature of the pairing interaction can be seen also in the CVF spectrum. By exploiting this nature, the valence fluctuation propagator (dynamical valence susceptibility) may be parameterized as
| (5) | |||||
| (6) |
where is the Fourier component of the number of f-electrons per Ce site, and the parameter parameterizes the closeness to criticality. is inversely proportional to the valence susceptibility .
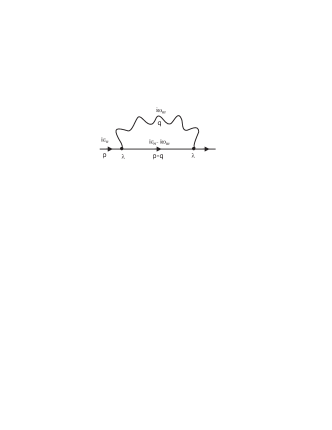
With the use of the propagator (6), it is a
straightforward calculation to obtain a self-energy of quasiparticle due to one
CVF exchange process shown in Fig. 5.
It is reduced to simple forms in typical limiting cases as follows:
In the case , , being the effective quasiparticle Fermi energy,
| (7) |
where is the Fermi momentum, and in the case and ,
| (8) | |||||
where is the Fermi velocity of quasiparticles, and has been used.
The result of eq. (7) for implies that almost all the critical valence-fluctuation modes can be regarded as classical at , leading to the -linear resistivity, because the quasiparticles are subject to large angle scattering by the CVF modes which are effective in a wide region in the Brillouin zone through the Umklapp process.
Moreover, eq. (8) implies that an extra enhancement of the Sommerfeld coefficient is expected other than that of quasiparticles. Namely, where is the Sommerfeld coefficient enhanced by the local correlation given by eq. (2). is a sharply decreasing function of the pressure (or ) around while a factor has a sharp peak at . Then the resultant at low temperature should exhibit a sharp structure around .
4.3 Enhanced residual resistivity
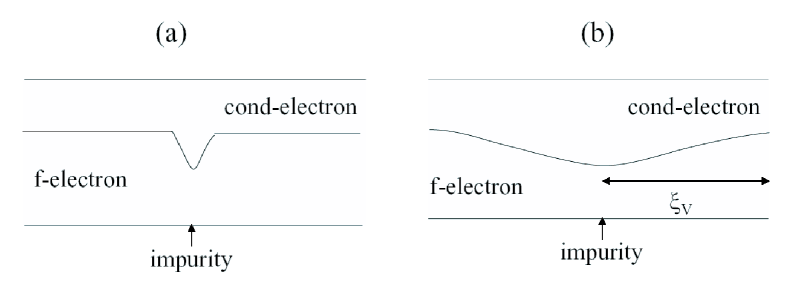
The CVF can give rise to huge enhancement of the residual resistivity at around through a many-body effect on the impurity potential. In the forward scattering limit, this enhancement is proportional to the valence susceptibility , where is the atomic f-level of the Ce ion, and is the chemical potential [34]. Physically speaking, local valence change coupled to the impurity or disorder gives rise to the change of valence in a wide region around the impurity which then scatters the quasiparticles quite strongly, leading to the increase of (see Fig. 6). Thus the enhancement of can be directly related to the degree of sharpness of the valence change because the variation of the atomic level is considered to be a smooth function of the pressure. The critical pressure is indeed defined by the maximum of .
It is remarked that there are two kinds of impurity potential for quasiparticles consisting mainly of f-electrons: One is due to the disorder of non-f elements and another is due to the defect of Ce ions. The former gives essentially the Born scattering, while the latter causes the scattering in the unitarity limit. Then the residual resistivity is expressed as
| (9) |
where is subject to huge enhancement by the CVF and is essentially unaffected. Then, eq. (9) is expressed as
| (10) |
where is the concentration of impurities with scattering potential , and the coefficient depends on the band structure of the host metals. The first term of eq. (10) exhibits a huge enhancement at the critical valence transition point where diverges. This huge enhancement should be compared to the moderate enhancement around the magnetic quantum critical point where the enhancement arises only through the renormalization amplitude , as discussed in ref. \citenMiyake02b.
5 CeCu2Si2
The first heavy fermion superconductor to be discovered, CeCu2Si2, is the archetypical ‘potato’. It has a very irregularly shaped superconducting region under pressure, with a large enhancement of at around 3 GPa, well away from the antiferromagnetic QCP, which is thought to be at a small positive pressure of approximately 0.1 GPa [36]. CeCu2Si2 has been the subject of intensive study by the authors, in which we showed that the enhancement of under pressure was linked to a sharp Ce valence transition[37, 8, 38, 39, 40, 41, 42].
The link between superconductivity and valence change had been noted by Jaccard and coworkers since the first measurements of CeCu2Si2 under high pressure in 1984 [43]. The isostructural sister compound CeCu2Ge2 was shown to behave in a very similar way, with a shift of around 10 GPa corresponding to the larger atomic size of Ge[44, 9].
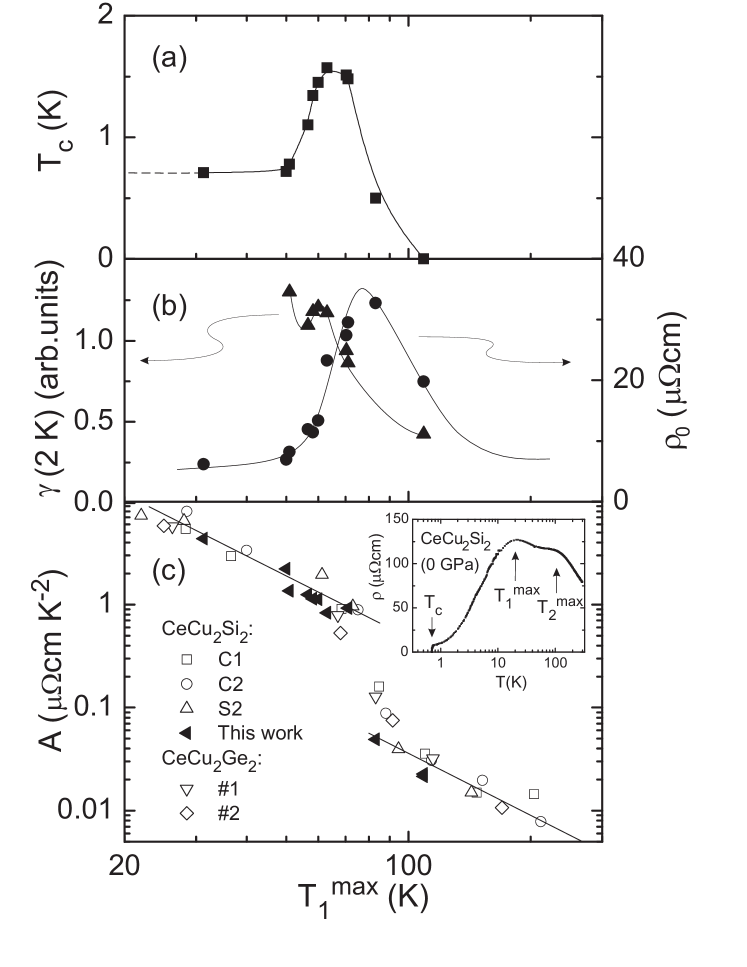
Strong evidence for a sharp valence transition in CeCu2Ge2 was presented by Vargoz et al.[45, 9]. They showed that the coefficient of a Fermi-liquid fit to the resistivity , when plotted against the low-temperature maximum in resistivity showed the expected relationship in two regions, with a rapid crossover between them. As , where is the electronic specific heat coefficient, this corresponds to a crossover from the strongly correlated to weakly correlated branch of the Kadowaki-Woods plot[30]. The maximum in seemed to correspond to the position of this crossover.
Motivated by these results, and by theoretical predictions by Miyake and coworkers[46, 1], we (ATH and DJ) carried out detailed measurements of resistivity and specific heat (by the ac calorimetry method) on a single crystal sample of CeCu2Si2 in a solid helium pressure medium up to nearly 7 GPa[8]. The use of helium ensures the most hydrostatic possible conditions at low temperature, a feature of crucial importance given the rapidly changing behaviour of CeCu2Si2 with pressure. Simultaneous measurements of resistivity and specific heat enabled us to verify the bulk nature of the superconductivity in the high pressure region, and identify the most reliable criterion for defining .
We identified a pressure , at about 4.5 GPa, which corresponds to a valence critical pressure. Around this point there are a series of anomalies associated with a delocalisation of the Ce 4f electron. is slightly above the pressure where reaches a maximum, according to both the theoretical prediction and our observations.
5.1 Indications of a Valence Instability
The drastic decrease of the coefficient of resistivity, and its change of scaling with respect to are clear signs of the transition from a strongly correlated to weakly correlated regime. Table 2 shows the complete list of anomalies found around the valence instability in CeCu2Si2 and CeCu2Ge2. Fig. 7 shows how the enhancement of , and the anomalies in and correspond to the change from a strongly to weakly correlated regime.
Part (i): Direct evidence for sudden valence change.
Part (ii): Anomalies explained theoretically by the GPAM[1, 34, 8] (4).
Part (iii): Other anomalies observed around crossover to intermediate valence with pressure.
| CeCu2Si2 | CeCu2Ge2 | ||
| Ref. | Ref. | ||
| (i) | Volume discontinuity | - | \citeonlineOnodera02 |
| X-ray absorption | \citeonlineRoehler88 | - | |
| Drastic change of by two orders of magnitude | \citeonlineHolmes04a,\citeonlineJaccard99 | \citeonlineJaccard99 | |
| Change of scaling | \citeonlineHolmes04a,\citeonlineJaccard99 | \citeonlineJaccard99 | |
| (ii) | Maximum in | \citeonlineHolmes04a,\citeonlineBellarbi84 | \citeonlineVargoz98b |
| Large peak in | \citeonlineHolmes04a,\citeonlineJaccard99 | \citeonlineJaccard99 | |
| Maximum in | \citeonlineHolmes04a,\citeonlineVargoz98 | - | |
| from , with minimum | \citeonlineHolmes04a,Bellarbi84,Jaccard85 | \citeonlineJaccard99 | |
| (iii) | Sample dependence of | \citeonlineHolmes04a,Holmes05b,Bellarbi84,Thomas96,Thomasson98,Jaccard98,Jaccard99,VargozPhD | \citeonlineJaccard99 |
| Enhanced | \citeonlineHolmes04a | - | |
| Resistivity and thermopower indicate | \citeonlineJaccard99,Jaccard85 | \citeonlineJaccard99,Link96 | |
| Broad superconducting transition widths | \citeonlineHolmes04a,Holmes05b,Bellarbi84 | \citeonlineJaccard99 |
5.2 CeCu2(Si1-xGex)2
The existence of a second quantum critical point at high pressure in CeCu2Si2 was given further backing by Yuan et al.[56]. They doped the pure CeCu2Si2 system with Ge (effectively applying negative pressure and introducing disorder) and then applied pressure to come back along the pressure/volume axis. For increasing proportions of Ge, the superconductivity was weakened, and for large enough the superconducting region could be split into two domes, near and respectively.
5.3 Valence fluctuation mediated superconductivity in CeCu2Si2
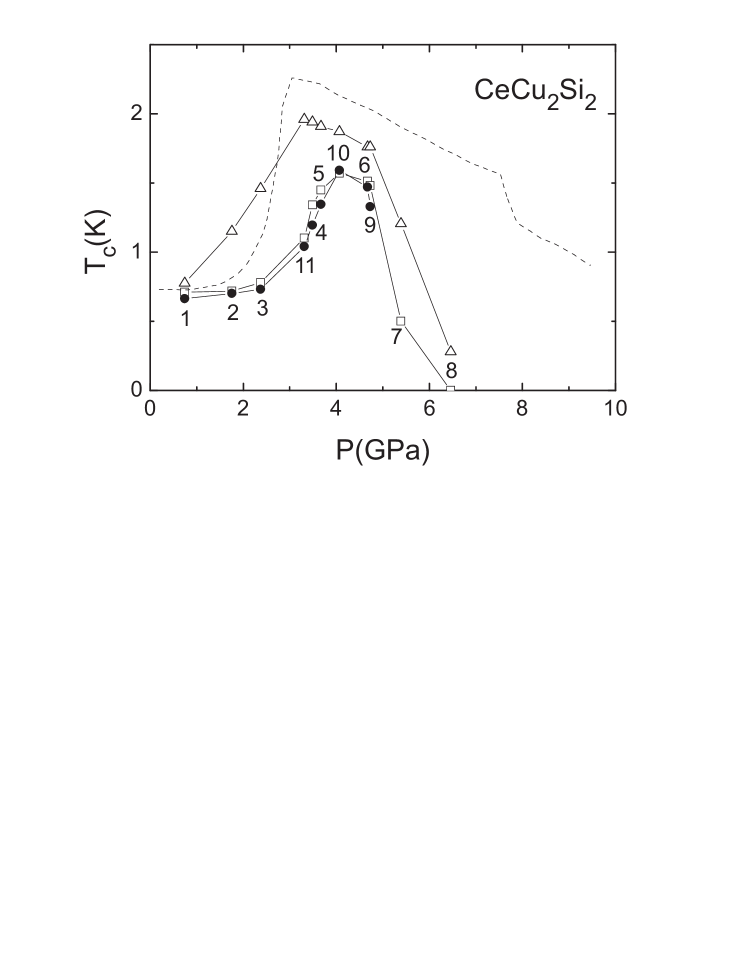
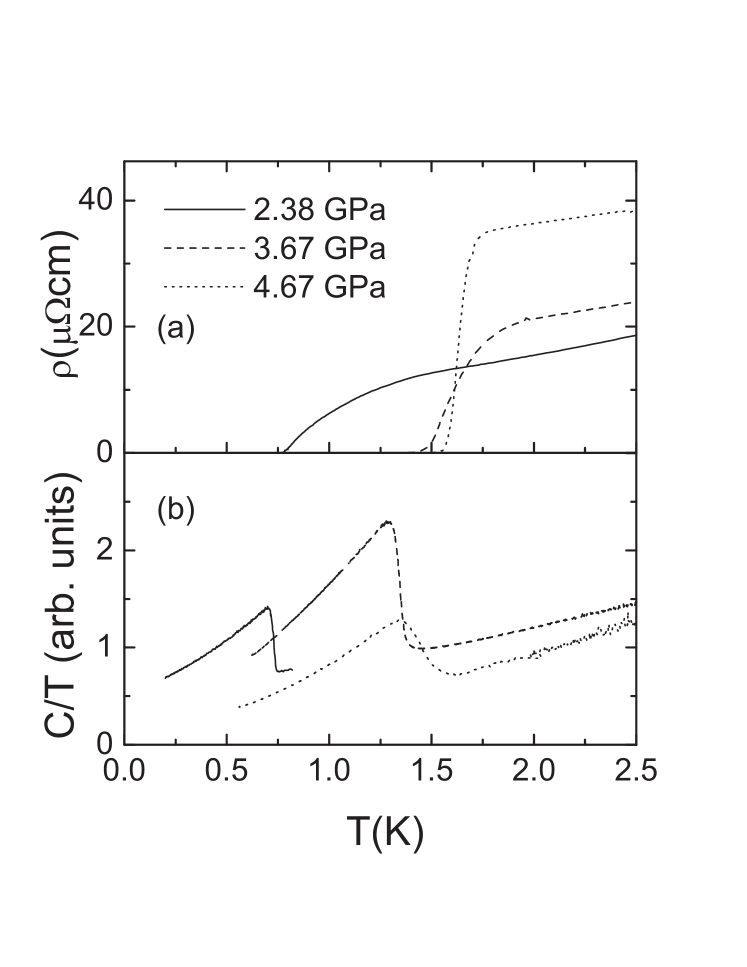
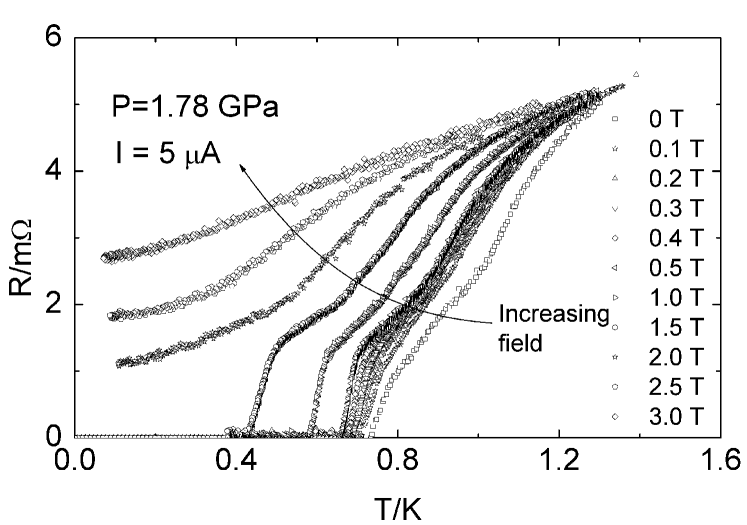
Figure 8 shows the pressure variation of the superconducting transition temperature in CeCu2Si2 determined by specific heat and resistivity. It is clear from this, and Fig. 9, that the bulk transition temperature determined from the specific heat coincides with the point at which the resistance reaches zero. Over a large pressure range the resistive transitions are very broad. This is often attributed to pressure gradients in the cell; in this case, however, as a helium medium was used the gradients should be negligible.
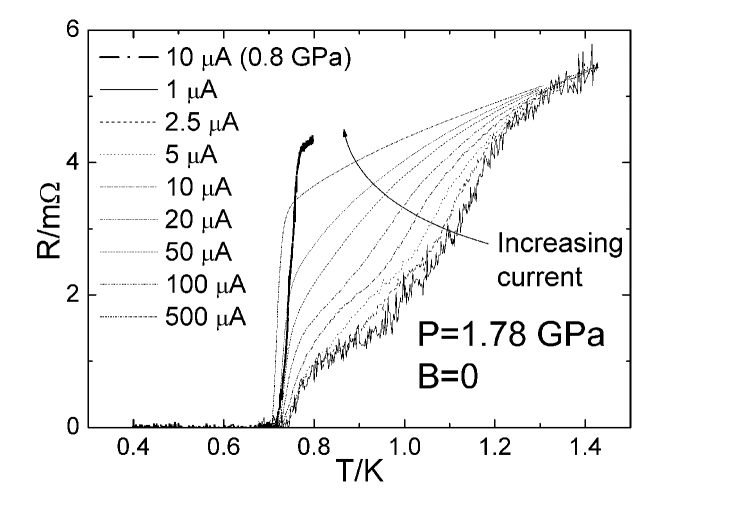
The nature of the broad resistive transitions was investigated in detail at 1.78 GPa as a function of measurement current and magnetic field, as shown in Figs. 10 and 11. Remarkably, the high temperature part of the resistance drop disappears completely as the current is increased, recovering a sharp transition. Applying a magnetic field has the opposite effect; the low temperature part of the transition is rapidly suppressed with field, while the upper part remains up to much higher fields. There appear to be two distinct transitions, with different ’s and hence critical fields. The current dependence implies that the ‘high ’ superconductivity is of a filamentary nature, so its critical current density is easily exceeded. We should note that even the best samples, with the highest values of , showed very broad resistive transitions at certain pressures.
The enhancement of the residual resistivity at will be discussed in more detail below, but it reveals another remarkable feature of the high pressure superconductivity in CeCu2Si2. In certain samples of CeCu2Si2, the residual resistivity, while relatively large at ambient pressure, reaches enormous values approaching the Ioffe-Regel limit around , i.e. the mean free path is of the order of the lattice spacing.
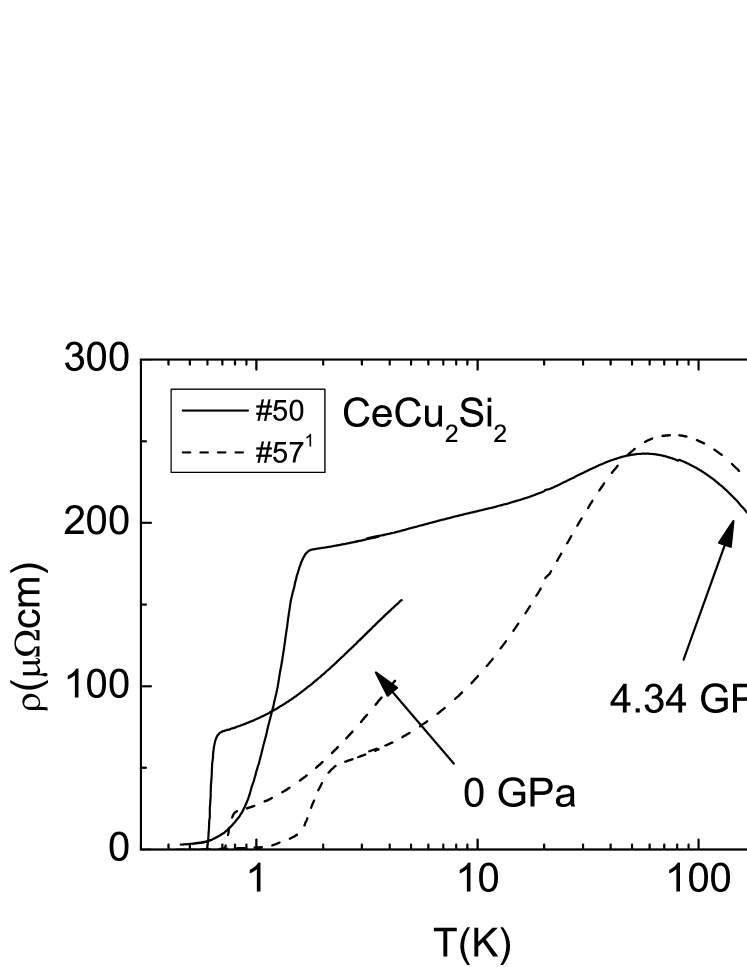
Magnetically mediated superconductors such as CePd2Si2 are notoriously dependent on sample quality, superconductivity only appearing in the purest samples with very small values of , of the order of a few cm. Fig. 12 shows two CeCu2Si2 samples with very different residual resistivities, in which a nearly complete resistive transition can be seen at 4.34 GPa despite a residual resistivity of nearly 200cm around . This is probably the most compelling evidence for a new mechanism of superconductivity at high pressure in CeCu2Si2.
The superconducting transition temperature and pressure range is highly sensitive to small uniaxial stresses. We investigated this effect by placing single crystal samples from neighbouring positions on the same source crystal in a Bridgman anvil cell with their tetragonal -axis parallel and perpendicular to the force loading direction. As this technique uses a solid steatite pressure medium, there remains some non-hydrostatic component to the stress inside the cell, which can be exploited as a qualitative control parameter. We showed[39] that there is a significant difference in between the two orientations, and that is shifted to a higher pressure in the case where the force loading direction is perpendicular to the -axis. This shows from an experimental point of view that any considerations related to the anisotropy of a system must also be taken into account in the case of CVF-mediated superconductivity.
5.4 Normal state properties of CeCu2Si2 around
Three key properties of the normal state in CeCu2Si2 show characteristic behaviour at the valence instability : the residual resistivity , the power-law behaviour of the T-dependence of the resistivity, and the Sommerfeld coefficient of the electronic specific heat capacity . These will be discussed in the next section.
A key prediction of the GPAM is the enhancement of impurity scattering around the valence instability discussed in 4.3. This can be thought of as an impurity nucleating a change of valence in the Ce atoms surrounding it, thereby inflating its scattering cross-section, and hence the residual resistivity, as given by eq. (10).
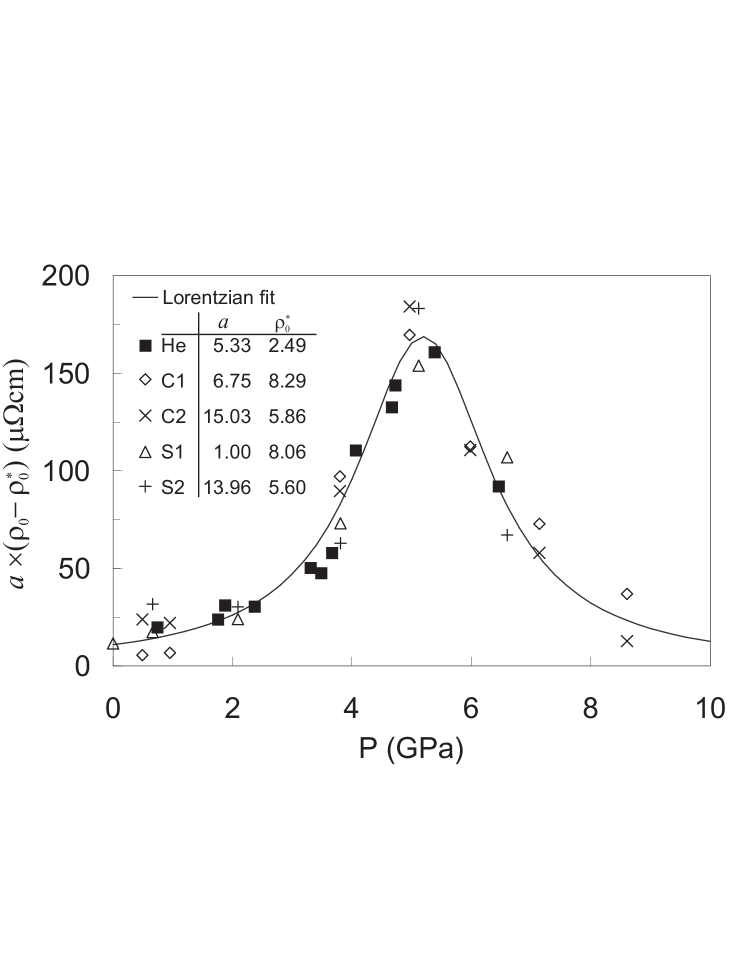
Fig. 13 shows the pressure dependence of in a number of different CeCu2Si2 samples, which can all be scaled on to the same Lorenzian curve by a simple linear transformation. This scaling behavior of would be possible if the universal form is given by .
It should be noted that the impurity contribution to the resistivity has a negative temperature dependence, a fact especially evident at very high pressure where the -coefficient of the resistivity becomes small. Even in samples with a small this can cause problems when fitting power laws to the resistivity in the region above .
Due to the localised nature of the critical valence fluctuations, the quasiparticle scattering is nearly -independent, leading to a linear resistivity, implied by eq. (7). Fig. 14 shows the resistivity at a pressure very close to , where a strictly linear temperature dependence is observed over a broad temperature range.

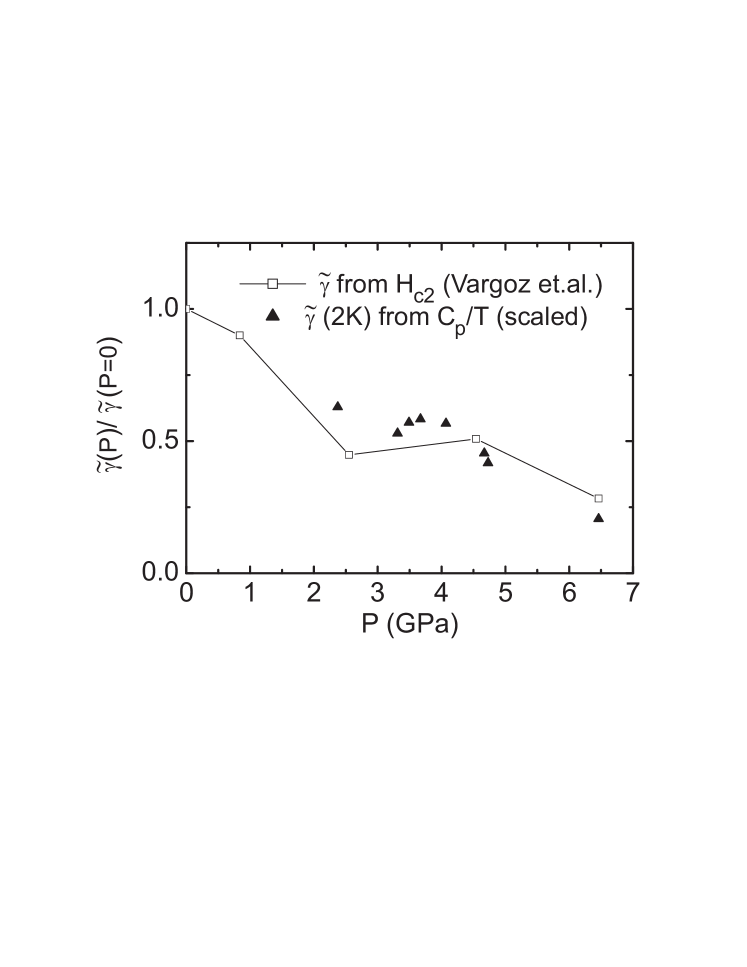
The electronic specific heat coefficient , and hence the effective mass , can be estimated by following the calorimetric signal , at a fixed temperature and measurement frequency above the superconducting transition, though this includes constant or slowly varying addenda from the helium, diamonds etc. Figure 15 shows the estimate , along with the value deduced from measurements of the upper critical field[50]. A single constant scale factor has been introduced, showing that the two curves can be superimposed. There is a clear anomaly in at 4 GPa (just below the pressure corresponding to ), superimposed on a constant reduction with pressure. The effective mass is also reflected in the initial slope of the upper critical field , which in our sample also had a maximum at the same pressure as the peak in . Equation (8) implies an enhancement of at due to critical valence fluctuations; combined with a monotonic reduction in effective mass due to the rapid change of with pressure, this leads to a peak in observed slightly below .
6 Other Candidates for Critical Valence Fluctuation Mediated SC
After CeCu2Si2 and CeCu2Ge2, the next strongest candidates for CVF mediated superconductivity are probably the Ce115 compounds. Between them they show a number of the properties discussed above, namely linear resistivity in CeCoIn5[57], and linear resisity and a pressure-induced maximum of in CeRhIn5 [58, 59].
CeIrIn5 is probably the strongest candidate for a CVF mediated superconductor at ambient pressure. Pressure studies on CeRh1-xIrxIn5 have showed that the superconducting region can be split into two distinct pockets, with a cusp-like minimum of at around .[60]. 115In-NQR measurements of stoichiometric CeIrIn5 under pressure showed that while increased under pressure, reaching K at 3 GPa, more than twice its value at ambient pressure, the nuclear-spin-lattice-relaxation rate was found to decrease monotonically with pressure. This indicates that the antiferromagnetic spin fluctuations are decreasing with pressure, while the superconductivity is strengthening.
The cases of PuCoGa5[61] and PuRhGa5[62] are also very intriguing. They become superconducting at the comparatively high temperatures of 18 K and 9 K respectively. Pu metal itself has very rich phase diagram whose origin may be traced back to the fact that the 5f electrons in Pu are located near the boundary between the localized state with nearly an integral valence and the itinerant state with a fractional valence. There exists some circumstantial evidence to support the possibility of CVF-mediated superconductivity in these compounds. The ratio of the Pu115 compounds (cm mol2K2/J for PuCoGa5 [63]) lies between that of strongly and weakly correlated metals. This suggests that Pu115 compounds are not strongly correlated metals but depend on the valence fluctuations of the Pu ion, although the Sommerfeld coefficient [mJ/K2mol] is moderately enhanced.
There are other examples among the ‘potato’ compounds mentioned above, such as the two separate domes of superconductivity in the phase diagram of CeNi2Ge2, and broad resistive transitions and apparent enhancement of under pressure in CeNiGe3, but these have not been studied in so much detail.
In CeCu2Si2 and CeCu2Ge2 the two critical pressures and corresponding to the magnetic and valence instabilities are well separated. It may be the case in other systems, however, that , or even . There is a clear need for some sort of ‘smoking gun’ to distinguish between valence and magnetically mediated superconductivity. Both are predicted to be -wave, but knowledge of the precise gap symmetry, though very difficult to determine under pressure, may be the key to distinguishing these two mechanism.
7 Conclusions
Ce metal and a small number of its compounds show a first order valence transition in their pressure-temperature phase diagrams. We contend that an analogous first-order or nearly first order transition is present in many Ce compounds, and in certain circumstances, fluctuations around its critical end point can mediate superconductivity.
CeCu2Si2 has been shown almost unambiguously to have a region of superconductivity at high pressure mediated by such critical valence fluctuations, close to a valence instability at a pressure around 4.5 GPa. There are a number of anomalies in the normal state around this pressure which can be tied to an abrupt delocalisation of the Ce 4f electron.
A majority of the other known Ce-based HF superconductors have characteristics which cannot be explained purely in a spin fluctuation mediated scenario. The presence of a valence instability in these compounds may be quite general, and the key to a more complete understanding of their behaviour.
Acknowledgment
This work was supported by a Grant-in-Aid for Creative Scientific Research (15GS0213), a Grant-in-Aid for Scientific Research (Nos. 16340103 & 15204032), and the 21st Century COE Program (G18) by the Japan Society for the Promotion of Science.
References
References
- [1] Y. Onishi and K. Miyake: J. Phys. Soc. Jpn. 69 (2000) 3955.
- [2] A. Demuer, A. T. Holmes and D. Jaccard: J. Phys: Condens. Matter 14 (2002) L529.
- [3] M. Nicklas, R. Borth, E. Lengyel, P. G. Pagliuso, J. L. Sarrao, V. A. Sidorov, G. Sparn, F. Steglich and J. D. Thompson: J. Phys: Condens. Matter 13 (2001) L905.
- [4] P. Monthoux and G. G. Lonzarich: Phys. Rev. B 59 (1999) 14598.
- [5] P. Monthoux and G. G. Lonzarich: Phys. Rev. B 63 (2001) 054529.
- [6] P. Monthoux and G. G. Lonzarich: Phys. Rev. B 69 (2004) 064517.
- [7] N. D. Mathur, F. M. Grosche, S. R. Julian, I. R. Walker, D. M. Freye, R. K. W. Haselwimmer and G. G. Lonzarich: Nature 394 (1998) 39.
- [8] A. T. Holmes, D. Jaccard and K. Miyake: Phys. Rev. B 69 (2004) 024508.
- [9] D. Jaccard, H. Wilhelm, K. Alami-Yadri and E. Vargoz: Physica B 259–261 (1999) 1.
- [10] F. M. Grosche, P. Agarwal, S. R. Julian, N. J. Wilson, R. K. W. Haselwimmer, S. J. S. Lister, N. D. Mathur, F. V. Carter, S. S. Saxena and G. G. Lonzarich: J. Phys: Condens. Matter 12 (2000) L533.
- [11] R. Movshovich, T. Graf, D. Mandrus, J. D. Thompson, J. L. Smith and Z. Fisk: Phys. Rev. B 53 (1996) 8241.
- [12] H. Wilhelm, S. Raymond, D. Jaccard, O. Stockert, H. v. Loehneysen and A. Rosch: in Proc. AIRAPT-17, Hawaii, 1999 ed. M. Manghnani, W. Nellis and M. Nicol (Universities Press, Hyderabad, 2000) p. 697.
- [13] V. A. Sidorov, M. Nicklas, P. G. Pagliuso, J. L. Sarrao, Y. Bang, A. V. Balatsky and J. D. Thompson: Phys. Rev. Lett. 89 (2002) 157004.
- [14] T. Muramatsu, T. C. Kobayashi, K. Shimizu, K. Amaya, D. Aoki, Y. Haga and Y. Onuki: Physica C 388-389 (2003) 539.
- [15] E. Vargoza, P. Link, D. Jaccard, T. L. Bihan and S. Heathman: Physica B 229 (1996) 225.
- [16] M. Nicklas, V. A. Sidorov, H. A. Borges, P. G. Pagliuso, C. Petrovic, Z. Fisk, J. L. Sarrao and J. D. Thompson: Physical Review B (Condensed Matter and Materials Physics) 67 (2003) 020506.
- [17] H. Kotegawa, T. Miyoshi, K. Takeda, S. Fukushima, H. Hidaka, K. Tabata, T. C. Kobayashi, M. Nakashima, A. Thamizhavel, R. Settai and Y. Ōnuki: Physica B 378 (2006) 419.
- [18] M. Nicklas, G. Sparn, R. Lackner, E. Bauer and F. Steglich: Physica B 359 (2005) 386.
- [19] N. Kimura, K. Ito, K. Saitoh, Y. Umeda, H. Aoki and T. Terashima: Phys. Rev. Lett. 95 (2005) 247004.
- [20] I. Sugitani, Y. Okuda, H. Shishido, T. Yamada, A. Thamizhavel, E. Yamamoto, T. D. Matsuda, Y. Haga, T. Takeuchi, R. Settai and Y. Ōnuki: J. Phys. Soc. Jpn. 75 (2006) 3703.
- [21] K. Kadowaki and S. Woods: Solid State Commun. 58 (1986) 507.
- [22] D. G. Koskenmaki and K. A. Gschneidner, Jr.: in Handbook on the Physics and Chemistry of Rare Earths, edited by K. A. Gschneidner, Jr. and L. Eyring (North-Holland, Amsterdam, 1979), Vol. I, p. 337.
- [23] D. Gignoux and J. Voiron: Phys. Rev. B 32 (1985) 4822.
- [24] A. Jayaraman, W. Lowe, L. D. Longinotti and E. Bucher: Phys. Rev. Lett. 36 (1976) 366.
- [25] S. M. Shapiro, J. D. Axe, R. J. Birgeneau, J. M. Lawrence and R. D. Parks: Phys. Rev. B 16 (1977) 2225.
- [26] E. Gaudin, B. Chevalier, B. Heying, U. Rodewald and R. Pottgen: Chem. of Mater. 17 (2005) 2693.
- [27] A. Svane, P. Strange, W. Temmerman, Z. Szotek, H. Winter and L. Petit: Phys. Stat. Sol. (b) 223 (2001) 105.
- [28] T. M. Rice and K. Ueda: Phys. Rev. B 34 (1986) 6420.
- [29] H. Shiba: J. Phys. Soc. Jpn. 55 (1986) 2765.
- [30] K. Miyake, T. Matsuura and C. M. Varma: Solid State Commun. 71 (1989) 1149.
- [31] Y. Onishi and K. Miyake: Physica B 281–282 (2000) 191.
- [32] K. Miyake, S. Schmitt-Rink and C. M. Varma: Phys. Rev. B 34 (1986) 6554.
- [33] S. Watanabe, M. Imada and K. Miyake: Journal of the Physical Society of Japan 75 (2006) 3710.
- [34] K. Miyake and H. Maebashi: J. Phys. Soc. Jpn. 71 (2002) 1007.
- [35] K. Miyake and O. Narikiyo: J. Phys. Soc. Jpn. 71 (2002) 867.
- [36] P. Gegenwart, C. Langhammer, C. Geibel, R. Helfrich, M. Lang, G. Sparn, F. Steglich, R. Horn, L. Donnevert, A. Link and W. Assmus: Phys. Rev. Lett. 81 (1998) 1501.
- [37] A. T. Holmes, A. Demuer and D. Jaccard: Acta Phys. Pol., B 34 (2003) 567.
- [38] D. Jaccard and A. T. Holmes: Physica B 359–361 (2005) 333.
- [39] D. Jaccard and A. T. Holmes: Physica B 359 (2005) 333.
- [40] A. T. Holmes, D. Jaccard, H. S. Jeevan, C. Geibel and M. Ishikawa: J. Phys: Condens. Matter 17 (2005) 5423.
- [41] A. T. Holmes and D. Jaccard: Physica B Condensed Matter 378 (2006) 339.
-
[42]
A. T. Holmes: Dr. Thesis, University of Geneva, no. 3539, Geneva
2004.
http://www.unige.ch/cyberdocuments/theses2004/HolmesAT/these.pdf - [43] B. Bellarbi, A. Benoit, D. Jaccard, J. M. Mignot and H. F. Braun: Phys. Rev. B 30 (1984) 1182.
- [44] D. Jaccard, P. Link, E. Vargoz and K. Alami-Yadri: Physica B 230–232 (1997) 297.
- [45] E. Vargoz: Dr. Thesis, University of Geneva, no. 3003, Geneva 1998.
- [46] K. Miyake, O. Narikiyo and Y. Onishi: Physica B 259–261 (1999) 676.
- [47] A. Onodera, S. Tsuduki, Y. Ohishi, T. Watanuki, K. Ishida, Y. Kitaoka and Y. Onuki: Solid State Commun. 123 (2002) 113.
- [48] J. Roehler, J. Klug and K. Keulerz: J. Magn. Magn. Mater. 76–77 (1988) 340.
- [49] E. Vargoz and D. Jaccard: J. Magn. Magn. Mater. 177–181 (1998) 294.
- [50] E. Vargoz, D. Jaccard, J. Y. Genoud, J. P. Brison and J. Flouquet: Solid State Commun. 106 (1998) 631.
- [51] D. Jaccard, J. M. Mignot, B. Bellarbi, A. Benoit, H. F. Braun and J. Sierro: J. Magn. Magn. Mater. 47–48 (1985) 23.
- [52] F. Thomas, C. Ayache, I. A. Fomine, J. Thomasson and C. Geibel: J. Phys: Condens. Matter 8 (1996) L51.
- [53] J. Thomasson, Y. Okayama, I. Sheikin, J. P. Brison and D. Braithwaite: Solid State Commun. 106 (1998) 637.
- [54] D. Jaccard, E. Vargoz, K. Alami-Yadri and H. Wilhelm: Rev. High Pressure Sci. Techno. 7 (1998) 412.
- [55] P. Link, D. Jaccard and P. Lejay: Physica B 225 (1996) 207.
- [56] H. Q. Yuan, M. Deppe, G. Sparn, C. Geibel and F. Steglich: Acta Phys. Pol., B 34 (2003) 533.
- [57] C. Petrovic, P. G. Pagliuso, M. F. Hundley, R. Movshovich, J. L. Sarrao, J. D. Thompson, Z. Fisk and P. Monthoux: J. Phys: Condens. Matter 13 (2001) L337.
- [58] H. Hegger, C. Petrovic, E. G. Moshopoulou, M. F. Hundley, J. L. Sarrao, Z. Fisk and J. D. Thompson: Phys. Rev. Lett. 84 (2000) 4986.
- [59] T. Muramatsu, N. Tateiwa, T. C. Kobayashi, K. Shimizu, K. Amaya, D. Aoki, H. Shishido, Y. Haga and Y. Onuki: J. Phys. Soc. Jpn. 70 (2001) 3362.
- [60] M. Nicklas, V. A. Sidorov, H. A. Borges, P. G. Pagliuso, J. L. Sarrao and J. D. Thompson: Phys. Rev. B 70 (2004) 020505.
- [61] J. L. Sarrao, L. A. Morales, J. D. Thompson, B. L. Scott, G. R. Stewart, F. Wastin, J. Rebizant, P. Boulet, E. Colineau and G. H. Lander: Nature 420 (2002) 297.
- [62] F. Wastin, P. Boulet, J. Rebizant, E. Colineau and G. H. Lander: J. Phys: Condens. Matter 15 (2003) S2279.
- [63] F. Wastin: Private communication.