Evidence of a pressure-induced metallization process in monoclinic VO2
Abstract
Raman and combined trasmission and reflectivity mid infrared measurements have been carried out on monoclinic VO2 at room temperature over the 0-19 GPa and 0-14 GPa pressure ranges, respectively. The pressure dependence obtained for both lattice dynamics and optical gap shows a remarkable stability of the system up to P*10 GPa. Evidence of subtle modifications of V ion arrangements within the monoclinic lattice together with the onset of a metallization process via band gap filling are observed for PP*. Differently from ambient pressure, where the VO2 metal phase is found only in conjunction with the rutile structure above 340 K, a new room temperature metallic phase coupled to a monoclinic structure appears accessible in the high pressure regime, thus opening to new important queries on the physics of VO2.
Since the first observation of the metal to insulator transition (MIT) in several vanadium oxides, these materials attracted considerable interest because of the huge and abrupt change of the electrical properties at the MIT. As usual in transition metal oxides, electronic correlation strongly affects the conduction regime of vanadium oxides, although, in some compounds, lattice degrees of freedom seem to play an important role. This is the case of VO2, which undergoes a first order transition from a high temperature metallic rutile (R) phase to a low temperature insulating monoclinic (M1) one. At the MIT temperature, =340 K, the opening of an optical gap in the mid-infrared (MIR) conductivity and a jump of several order of magnitude in the resistivity are observed Morin . The interest on this compound is thus mainly focused on understanding the role and the relative importance of the electron-electron and the electron-lattice interaction in driving the MIT. Despite the great experimental and theoretical efforts tokura , the understanding of this transition is still far from being complete Kim ; Biermann ; Haverkor ; Choi ; Basov . In the R phase the V atoms, each surrounded by an oxygen octahedron, are equally spaced along linear chains in the c-axis direction and form a body-centered tetragonal lattice. On entering the M1 insulating phase the dimerization of the vanadium atoms and the tilting of the pairs with respect to the c axis lead to a doubling of the unit cell, with space group changing from C (R) to D (M1) rutile ; mono . As first proposed by Goodenough Good , the V-V pairing and the off-axis zig-zag displacement of the dimers lead to a band splitting with the formation of a Peierls-like gap at the Fermi level. First principle electronic structure calculations based on local density approximation (LDA) showed the band splitting on entering the monoclinic phase, but failed to yield the opening of the band gap Wentz ; Eyert . In fact, as early pointed out ZylbeMott , the electron-electron correlation has to be taken into account to obtain the insulating phase. A recent theoretical paper where the electronic Coulomb repulsion U is properly accounted for, shows that calculations carried out joining dynamical mean field theory with the LDA scheme correctly captured both the rutile metallic and the monoclinic insulating state Biermann .
There are many experimental evidences of strong electronic correlation in VO2, as for example the anomalous linear temperature dependence of conductivity above without any sign of saturation up to 800 K resistivity . Moreover a recent study of the temperature dependence of the optical conductivity Basov shows that MIT involves a redistribution of spectral weight (i.e the frequency-integrated optical conductivity ()) within a broad energy scale ( 5.5 eV). This suggests electronic correlation to be crucial for the MIT, even though the insulating state may not be a conventional Mott insulator because of the Peierls pairing. Finally it should be noted that insulating monoclinic VO2 with a different space group C (M2) can be achieved under peculiar growing condition M2puro , as well as by means of minute amounts of Cr/V substitution M2 . In the M2 phase the Peierls pairing is partially removed: one half of the V atoms dimerizes along the c-axis, and the other one forms zig-zag chains of equally spaced atoms M2 . The insulating character of the M2 phase has been reported as a further support of the idea that the physics of VO2 is close to that of a Mott-Hubbard insulator PougetStrain ; comment .
High pressure is an ideal tool for studying electron-correlated systems. Lattice compression in these systems usually increases the orbital overlap and the electronic bandwidth (W) thus allowing for a systematic study of the physical properties as a function of U/W. Unfortunately there is an almost complete lack of high pressure experimental data on VO2 apart from early resistivity measurements which show a small pressure-induced increase (about 3 K) of in the 0-4 GPa range PressJaya . On the contrary the application of pressure on Cr-doped VO2 in the M2 phase induces a remarkable decrease (about 20 K) of within the 0-5 GPa range M2 .
In the present Letter we report on high-pressure MIR (0-14 GPa) and Raman (0-19 GPa) measurements on VO2 at room temperature to study pressure-induced effects on both the electronic structure and the lattice dynamics. In particular, since the optical gap lies in the MIR region and the Raman spectra of VO2 are drastically different in the R and M1 phases, the techniques chosen allow to monitor independently the electronic and the structural transitions. VO2 was prepared starting from proper amounts of V2O3 and V2O5 (Aldrich 99.9%) pressed in form of pellet and reacted at 1050∘C in an argon flux for 12 h. Single crystal of needle-like form were obtained. Phase purity was checked through single crystal x-ray diffraction on some crystals and also on a powdered sample from crushed crystals. The room temperature refined lattice parameters are in both cases in full agreement with the M1 monoclinic structure. The M1-R transition in synthesised samples has been probed by means of Differential Scanning Calorimetry which revealed a clear endothermic peak at about 340 K in perfect agreement with the literature value.
A screw clamped opposing-plates diamond anvil cell (DAC) equipped with 400 m culet II A diamonds has been used for both Raman and MIR experiments. The gaskets were made of a 250 m thick steel foil with a sample chamber of 130 m diameter and 40 to 50 m height under working conditions. We used NaCl an KBr as pressure transmitting media for Raman and MIR measurements respectively fit ; PRB . Pressure was measured in situ with the standard ruby fluorescence technique Mao .
High-pressure MIR spectra of room temperature VO2 have been collected exploiting the high brilliance of the SISSI infrared beamline at ELETTRA synchrotron in Trieste sissi . The incident and reflected (transmitted) radiation were focused and collected by a cassegrain-based Hyperion 2000 infrared microscope equipped with a MCT detector and coupled to a Bruker IFS 66v interferometer, which allows to explore the 750-6000 cm-1 spectral range. A VO2 5m thick slab, obtained by pressing finely milled sample between the diamond anvils, have been placed in the gasket hole, where a KBr pellets was previously sintered PRLmanganiti . The slits of the microscope were carefully adjusted to collect transmitted and reflected light from the sample only and kept fixed for all the experiment.
The high brilliance of the infrared synchrotron source and the proper sample thickness allow us to measure the intensities reflected, (), and transmitted, (), at each pressure. Possible misalignements and source intensity fluctuations have been accounted for by measuring the intensity reflected by the external face of the diamond anvil, (), at each working pressure. At the end of the pressure run we measured the light intensities reflected by a gold mirror placed between the diamonds () and by the external face of the diamond anvil (). By using the ratio ()/() as a correction function, we achieved the reflectivity R():
| (1) |
The transmittance T() is obtained using:
| (2) |
where is the transmitted intensity of the empty DAC without gasket and with the anvils in tight contact. R() and T() at selected pressures are shown in Fig. 1.
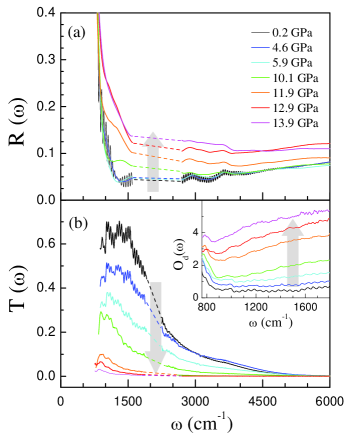
At P 0, the low-frequency reflectivity is characterized by a steep rise due to a phononic contribution, whereas, on the high frequency side, R() is slowly varying between 0.05 and 0.08, values slightly higher than those expected for sample-diamond interface handbook ; Barker2 . The extra reflectivity is due to the multiple reflections within the sample-KBr bilayer which also originate the interference fringes well evident in both R() and T(). The low T() values at high-frequency are due to the absorption of the low-frequency tail of the electronic band Barker2 ; Basov .
Within the 0-10 GPa pressure range R() does not change remarkably whereas T() gradually decreases. On increasing pressure above 10 GPa R() starts to increase and T() abruptly decreases to very small values owing to the shift of the electronic band towards lower frequencies. A clear evidence of this process is found in the optical density = - shown in the inset of Fig. 1. Above 10 GPa the electronic contribution fills the optical gap and the phonon peak is remarkably screened. These findings show the onset of a pressure induced charge delocalization process. The simultaneous measurements of R() and T() allow us to extract the real, n, and the imaginary part, k, of the complex refractive index of VO2. To this purpose a multilayer scheme diamond-sample-KBr-diamond has been adopted, where multiple reflections within the sample and the KBr layers have been fully accounted for by adding incoherently the intensities of the reflected beams Gruner . Using the experimental layer thicknesses and the known optical properties of diamond and KBr handbook , R() and T() can be expressed as a function of n and k only. The analytical derivation, under the above assumptions, is straightforward albeit rather lengthy, and will be reported in detail in a forthcoming extended paper. The non-analytical two equations system can be solved numerically by an iterative procedure to obtain n and k iter . The results obtained at the lowest pressure have been found to be in good agreement with literature data at P=0 Basov ; Barker2 . We point out that the independence of the results from the guess function have been checked and that a complete agreement is found when a different calculation technique Choi is adopted to obtain n and k.
The optical conductivity at different pressure is shown in Fig. 2. The low frequency region of the spectra has not been reported because the strong variations of the optical constants around the phonon contribution could affect the reliability of the results of the iterative procedure. In any case the data shown in Fig. 2 allow to follow the pressure behaviour of the low frequency tail of the electronic band, which is the spectral structure mostly affected by the MIT Basov .
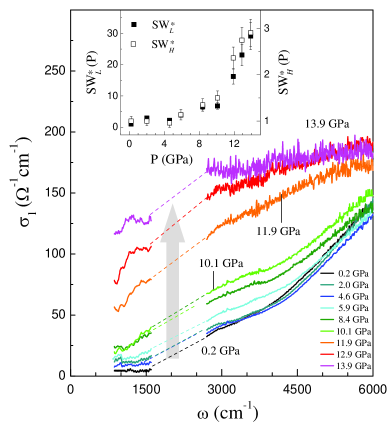
At P 0, is in good agreement with recent ambient pressure data Basov and it is weakly pressure dependent up to 4 GPa. On further increasing the pressure, () progressively increases, mainly within the 1500-4500 cm-1 frequency range. Above 10 GPa an abrupt increase of the overall () occurs and a remarkable pressure-induced band gap filling is observed. The data at the highest pressure clearly show that the energy gap, if still open, is well below 900 cm-1. We want to notice that a rough linear extrapolations of the data collected at P10 GPa gives positive although small () values compatible with a bad metal behaviour.
The effect of pressure can be better visualized if the pressure dependence of the spectral weight SW(P) is analyzed. At each pressure we calculated the integral of () over the 900-1600 cm-1 [SWL(P)] and 2600-5000 cm-1 [SWH(P)] frequency ranges. The integration has not been extended to the frequency region above 5000 cm-1, owing to the onset of saturation effects in the spectra collected at the highest pressures (see in Fig. 2 the high noise level of these spectra at high frequencies). The spectral weights normalized to the lowest pressure values, SW(P)=SWL(P)/SWL(0) and SW(P)=SWH(P)/SWH(0) are shown in the inset of Fig. 2. Both the spectral weights show the same pressure dependence, with a clear and abrupt change of slope at 10 GPa. We notice that the absolute pressure-induced variation of SW(P) is much larger than that observed for SW(P), as expected if charge delocalization occurs Basov . Such a large and abrupt increase of the spectral weight in the gap region is certainly compatible with the occurrence of a pressure induced MIT, although the spectral range of the present measurements does not allow to claim undoubtedly the complete optical gap closure above 10 GPa.
Raman measurements have been carried out using a confocal micro-Raman spectrometer equipped with a He-Ne laser source (632.8 nm), a 1800 g/cm grating, and a Charge-Coupled-Device detector. A notch filter was used to reject the elastic contribution of the backscattered light collected by a 20x objective. Under these experimental conditions we achieved a few microns diameter laser spot on the sample and a spectral resolution of about 3 cm-1. Raman spectra of a VO2 small single crystal collected within the 150-800 cm-1 frequency range are shown in Fig. 3 at selected pressures. The spectrum at the lowest pressure shows a full agreement with previous data collected on VO2 in the M1 phase at ambient pressure RamanOld ; RamanNew . Fifteen narrow phonon peaks of the 18 Raman-active modes predicted for the M1 phase (9 Ag + 9 Bg) can be identified in the present measurements. The effect of pressure on the Raman spectrum results in a clear phonon frequency hardening, which, however, does not significantly changes either the peak pattern or the overall spectral shape over the pressure range explored. Variations of the relative intensities of phonon peaks must be ascribed to polarization effect, particularly strong in VO2 RamanNew ; Raman3 . Since the Raman spectrum of VO2 in the R phase is characterized by only 4 broad peaks RamanOld ; RamanNew we can safely conclude at a glance that a transition to a R phase is not achieved by applying pressure up to 19 GPa. The good quality of the data allows to apply a standard fitting procedure fit to analyse the pressure dependence of the phonon spectrum. The analysis shows an almost linear increase of the frequencies of every phonon peak eccept for and at 192 cm-1 and 224 cm-1 at P0, respectively, whose pressure dependence is shown in the inset of Fig. 3. A rather abrupt change of the rate from a value close to zero to 1-1.5 cm-1/GPa is apparent at around 10 GPa.

Due to the large difference between the V and the O mass, the low frequency and peaks can be ascribed to the V-ions motion in the dimerized chains. In fact by comparing the phonon frequencies of VO2 with those of NbO2, which has the same crystal structure and exhibits a quite similar Raman spectrum NbO2 , and frequencies scale with the mass of the transition metal, while the frequency of the peak (see Fig. 3) scales with the reduced mass between the oxygen and the transition metal. Albeit the monoclinic structure is retained over the whole pressure range explored, the latter finding suggests some rearrangement of the V-V chains as the pressure is increased above 10 GPa.
To summarize, we report on a careful high-pressure Raman and MIR investigation of VO2. In particular, taking full advantage from the high brilliance of the SISSI beamline, we were able to collect both transmittance and reflectivity of the sample in the DAC allowing for a full analysis of the MIR data. The whole of the results clearly identifies two regimes below and above a threshold pressure P* 10 GPa. Both Raman and IR spectra show a weak pressure dependence for PP* whereas, for PP*, the pressure driven optical gap filling is accompanied by a rearrangement of the V chains within a monoclinic framework. The stability of the monoclinic phase, which retains up to 19 GPa, and the pressure-driven delocalization process, which starts at P* and it is quite remarkable at the highest pressures (14 GPa), indicate that the metal-insulator and monoclinic-rutile transitions are decoupled in high pressure VO2. Recent high-pressure x-ray diffraction data Malavasi which extend the stability of the monoclinic phase up to 42 GPa further support the above finding.
The rearrangement of the V chains at P* suggests the occurrence of a subtle transformation into a new monoclinic phase where lattice compression enables the system to evolve towards a metallic phase. A pressure-induced transition from the M1 to the M2 phase can be conjectured, bearing in mind the strong pressure-induced reduction of the MIT temperature observed in M2 Cr-doped VO2 M2 . This transition is compatible with our Raman results since the spectra of VO2 in the M1 and M2 phases are expected quite similar (group theory predicts the same number of Raman modes). The present results thus open to new experimental queries and represent a severe benchmark for theoretical model aimed at addressing the role of the electron-electron correlation and the structural transition in driving the MIT in VO2.
References
- (1) F.J. Morin, Phys. Rev. Lett. 3, 34 (1959).
- (2) M. Imada et al., Rev. Mod. Phys. 70, 1039 (1998).
- (3) H.T. Kim et al., New J.Phys. 6, 52 (2004) .
- (4) S. Biermann et al., Phys. Rev. Lett. 94, 026404 (2005).
- (5) H.S. Choi et al., Phys. Rev. B 54, 4621 (1996).
- (6) M. M. Qazilbash et al., accepted for publication on Phys. Rev. B.
- (7) M.W. Haverkort et al., Phys. Rev. Lett. 95, 196404 (2005).
- (8) D.B.McWhan et al.,Phys. Rev. B 10, 490 (1974).
- (9) J. M. Longo et al., Acta Chim. Scand. 24 420 (1970).
- (10) J.B. Goodenough, J.Solid State Chem. 3, 490 (1971).
- (11) R. M. Wentzcovitch et al., Phys. Rev. Lett. 72, 3389 (1994).
- (12) V. Eyert, Ann. Phys. (Leipzig) 11, 650 (2002).
- (13) A. Zylbersztejn et al., Phys. Rev. B 11, 4383 (1975).
- (14) P.B. Allen et al., Phys. Rev. B 48, 4359 (1993).
- (15) J. Galy and G. Miehe, Sol. Stat. Sci. 1, 433 (1999).
- (16) M. Marezio et al., Phys. Rev. B 5, 2541 (1972).
- (17) T.M. Rice et al., Phys. Rev. Lett. 73, 3042 (1994).
- (18) J.P. Pouget et al., Phys. Rev. Lett. 35, 873 (1975).
- (19) C.N. Berglund et al., Phys. Rev 185, 1034 (1969).
- (20) A. Congeduti et al., Phys. Rev. Lett. 86, 1251 (2001).
- (21) A. Congeduti et al., Phys, Rev. B 63, 184410 (2001).
- (22) H. K. Mao et al., Appl. Phys. 49, 3276 (1978).
- (23) S. Lupi et al., accepted for publication on J. Opt. Soc. Am. B.
- (24) A. Sacchetti et al., Phys. Rev. Lett 96, 035503 (2006).
- (25) M. Dressel and G. Grüner, in “Electrodynamics of Solids”, (Cambridge University Press, 2002).
- (26) Handbook of Optical Constants of Solids II, edited by E. D. Palik (Academic, San Diego, 1991).
- (27) H. W. Verleur et al., Phys. Rev. 172, 788 (1968).
- (28) The guess function n0() was put equal to the average refraction index of room temperature VO2 Barker2 and k0() is obtained inserting n0() into the T() equation. The successive iterate, n1(), is obtained inserting k0() into R() and in turn n1() into T() to get k1(). The procedure has been iterated till convergence.
- (29) R. Srivastava et al., Phys. Rev. Lett. 27, 727 (1971).
- (30) P. Schilbe, Phys. B 316, 600 (2002).
- (31) A.G. Aronov et al., Sov. Phys. Solid State 19, 110 (1977).
- (32) Y. Zhao et al., J. Phys. D 37, 3392 (2004).
- (33) L.Malavasi, private comunication.