A local metallic state in globally insulating well above the metal-insulator transition
pacs:
71.18.+y, 79.60.-iIn the spectacularly successful theory of solids, the distinction between metals, semiconductors, and insulators is based upon the behavior of the electrons nearest the Fermi level , which separates the occupied from unoccupied electron energy levels. A metal has in the middle of a band of electronic states, while in insulators and semiconductors lies in the gap between states. The temperature-induced transition from a metallic to an insulating state in a solid is generally connected to a vanishing of the low energy electronic excitations Imada . Here we show the first direct evidence of a counter example, in which a significant electronic density of states at the Fermi energy exists in the insulating regime. In particular, angle-resolved photoemission data from the “colossal magnetoresistive” oxide show clear Fermi edge steps both below the when the sample is globally metallic, as well as above when it is globally insulating. Further, small amounts of metallic spectral weight survive up to the temperature scale more than twice the of the system. Such behavior also may have close ties to a variety of exotic phenomena in correlated electron systems including in particular the pseudogap scale T* in underdoped cuprates Timusk .
As shown in figure 1a, the colossal magnetoresistive (CMR) oxide (x=0.38) exhibits a metal insulator transition at a of about 130K, at which point the system also switches from being a ferromagnet (low ) to a paramagnet (high ) LiQA . We performed angle-resolved photoemission spectroscopy (ARPES) experiments on cleaved single crystals of these materials, with an experimental arrangement as described elsewhere Sun . ARPES is an ideal experimental probe of the electronic structure since it gives the momentum-resolved single-particle excitation spectrum. As discussed in ref. 4 the x=0.38 compound studied here does not contain the low energy pseudogap of the x=0.4 samples DessauPRL ; ChuangScience ; Saitoh ; Mannella (see supplementary material for more details on this, the possible issue of surface sensitivity of ARPES, and of possible intergrowths at the surface). The much larger metallic spectral weight of these non-pseudogapped compounds also allows us to study the electronic behavior in greater detail.
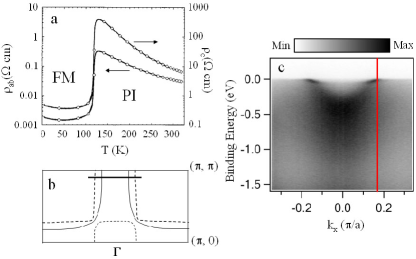
Figure 1c shows a large-energy-scale experimental picture of a low temperature symmetry band taken along the black cut near the zone boundary, as shown in figure 1b. We are able to get clean data by isolating the various bilayer-split bands using different photon energies, as described in ref. 4. In particular, in this paper we only show data from the antibonding bilayer-split band which has Fermi crossings at =0.17 , =0.9 , corresponding to the solid Fermi surface in figure 1b. The energy distribution curves (EDCs) at (indicated by the red line in figure 1c) taken at a series of temperatures are shown in figure 2a. Figure 2b shows the identical spectra and identical scaling, but offset vertically for clarity. All spectra have been normalized only to the incident photon flux.
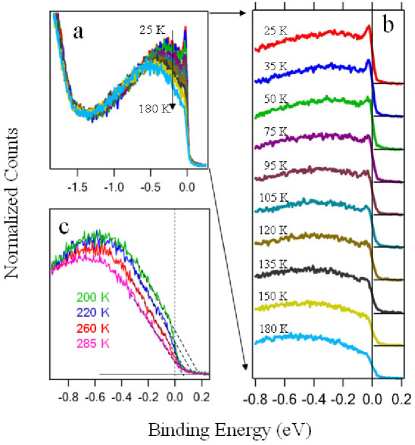
At low temperature, the EDCs clearly show a structure of peak-dip-hump, where the peak and the hump would nominally be considered the coherent part (quasiparticle) and “incoherent” part of the single particle spectrum respectively, as has been discussed for the spectra of the high cuprate superconductors Dessau ; ShenDessau ; Damascelli . One sees that the near- spectral weight diminishes with increasing temperature, while the high binding energy (700meV) part is less affected by temperature. Contrary to the general picture of the metal-insulator transition, in which a gap develops in the single particle spectrum when an electronic system becomes insulating Imada , the EDCs here still exhibit a sharp Fermi cutoff indicating metallic behavior at temperatures in which the macroscopic DC conductivity is characteristic of insulation (e.g. the spectra at 135, 150 and 180K). To our knowledge, this unusual behavior, a metallic Fermi edge in a globally insulating system, has not been previously observed on the insulating side of a metal-insulator transition. The opposite, in which a metallic system shows a lack of a Fermi cutoff, is on the other hand expected in exotic low-dimensional systems such as the Luttinger Liquids Voit , and has likely been observed Allen . The other situation most likely to show a metallic Fermi edge in a globally insulating system is that of an Anderson-localized system beyond the mobility edge. However, in such systems a Coulomb gap is expected to remove the metallic weight near the Fermi energy Varma . Our data could only be consistent with such a scenario if the Coulomb gap were extremely small - on the order of a few meV or less. Such a picture also would not naturally explain the metallic spectral weight dependence with temperature, to be discussed in more detail later in the letter.
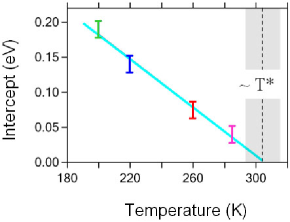
On a different sample we have done higher temperature scans, looking for a possible temperature scale at which the metallic spectral weight disappears. These data are shown in figure 2c and show a clear discontinuity in the slope near the Fermi energy for all but the 285K data, indicating a finite metallic spectral weight. This effect is emphasized by an extrapolation of the spectral weight using a simple linear fit to the data between -0.3 and -0.05 eV, as shown by the dotted lines in the figure. Upon raising the sample temperature we see that the intercept of these dotted lines with the horizontal axis decreases at an approximately linear rate (figure 3). As shown in this figure these zero intensity intercepts reach the Fermi energy at 305 10K. We thus indicate 305K as the temperature at which the first bits of metallic weight become apparent, which we indicate as the temperature . Technical reasons including sample aging and excessive manipulator drift preclude us from making the full range of measurements on a single cleave. We therefore used different samples to study the electronic excitations in different temperature regimes.
Figure 4a shows the electronic dispersion of the near-Fermi states as a function of temperature obtained from an analysis of momentum distribution curves (MDCs). This data indicates that the main properties of the metal, such as the Fermi wave vector , the Fermi velocity , the electron phonon coupling parameter , and the effective mass don’t change significantly as a function of temperature, even as the metal-insulator transition temperature is traversed. This is an unexpected behaviour for a metal-insulator transition in which these parameters would vary dramatically with temperature, and likely even diverge Imada .
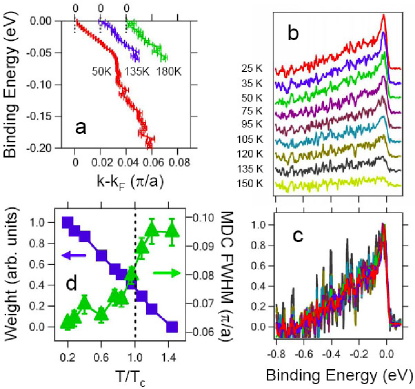
Our data can be understood by invoking a model of disconnected local ferromagnetic metallic regimes above up to approximately the temperature . This suggestion is consistent with earlier studies which have found significant ferromagnetic signals far above ArgyriouJAP ; Osborn ; Rosenkranz1 ; Rosenkranz2 , since metallicity and ferromagnetism should have a connection in these systems via the double-exchange interaction. In general, the metallic regions may be either phase separated (and possibly static) domains Uehara ; Dagotto or they may be dynamic fluctuations of the ferromagnetic metallic state, which in a two-dimensional system may persist to quite high temperatures ArgyriouJAP ; Osborn ; Rosenkranz1 ; Rosenkranz2 . We will discuss these two possibilities later in this letter. Here we show that we can study the metallic portions further by our ability to approximately deconvolve the spectrum into the components which arise from the metal and non-metal portions. We do this by subtracting the 180K EDC from all other EDCs as shown in figure 2b to create “metallic EDCs” or M-EDCs as shown in figure 4b. It should be pointed out that the slight variation of spectra from sample to sample, which has been commonly observed in ARPES, imperils the practice of extracting data of one sample from that of another. Therefore, we don’t use the higher temperature data of figure 2c to do the subtraction as this is from a different sample. Figure 4c shows the same M-EDCs but scaled to all have the same amplitude. Within the noise, all the M-EDCs have similar lineshapes with coherent peaks near and an incoherent background at high binding energy, though the widths of the M-EDC coherent peak (or low energy MDC peak) become broader with increasing temperature (figure 4d). The integrated spectral weight of the M-EDCs varies smoothly as a function of temperature, with no clear break at (figure 4d). This, as well as the approximate temperature-independence of the M-EDC lineshape indicates that the electrons in the metallic regions have similar properties above and below , and that temperature has surprisingly little effect on the behavior or interactions of electrons in the metallic regions. This is consistent with the approximate independence of , , and in the metallic regions shown in figure 4a. The experimentally determined MDC width of the electrons at the Fermi energy (green triangles of figure 4d) does broaden with increasing temperature. The inverse of this quantity, the mean free path of the electrons, thus decreases with increasing temperature, consistent with a decreased size of metallic regions or increased scattering events at higher temperatures.
While many aspects of our data are consistent with either the phase separation or magnetic fluctuation picture, certain aspects of it can address the question of whether the metallic regions above are phase-separated out from a more insulating environment Uehara ; DagottoBook , or if they are just fluctuations from a lower temperature ordered environment which is otherwise homogeneous Rosenkranz1 ; Rosenkranz2 . In particular, the smooth dependence of the spectral weight of the metallic regions as a function of temperature across (blue squares of figure 4d) is more consistent with phase separation, as we would likely expect a clear drop in the metallic weight near if the metallic portions were just fluctuations of the ordered lower temperature environment. At other doping levels (for example =0.4), experiments do observe a sharp drop in the metallic weight at to zero or almost zero Mannella , and so those samples may be more consistent with the fluctuation physics.
Within the picture of phase separation, we imagine that the metallic islands arise at a temperature near room temperature, which also may be related to the temperature scale at which polaronic correlations freeze ArgyriouPRL . As the temperature is lowered the size and proportion of metallic portions grows until a critical ratio of metallic to insulating portions is reached. At that point electrons can percolate from one metallic region to another, bringing about the macroscopic metallic Uehara and ferromagnetic states, as well as being consistent with the “colossal” decrease in resistivity with an applied magnetic field. In certain models this behavior is expected from a competition between different phases, for example between the ferromagnetic metal phase and the charge-ordered antiferromagnetic insulating phase Uehara ; Dagotto ; Tokura , though in contrast to ref 19, the materials used here are far away from the charge-ordered doping level. Theoretical arguments predict both the phase separation and the existence of a higher temperature scale Burgy , with ideas similar to the Griffiths singularity Griffiths in which would be the critical temperature of the associated clean system in the absence of disorder, and which have recently been discussed in the context of manganite physics Burgy ; Salamon . We are presently undertaking a more thorough study of the full Fermi surface to test this percolation model quantitatively.
A scale is one of the key properties of the high superconductors, and has for years been the subject of intense controversy Timusk . In these compounds, disorder also appears to be highly relevant, especially in the underdoped regime where the scale exists. In that case it signals the emergence of the pseudogap, which may be the precursor to the long range superconducting order which forms at Emery – a clear analogy to the manganites where signals the emergence of the metallic domains which become long range at . Also similar to the cuprates, it appears that the temperature scales may not be universal to all doping levels of the manganites. Pinning these details down and then understanding their implications will certainly be an area of intense study in the near future.
It is becoming increasingly clear that some of the most dramatic responses in modern materials occur in systems in which multiple phases or orders with similar energy scales compete with each other Dagotto ; Tokura ; Burgy ; Murakami . It is then natural that in at least some of these systems spatial heterogeneities will occur, and small perturbations can cause drastic macroscopic alterations to the physical properties or even new types of “emergent” behavior. The key is finding which aspects of the inhomogeneity are intrinsic and what is their role in determining the key physical properties of the system.
The authors thank Y. Tokura and T. Kimura for providing preliminary samples and are grateful to D. N. Argyriou, A. Bansil, E. Dagotto, K. Gray, A. Moreo, R. Osborn, L. Radzihovsky, D. Reznik, S. Rosenkranz, Y. Tokura, and M. Veillette for helpful discussions. This work was supported by the U.S. Department of Energy under grant DE-FG02-03ER46066 and by the U.S. National Science Foundation grant DMR 0402814. The ALS is operated by the Department of Energy, Office of Basic Energy Sciences. Argonne National Laboratory, a U.S. Department of Energy Office of Science Laboratory, is operated under Contract No. DE-AC02-06CH11357. The U.S. Government retains for itself, and others acting on its behalf, a paid-up nonexclusive, irrevocable worldwide license in said article to reproduce, prepare derivative works, distribute copies to the public, and perform publicly and display publicly, by or on behalf of the Government.
References
- (1) M. Imada, A. Fujimori, and Y. Tokura, Rev. Mod. Phys. 70, 1039 (1998).
- (2) T. Timusk and B. Statt, Rep. Prog. Phys. 62, 61 (1999).
- (3) Q. A. Li, et al., Phys. Rev. B 59, 9357 (1999).
- (4) Z. Sun et al., Phys. Rev. Lett. 97, 056401 (2006).
- (5) D. S. Dessau et al., Phys. Rev. Lett. 81, 192 (1998).
- (6) Y.-D. Chuang et al., Science 292, 1509 (2001).
- (7) T. Saitoh et al., Phys. Rev. B 62, 1039 (2000).
- (8) N. Mannella et al., Nature 438, 474 (2005).
- (9) D. S. Dessau et al., Phys. Rev. Lett. 66, 2160 (1991).
- (10) Z. -X. Shen and D. S. Dessau, Phys. Rep. 253, 1 (1995).
- (11) A. Damascelli, Z. Hussain, and Z. -X. Shen, Rev. Mod. Phys. 75, 473 (2003).
- (12) J. Voit, Rep. Prog. Phys. 57, 977 (1995).
- (13) J.W. Allen, Sol. State Comm. 123, 469 (2002).
- (14) C.M. Varma, Phys. Rev. B 54, 7328 (1996).
- (15) D. N. Argyriou, et al., J. Appl. Phys. 83, 6374 (1998).
- (16) R. Osborn, et al., Phys. Rev. Lett. 81, 3964 (1998).
- (17) S. Rosenkranz, et al., cond-mat/9909059.
- (18) S. Rosenkranz, et al., Physica B 312-313, 763-765 (2002).
- (19) M. Uehara, et al., Nature 399, 560 (1999).
- (20) E. Dagotto, Nanoscale Phase Separation and Colossal Magnetoresistanc (Springer Verlag, 2003).
- (21) D.N. Argyriou, et al., Phys. Rev. Lett. 89, 36401 (2002).
- (22) E. Dagotto, Science 309, 257 (2005).
- (23) Y. Tokura, Rep. Prog. Phys. 69, 797 (2006).
- (24) J. Burgy, et al., Phys. Rev. Lett. 87, 277202 (2001).
- (25) R.B. Griffiths, Phys. Rev. Lett. 23, 17 (1969).
- (26) M. B. Salamon, et al., Phys. Rev. Lett. 88, 197203 (2002).
- (27) V.J. Emery, and S.A. Kivelson, Nature 374, 434 (1995).
- (28) S. Murakami, and N. Nagaosa, Phys. Rev. Lett. 90, 197201 (2003).
Supplementary discussion:
1. The difference between =0.38 and =0.4 samples. It should be pointed out that there is a remarkable difference between the ARPES spectra of and samples, even though many macroscopic properties are similar. Quasiparticles have been found near the zone boundary at the doping levels of =0.36 and 0.38 in , while there exists a large energy pseudogap in =0.40 samples Sun ; DessauPRL ; ChuangScience ; Saitoh ; Mannella . Temperature dependent studies have also been performed on =0.4 samples and have not shown evidence for metallic spectral weight above ChuangScience ; Saitoh ; Mannella . Similar to high- cuprates, physical properties exhibit strong variations with doping in manganites. The cause of the difference between (=0.38) and (=0.40) samples is not understood yet, though it could have to do with the increased lattice anomalies for the 0.4 samples [J. Mitchell et al., J. Phys. Chem. B 105, 10731 (2001).], the onset of spin canting between ferromagnetic layers which starts at the doping level of 0.4 [M.Kubota et.al., J. Phys. Soc. Jpn 69, 1606 (2000).], or even something extrinsic such as a surface issue.
2. The issue of surface sensitivity. Because of the shallow probing depth of the ARPES experiment ( 5-10 Angstroms), we cannot completely rule out the potential that a surface phase whose properties do not follow those of the bulk gives rise to some of the phenomena reported here. For ARPES on the layered manganites we are relatively well off since the samples cleave readily between the bilayers, which are ionically (not covalently) bonded. High quality LEED pictures without any evidence of surface reconstruction are obtained from these surfaces. The doping level at the surfaces, as obtained from the Fermi surface volume also appears to be correct for these samples - for example the bonding band Fermi surface nesting vector of for the samples used in this study Sun exactly matches that obtained from neutron scattering measurements ArgyriouPRL . The nesting vector of 0.4 samples is slightly larger at ChuangScience and also matches the results of scattering measurements [L. Vasiliu-Doloc, et al. Phys. Rev. Lett. 83, 4393 (1999).].
3. The issue of intergrowths. One should consider whether it might be possible for the metallic spectral weight far above to have originated from small bits of intergrowth (IG) of a higher sample left near the surface after cleaving. Here we discuss why that is inconsistent with our data. Such intergrowths should not arise from a layered manganite, as the maximum temperature at which bulk metallic behavior is found among all known layered manganites is 160K. A small amount of (non-layered) perovskite-like IG with a = 300K could exist at a cleaved surface, though would not show the bilayer splitting since the perovskite samples have only one plane per unit cell. Both our high and low temperature data display this bilayer band splitting (this paper only presents the data from the antibonding component), which is a direct consequence of having two planes per unit cell. In addition to being able to vary the intensity of the bilayer split bands (relative and overall) by taking advantage of the photoemission matrix elements, we can follow the dispersion in and of each of the bilayer bands, including tracking them all the way to . Therefore we know the origin of the metallic weight as explicitly originating from these bilayer split bands, and therefore, from the bilayer manganite.