Liquid-like behavior of supercritical fluids
Abstract
The high frequency dynamics of fluid oxygen have been investigated by Inelastic X-ray Scattering. In spite of the markedly supercritical conditions (, ), the sound velocity exceeds the hydrodynamic value of about , a feature which is the fingerprint of liquid-like dynamics. The comparison of the present results with literature data obtained in several fluids allow us to identify the extrapolation of the liquid vapor-coexistence line in the (, ) plane as the relevant edge between liquid- and gas-like dynamics. More interestingly, this extrapolation is very close to the non metal-metal transition in hot dense fluids, at pressure and temperature values as obtained by shock wave experiments. This result points to the existence of a connection between structural modifications and transport properties in dense fluids.
pacs:
67.55.Jd,67.40.Fd,61.10.Eq,62.50.+pWith the recent advent of the Inelastic X-Ray technique (IXS) Burkel (1991); Sette et al. (1995), that complemented the Inelastic Neutron Scattering one extending the accessible exchanged momentum to the whole first pseudo Brillouin zone, the collective dynamics of disordered systems have been investigated in different classes of liquids and glasses Scopigno et al. (2005); Sette et al. (1998); Ruocco et al. (1996); Ruocco and Sette (2001); Scopigno et al. (2003). Among other features, the specific interest here is the discovery that in all the investigated liquids and glasses it exists a positive dispersion of the sound speed, i.e. an increase of the velocity of the longitudinal acoustic mode from the (relaxed) ultrasonic value to an infinite frequency (unrelaxed) value. Such anomalous dispersion is ascribed to the presence of one (or more) relaxation processes interacting with the dynamics of the density fluctuations.
On a qualitative ground, a relaxation process is characterized by a specific time, , which marks the border between ”viscous liquid”-like dynamics (for ) to ”elastic solid”-like one (for ). Correspondingly, the longitudinal sound velocity, i. e. the velocity of propagation of the density fluctuation, undergoes a transition (positive dispersion) from its ”low” frequency limit, , which characterizes the ”liquid” value, to its ”infinite” frequency limit , characteristic of the ”solid” response of the system.
Usually, more than one single relaxation process is active, and a ”sequence” of sound velocity dispersions takes place. In particular, convincing evidence has been reported in the last years supporting a scenario in which the density fluctuations decay according to three different relaxation mechanisms Scopigno et al. (2000): i) a thermal process (), arising from the coupling of temperature and density, which marks the transition from adiabatic () to isothermal () dynamics. ii) a structural (or ) process, strongly temperature dependent, whose timescale is directly related to the viscosity and hence to the mass diffusion coefficient. iii) a microscopic process, which drives the decay of the density fluctuations at a given wavelength, induced by the underlying disordered structure that does not support this wavelength as an energy eigenstate Ruocco et al. (2000). This scheme, validated by several experimental and numerical evidences, has been developed for glasses and normal liquids, i.e. for systems well below their liquid-gas critical point.
In this letter we investigate whether this approach can be applied to the supercritical phase, i.e. if and how the dynamics of a dense liquid evolves on crossing the critical temperature. On a qualitative ground, one might expect that on abandoning the liquid phase the positive dispersion should vanish. As matter of fact both the structural and microscopic processes are likely to become inactive as soon as the dynamics loses its cooperative nature and the concept of instantaneous vibrations is no longer well defined. Looking at the available IXS literature data for simple liquids and supercritical fluids Hosokawa et al. (2002); Scopigno et al. (2000, 2002); Monaco et al. (2004); Copley and Rowe (1974); Bodensteiner et al. (1992); Cunsolo et al. (2001, 1998); Bencivenga et al. (2006), one may actually conclude that the positive dispersion vanishes on approaching the critical temperature. However, this simplified view seems to be contradicted by the results reported here for supercritical Oxygen: at twice the critical temperature we still find a 20 positive dispersion. This result seems to indicate that the end of the liquid dynamics is not only marked by the critical temperature. Moreover, by examining the whole set of existing data, we conclude that the extension of the liquid-vapor coexistence line into the supercritical region (corresponding to the Widom’s line, i.e. the thermodynamic locus of the specific heat maxima) defines the transition from liquid-like to gas-like dynamics. This finding could help to give insights to the phenomena of the non metal-metal transition in hot dense simple fluids such as Hydrogen, Oxygen and Nitrogen, that has been observed at thermodynamic points which actually lie on the extrapolation of the coexistence line.
The experiment was carried out at the IXS Beamline II (ID28) at the ESRF. The X-rays from an undulator are monochromatized by a double crystal monochromator and a high-energy resolution backscattering monochromator, operating at the silicon (9 9 9) reflection order. The backscattered photons of energy 17794 eV (31010 photon/s) are focused by a cylindrical mirror and a Kirkpatrick-Baez multiplayer, providing a focal spot of 30 (horizontal) by 80 (vertical) m2 Full Width at Half Maximum (FWHM) at the sample position. The scattered photons are energy-analyzed by a Rowland circle five-crystal spectrometer, with an overall energy resolution 3.0 meV, and detected by a Peltier-cooled silicon diode. The momentum transfer , where is the incident photon wave vector and is the scattering angle, is selected by rotating the spectrometer around a vertical axis passing through the scattering sample. Spectra at five different momentum transfers can be recorded simultaneously by five independent analyzer systems with a resolution nm-1. We have used a diamond anvil cell (DAC) of the membrane type, equipped with 600 m culet diamonds. The cell was loaded by condensing high purity liquid oxygen in a sealed vessel at low temperature. Pressure is measured by the shift of the ruby fluorescence wavelength 111The calibration curve, taken from Ref. Mao et al. (1986), is given by where =694.28 nm.. The sample dimensions were about 300 m in diameter, and 80 m in thickness. The IXS measurements were performed at room temperature at 0.88, 2.88 and 5.35 GPa ( GPa). The highest pressure experimental point is close to the melting line, but still in the fluid phase as was obtained by melting the crystal along an isothermal decompression (300 K) under visual inspection by using a microscope.
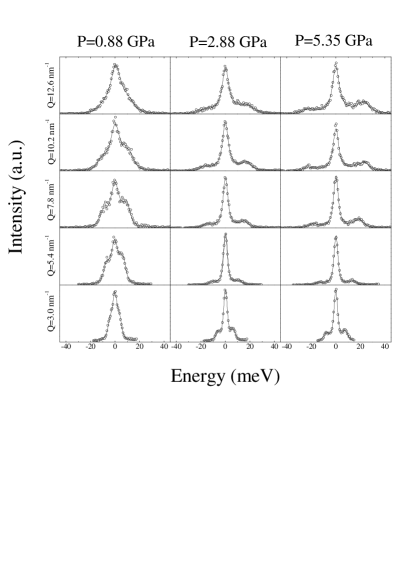
The evolution of the IXS spectra as a function of the momentum transfer, , is shown in Fig.1 for the nm-1 -range and for the three investigated pressure values. The inelastic signal can be clearly observed at the two sides of the quasi-elastic line: it is structured at the low -values, and it becomes broad and featureless on increasing , although it is still well visible on top of the tails of the quasi-elastic peak.
The IXS spectra are related to the classical dynamic structure factor through the detailed balance factor and the instrumental resolution function, , through:
| (1) |
A model for the classical has been obtained exploiting the generalized hydrodynamic approach, in which the dynamic structure factor is related to the second order memory function through Balucani and Zoppi (1983):
| (2) |
In this expression , being the molecular mass, the Boltzmann constant and the static structure factor, and is the memory function in the frequency domain. In the hydrodynamic limit, the decay of the memory function proceeds via a timescale related to the thermal diffusivity , where is the specific heat ratio. A second decay, whose timescale () is related to the typical structural relaxation time, is introduced to account for the viscoelastic nature of the system. Finally, a third, microscopic, relaxation time is introduced to represent the effect of the disordered instantaneous atomic arrangement on the propagation of the density fluctuation at a given Q. As in most cases Scopigno et al. (2005), this third contribution can be considered as ”instantaneous”, and represented by a delta-function. Consequently, the memory function in the time domain reads:
| (3) |
In this expression is the amplitude of the microscopic process, while is the intensity of the structural process, being and the low and high frequency sound velocities respectively . By plugging this expression into Eq. (2), and using Eq. (1), we were able to describe the experimental data, as shown by the best fit reported in Fig. 1. In the fitting procedure, the parameters , , and were left free, and were fixed to their =0 values obtained by the Impulsive Stimulated Thermal Scattering (ISTS) data Abramson et al. (1999a, b).
| [GPa]) | ||
|---|---|---|
| 1920 | 2340 | |
| 2.88 | 2980 | 3600 |
| 5.35 | 3680 | 4440 |
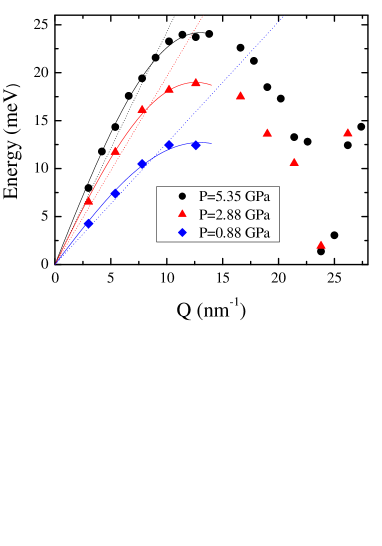
In Fig. 2 we report the dispersion curves as determined by IXS at the three investigated pressures. These were obtained from the maxima of the current correlation spectra (circles), utilizing the fit results for the model . For space reason the values of the other fitting parameters are not reported here. For each pressure, the low slope of the evolution of the energy values represents the sound velocity measured at high frequency. We note that the observed high frequency sound velocity values always lie above the low frequency, adiabatic sound velocity measured by the ISTS technique Abramson et al. (1999a)(see Table 1) 222Since above the melting temperature both the structural and microscopic relaxation times are below the picosecond, and the frequency of an ISTS experiment is in the GHz range, the condition is always fulfilled. Hence, the adiabatic, low frequency sound velocity is probed in this kind of experiments.. This result demonstrates the presence of positive dispersion -the fingerprint of a liquid-like dynamics- in a supercritical fluid well above its and . As an immediate consequence, one has to rule out the idea that the critical temperature alone marks the boundary of simple liquid dynamics.
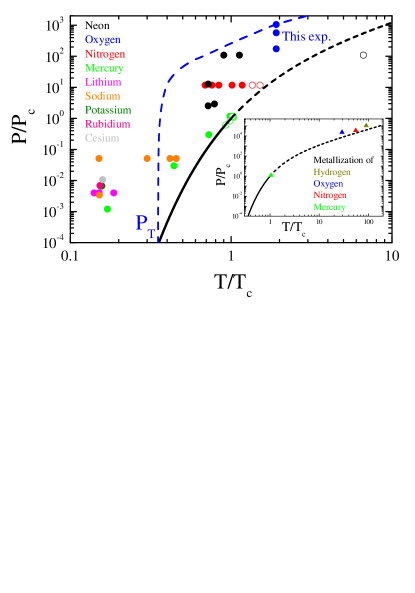
In order to asses what really determines the end of the simple liquid dynamics regime, we compared the present results for oxygen to existing literature data. In fig 3 we highlight the presence of positive dispersion in a library of fluids at several thermodynamic points. Full and open circles indicate a positive dispersion above and below 5, respectively. As it can be seen, systems around or moderately below the critical temperature, but well above still exhibit positive dispersion, which fades out on increasing temperature. What is really surprising is that positive dispersion still persists in a strongly supercritical system, the case of Oxygen reported here, in which both temperature and pressure are well above the critical point. In order to rationalize such a puzzling behaviour, we report in Fig. 3 the Plank-Riedel equation for the coexistence line Plank and Riedel (1948):
| (4) |
The values of a, b and c (a=4.270, b=-4.271 and c=1.414) have been obtained by fitting the liquid-vapour coexistence lines of Neon, Oxygen and Nitrogen Medard (1976). Eq. 4 can represent the noble gases liquid-vapour coexistence line Medard (1976) in the spirit of the principle of corresponding states, but it also describes rather well the liquid-vapour coexistence line for the other simple fluids discussed here (see Fig. 3). This curve is extrapolated here above the critical point. On the basis of Fig. 3, one is led to conclude that the end of simple liquid dynamics is identified by the extrapolation of the coexistence line although, on a strict thermodynamical ground, such line has a well defined meaning only below the critical point.
Recent shock wave measurements have shown a density and temperature driven non metal-metal transition in hot dense fluid Oxygen Bastea et al. (2001), Nitrogen Chau et al. (2003) and Hydrogen Weir et al. (1996) at thermodynamic points which surprisingly lie on the proposed extrapolation line, much above the region where acoustic properties have been investigated (inset of figure 3). Also in the case of Mercury, which is a metallic liquid and an insulator gas Hensel and Frank (1968), the non metal- metal transition in the supercritical fluid, observed slightly above the critical point, takes place around the extrapolation of the liquid-vapour coexistence line, see Fig. 3. As a matter of fact, the metal-non metal transition of expanded mercury, which has been extensively studied Ishikawa et al. (2004) and references therein), appears to be related to the density decrease which takes place on crossing the extrapolation of the liquid-vapour coexistence line. Furthermore the positive dispersion disappears on crossing the same extrapolation, as shown in Fig. 3, so that in this case we have the exact coincidence of the two phenomena: the change in dynamics and the metallization transition.
In conclusion, we have shown here that a strongly supercritical fluid (Oxygen at and ) exhibits dynamical properties that are commonly ascribed to ordinary liquids. Based on the comparison with the behavior of several other fluids as a function of their thermodynamic state, we conclude that the extrapolation well above the critical point of the liquid-vapor coexistence line marks the boundary between simple liquid dynamics and the collision dominated regime characterizing the gas phase. Furthermore, the existing data on the location of the non metal-metal transition of mercury and of hot dense simple fluids obtained by shock wave experiments indicate that the structural changes which take place on crossing the extrapolation of the liquid-vapor coexistence line are also responsible for the non metal-metal transition in overcritical fluids.
We suggest that the extension of the coexistence line beyond the critical point splits the P-T phase diagram of simple fluids into a gas-like and a liquid-like domain, respectively, which differ in the local structure, resembling the sub-critical behaviors. Specifically, the ”liquid-like phase” is expected to be denser and less rich in entropy than the ”gas-like phase”. These differences, even if subtle at a first glance, could support the major changes observed in the dynamical and transport properties. If this point will be confirmed by further experiments on different fluids and on an extended thermodynamic region, it would imply a profound interconnection between structural modifications in fluid materials occurring at very different P-T conditions which, in turn, could stimulate and support a new extended and unified view of fluid matter thermodynamics.
We acknowledge Alexandre Beraud for assisting us during the experiment.
References
- Burkel (1991) E. Burkel, Inelastic Scattering of X-rays with very high Energy Resolution (Springer Verlag, Berlin, 1991).
- Sette et al. (1995) F. Sette, G. Ruocco, M. Krisch, U. Bergmann, C. Masciovecchio, V. Mazzacurati, G. Signorelli, and R. Verbeni, Phys. Rev. Lett. 75, 850 (1995).
- Scopigno et al. (2005) T. Scopigno, G. Ruocco, and F. Sette, Rev. Mod. Phys. 77, 881 (2005).
- Sette et al. (1998) F. Sette, M. Krisch, C. Masciovecchio, G. Ruocco, and G. Monaco, Science 280, 1550 (1998).
- Ruocco et al. (1996) G. Ruocco, F. Sette, M. Krisch, U. B. C. Masciovecchio, V. Mazzacurati, G. Signorelli, and R. Verbeni., Nature 379, 521 (1996).
- Ruocco and Sette (2001) G. Ruocco and F. Sette, J. Phys. C 13, 9141 (2001).
- Scopigno et al. (2003) T. Scopigno, G. Ruocco, F. Sette, and G. Monaco, Science 302, 849 (2003).
- Scopigno et al. (2000) T. Scopigno, U. Balucani, G. Ruocco, and F. Sette, Phys. Rev. Lett. 85, 4076 (2000).
- Ruocco et al. (2000) G. Ruocco, F. Sette, R. Di Leonardo, G. Monaco, M. Sampoli, T. Scopigno, and G. Viliani, Phys. Rev. Lett. 84, 5788 (2000).
- Hosokawa et al. (2002) S. Hosokawa, H. Sinn, F. Hensel, A. Alatas, E. E. Alp, and W.-C. Pilgrim, J. Non-Cryst. Solids 312-314, 163 (2002).
- Scopigno et al. (2002) T. Scopigno, U. Balucani, G. Ruocco, and F. Sette, Phys. Rev. E 65, 031205 (2002).
- Monaco et al. (2004) A. Monaco, T. Scopigno, P. Benassi, A. Giugni, G. Monaco, M. Nardone, G. Ruocco, and M. Sampoli, J. Chem. Phys. 120, 8089 (2004).
- Copley and Rowe (1974) J. R. D. Copley and M. Rowe, Phys. Rev. A 9, 1656 (1974).
- Bodensteiner et al. (1992) T. Bodensteiner, C. Morkel, W. Gläser, and B. Dorner, Phys. Rev. A 45, 5709 (1992).
- Cunsolo et al. (2001) A. Cunsolo, G. Pratesi, R. Verbeni, D. Colognesi, C. Masciovecchio, G. Monaco, G. Ruocco, and F. Sette, J. Chem. Phys. 114, 2259 (2001).
- Cunsolo et al. (1998) A. Cunsolo, G. Pratesi, G. Ruocco, M. Sampoli, F. Sette, R. Verbeni, F. Barocchi, M. Krisch, C. Masciovecchio, and M. Nardone, Phys. Rev. Lett. 80, 3515 (1998).
- Bencivenga et al. (2006) F. Bencivenga, A. Cunsolo, M. Krisch, G. Monaco, G. Ruocco, and F. Sette, Europhys. Lett. 00, 0000 (2006).
- Balucani and Zoppi (1983) U. Balucani and M. Zoppi, Dynamics of the liquid state (Clarendon Press, Oxford, 1983).
- Abramson et al. (1999a) E. Abramson, L. Slutsky, M. Harrell, and J. Brown, J. Chem. Phys. 110, 10493 (1999a).
- Abramson et al. (1999b) E. Abramson, L. Slutsky, and J. Brown, J. Chem. Phys. 111, 1999 (1999b).
- Plank and Riedel (1948) R. Plank and L. Riedel, Ingenieur-Archiv. XVI, 255 (1948).
- Medard (1976) L. Medard, Gas Encyclopaedia (Elsevier, 1976).
- Bastea et al. (2001) M. Bastea, A. C. Mitchell, and W. J. Nellis, Phys. Rev. Lett. 86, 3108 (2001).
- Chau et al. (2003) R. Chau, A. C. Mitchell, R. W. Minich, and W. J. Nellis, Phys. Rev. Lett. 90, 245501 (2003).
- Weir et al. (1996) S. T. Weir, A. C. Mitchell, and W. J. Nellis, Phys. Rev. Lett. 76, 1860 (1996).
- Hensel and Frank (1968) F. Hensel and E. U. Frank, Rev. Mod. Phys. 40, 697 (1968).
- Ishikawa et al. (2004) D. Ishikawa, M. Inui, K. Matsuda, K. Tamura, S. Tsutsui, and A. Q. R. Baron, Phys. Rev. Lett. 93, 097801 (2004).
- Young et al. (1987) D. A. Young, C.-S. Zha, R. Boehler, J. Yen, M. Nicol, A. S. Zinn, D. Schiferl, S. Kinkead, R. C. Hanson, and D. A. Pinnick, Phys. Rev. B 35, 5353 (1987).
- van Well and de Graaf (1985) A. A. van Well and L. A. de Graaf, Phys. Rev. A 32, 2396 (1985).
- Mao et al. (1986) H. K. Mao, J. Xu, and P. M. Bell., J. Geophys. Res. 91, 4673 (1986).