Photoinduced Fano-resonance of coherent phonons in zinc
Abstract
Utilizing femtosecond optical pump-probe technique, we have studied transient Fano-resonance in zinc. At high excitation levels the Fourier spectrum of the coherent E2g phonon exhibits strongly asymmetric line shape, which is well modeled by the Fano function. The Fano parameter (1/Q) was found to be strongly excitation fluence dependent while depending weakly on the initial lattice temperature. We attribute the origin of the Fano-resonance to the coupling of coherent phonon to the electronic continuum, with their transition probabilities strongly renormalized in the vicinity of the photoinduced structural transition.
pacs:
78.47.+p, 63.20.Kr, 78.66.BzFano-resonance in the linear optical spectra occurs when optical transition paths from a given ground state to a discrete state and an overlapping continuum of states interfere with each otherFano61 . It has been studied in a variety of phenomena including photo-absorption in atomsFano61 , phonon spectra in solidsCerdeira73 , and photo-absorption in quantum well structuresFaist97 , just to mention a few.
The mechanism responsible for the Fano-resonance in phonon spectra has been debated for decades. It has been concluded that both interband or intraband electronic transitions can give rise to the continuum overlapping the optical phonon energy in semiconductors, such as SiCerdeira73 ; Chandrasekhar78 ; Chandrasekhar80 and GaAsNunes93 , as well as in semimetals, like SbBansal86 . On the other hand, for complex oxides, like ferroelectrics and cuprate superconductors, the continuum originates from broad multi phonon processesRousseau68 ; Mihailovic93 . In both cases, the phonon spectra can be fitted to a Fano lineshape, characteristic of a continuous-discrete interference:Fano61 ; Cerdeira73
| (1) |
Here , where is the unperturbed frequency, the frequency shift, the broadening parameter, and is the dimensionless asymmetry parameter. Parameters and are defined asCerdeira73
| (2) |
Here and are the probabilities for one-phonon and electronic (or multiple-phonon) Raman scattering, respectively, and is the matrix element of the interaction between the discrete level and continuum.
In metals there have been theoretical discussions on the Fano-interference effects, in which both interband- and intraband-electronic Raman scattering can contribute to the electronic continuumKlein82 . However, experimental investigation of the Fano-interference in metals has been inaccessible by conventional time-integrated methods like Raman scattering.Grant73 ; Bolotin01 This can be attributed to either the very fast dephasing of the electronic continuum or to screening of electron-phonon coupling.
Femtosecond (fs) real-time probes present an experimental alternative to the conventional time-integrated methods. These techniques have an additional advantage to conventional spectroscopy, since they utilize photoexcitation to study both buildup and the decay of the Fano-resonance in time. Utilizing femtosecond four-wave mixing technique Siegner et al. studied the dynamics of Fano-resonance in GaAsSiegner95 . Recently, transient Fano-type antiresonance between non-equilibrium carriers and coherent LO phonon in Si was also reportedHase03 , with the lifetime estimated to about 100 fs. Moreover, a possibility of observing a build-up of the Fano-resonance on a sub-fs time scale in an atom was also recently addressedWickenhauser05 . Thus, in the photoexcited state the coherence between the discrete state and the continuum is expected to be short-lived, with the relaxation dynamics governed by dephasingSiegner95 .
While photoexcited carrier dynamics in metals have been extensively studied by fs pump-probe techniquesFann92 , only recently observation of coherent optical phonons in metals has been reported. Using high sensitivity pump-probe techniques, such as second harmonic generation, and transient reflectivity, coherent optical phonons have been studied in GdMelnikov03 ; Bovensiepen04 , Cd and ZnHase05 . However, Fano-resonance between discrete coherent phonons and electron or multiple-phonon continua have not yet been explored. In this paper, we present a time-domain observation of transient Fano-resonance in metals under the high-density optical excitation. At high perturbation densities the Fourier transformed (FT) spectra of the coherent optical phonon exhibit strongly asymmetric Fano-type line shapes. The line-shape depends strongly on the pump excitation level but only weakly on the lattice temperature ().
The sample studied was a single crystal of Zn with cut and polished (0001) surface. The fs pump-probe measurements were carried out in a temperature range from = 7 to 300 K using a cryostat. Femtosecond pulses from a Ti:sapphire oscillator were amplified to a pulse energy of 5J (center wavelength 800 nm and pulsewidth of 130-fs) at the repetition rate of 100 kHz. The pump beam was focused on the sample to a spot of 70 m in diameter, while that of the probe beam was 40 m to assure homogeneous photoexcitation. The pump power density () was kept below 5 mJ/cm2 to prevent sample damage damage , while the probe fluence was fixed at 0.1 mJ/cm2. To record photoinduced changes in reflectivity () as a function of time delay we used lock-in detection where the pump-beam was chopped at 2 kHz.
Figure 1(a) presents the time-resolved signal obtained in Zn at = 7 K with varied between 0.68 and 4.10 mJ/cm2. The photoinduced reflectivity transient consist of two componentsHase05 . The first is the initial transient (non-oscillatory) response due to excitation and relaxation of nonequilibrium carriers, which decays in a few hundred fs. The second component is the oscillatory signal due to the generation of the coherent lattice vibration. The time period of the observed coherent oscillation corresponds to the bulk optical phononHase05 .
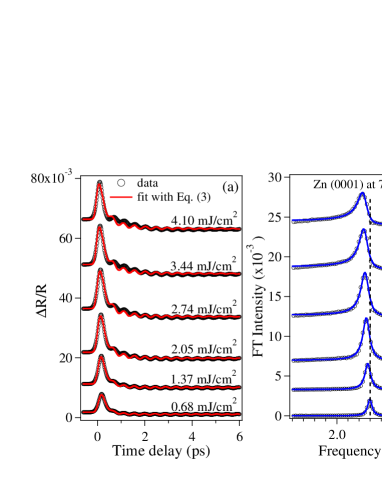
To fit the time domain data and to obtain the amplitude, frequency and the dephasing time of the coherent optical phonon, we examined a linear combination of a damped harmonic oscillator and a stretched exponential decay function (STE):
| (3) |
Here is the Heaviside function convoluted with Gaussian to account for the finite time-resolution, while , , and are the amplitude, decay rate (damping), frequency and the initial phase of the coherent phonon response, and , , and (0 1) are the amplitude, relaxation time and stretching parameter of the fast electronic transient. The choice of a STE function to fit the decay of the incoherent electronic response is merely a matter of preference and is not associated with some underlying relaxation mechanism. Since the decay was found to be non-exponential, as expected in this high perturbation regime, we have chosen a STE function since it describes the incoherent response quite accurately at all Fit .
As shown in Fig. 1(a), at the low pump fluences the time-domain data are very well represented by Eq. (3). The extracted frequency of the coherent optical phonon is found to be 2.30 THz at 0.68 mJ/cm2, in excellent agreement with that of the mode observed by Raman scatteringGrant73 . At high fluences, however, the coherent response cannot be fitted by a simple damped oscillator over the entire time range. In fact, there is a significant phase-shift of the coherent phonon at the early time delays, which cannot be modeled by a simple damped oscillator. This discrepancy, observed only at early time delays and in the high excitation regime, is ascribed to a coherent correlation between the phonon and other photogenerated excitations.
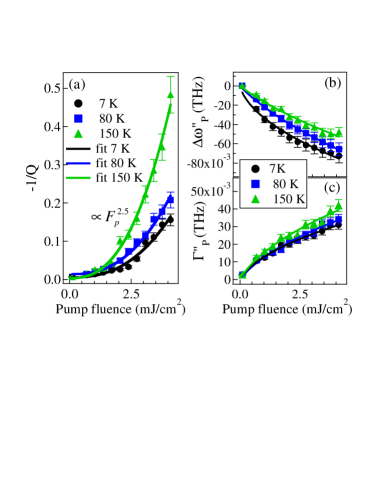
The FT spectra obtained from the time domain data are shown in Fig. 1(b). They show a red-shift of the peak frequency and broadening of the linewidth of the mode as increases. However, the most striking feature of the FT spectra is an asymmetric Fano-like line shape observed at mJ/cm2. Such an asymmetric line shape has not been observed by Raman studyBolotin01 . The spectrum can be well fitted with Fano function. The parameters, extracted from the fit to the data with Eq. (1), are plotted in Fig. 2 as a function of excitation level and lattice temperature. The Fano parameterFanoparameter was found to be negative, similar to that observed for the optical phonon in n-Si using Raman scatteringCerdeira73 ; Chandrasekhar78 , or the asymmetric coherent mode in a cuprate superconductor observed using pump-probe techniqueMisochko00 . The absolute value of the Fano parameter significantly increases with , suggesting that coupling between the phonon and the continuum is strongly enhanced at high excitation densities.
As pointed out above both inter- and intra-band electronic Raman scattering can give rise to the continuum interacting with optical phononKlein82 . In metals, such as Zn and Cd, interband electronic Raman scattering is possible and would dominate total scattering efficiencyKlein82 . This process would involve interband electronic transitions along the small band gap in the AL direction of the Brillouin zone, which is due to spin-orbit interaction, and could be responsible for the formation of the electronic continuum interacting with the optical phononBolotin01 . On the other hand, intraband Raman scattering is also possible in metalsKlein82 . Due to the finite optical penetration depth , the scattering wavevector has a distribution ranging from 0 to . This leads to the electronic Raman scattering with a continuum transitions over the range of , where is the Fermi velocity. In Zn, THz, thus there is a significant overlap with the optical phonon at 2.3 THz.
The phonon continuum due to two-phonon resonances (or Fermi-resonance) also needs to be considered, since the anharmonic phonon-phonon coupling can also be the origin of a Fano interferenceMihailovic93 ; Kanellis86 . In Zn the energy of the (TO) mode is close to the difference between LA ( 6 THz at ) and TA ( 4 THz at ) modes (2 -2.5 THz). Therefore, the coupling of the mode with the two-phonon continuum is also possible. However, the anharmonic phonon-phonon coupling depends on the lattice temperatureKanellis86 , rather than the pump fluence. We have analyzed the data taken at low pump fluence (9.2 J/cm2) from Ref.Hase05 . The time-domain data are well fitted by Eq. (3) over the entire temperature range. As the temperature increases from 7 K to room temperature, the peak frequency of the FT spectra shifts to lower frequencies, which is accompanied by broadening of the line shape. Both observations are consistent with the anharmonic lattice effectsHase05 . However, no asymmetry of the line is observed as in the high excitation regime. Moreover, as seen in Fig. 2 (a), the Fano parameter strongly depends on the excitation level and therefore on the photoexcited carrier density, but only weakly on the initial lattice temperature.ElectronTemperature At the low pump fluence, = 9.2 J/cm2, the values over the entire -range are nearly zero, implying that the line shape is LorentzianFano61 . These facts indicate that the contribution from the two-phonon continuum is negligibly small.
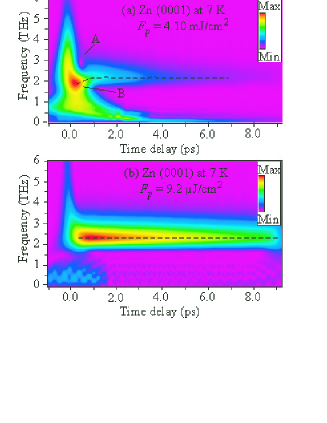
From the analysis presented in Figure 1, where the discrepancy between the data and the theoretical fit is observed only at early time delays, it follows that Fano resonance is short-lived. To further elucidate the dynamics of Fano resonance, we utilize continuous wavelet transform (CWT) methodHase03 , to obtain the time-frequency chronograms from the time-domain data presented in Fig. 1. Note that the incoherent part of the photoinduced reflectivity was subtracted. As seen in Fig. 3, a signature of a Fano resonance appears at ps. Here both the destructive (or anti-resonance) interference at THz (A) and constructive interference at THz (B) are observed.PhononSoftening In contrast, no anti-resonance at short time delays is observed in the low excitation limit [Fig.3(b)] Thus, the CWT chronogram reveals that under the high density excitation the Fano-resonance is established on a very short time scale.
To obtain a deeper insight into the nature of the observed excitation intensity dependence of the Fano interference we analyze the fluence dependence of the parameters , and extracted from the fit of the FT data at various temperatures and excitation fluences. To differentiate between the effects of temperature and the excitation intensity on and we plot in Figs. 2(b) and 2(c) only the intensity dependent parts and . Here , where is the value of frequency shift in the limit of , extracted from the data in Ref. Hase05 . Similarly , where is the value of in the limit of , and is determined from the fit to the data obtained at J/cm2.
Both and show a slight sublinear dependence on , , where depending slightly on temperature [see solid lines in Fig. 2 (b) and (c)]. The Fano parameter also shows a power law excitation intensity dependence and can be at all temperatures well fit by over the wide range of excitation fluences [see Fig. 2(a)]. From the available data it is impossible to pinpoint the microscopic origin of the photoinduced Fano interference in Zn observed in the high excitation regime. However, some conclusions can be drawn from the observed fluence dependence of , and . Since both and are roughly proportional to the square of the electron-phonon matrix element Cerdeira73 ; Chandrasekhar78 , the fluence dependence of the two suggests that photoexcitation results in an increase of the electron phonon matrix element, where . However, changes in the electron-phonon matrix element itself cannot account for the dramatic excitation dependence of the asymmetry parameter - see Eq. 2 Note1 . In order to account for the strong excitation dependence of , it follows that should also be strongly excitation fluence dependent. Since in the absence of changes in the electronic and lattice structure both and should be independent, the strong fluence dependence of , which follows from the strong dependence of the asymmetry parameter, suggests a pronounced changes in the electronic structure upon photoexcitation. Indeed, based on the published values of the absorption coefficient, reflectivity, and plasma frequency of Zn, it follows that at mJ/cm2 photoinduced carrier density (the number density of initially created e-h pairs) is of the total carrier density. This number is comparable to that of Ref. Guo00 , where photoinduced carrier density of 15 % resulted in band structure collapse and the solid-to-liquid structural phase transition in photoexcited Al. We should further note, that very similar saturation of the photoinduced reflectivity is observed at mJ/cm2 in Zn [see Fig. 1 (a)] as observed in Al Guo00 , supporting the idea that the observed strong dependence of the Fano parameter may be due to strong renormalization of the probabilities for one-phonon and electronic Raman scattering under high density perturbations in the vicinity of the solid-to-liquid structural transition.
In summary, the transient photoinduced Fano-resonance between coherent phonon and electron continuum in Zn have been observed under the high density excitation. As the excitation fluence increases, the FT spectra exhibited strongly asymmetric phonon lines, which were well modeled by the Fano line shape. The broadening and the frequency shift are shown to depend on the excitation level, which is attributed to the photoinduced increase in the electron-phonon matrix element. However, the strong fluence dependence of the Fano parameter implies also strong changes in the ratio of probabilities for phonon and electronic Raman scattering. This observation is attributed to the strong perturbation level close to the photoinduced melting.
The authors acknowledge O. V. Misochko for helpful comments. This work was supported in part by KAKENHI -16032218 from MEXT, Japan.
References
- (1) U. Fano, Phys. Rev. 124, 1866 (1961).
- (2) F. Cerdeira, T. A. Fjeldly, and M. Cardona, Phys. Rev. B 8, 4734 (1973).
- (3) J. Faist, F. Capasso, C. Sirtori, K. W. West, and L. N. Pfeiffer, Nature 390, 589 (1997).
- (4) M. Chandrasekhar, J. B. Renucci, and M. Cardona, Phys. Rev. B 17, 1623 (1978).
- (5) M. Chandrasekhar, H. R. Chandrasekhar, M. Grimsditch, and M. Cardona, Phys. Rev. B 22, 4825 (1980).
- (6) L. A. O. Nunes, L. Ioriatti, L. T. Florez, and J. P. Harbison, Phys. Rev. B 47, 13011 (1993).
- (7) M. L. Bansal and A. P. Roy, Phys. Rev. B 33, 1526 (1986).
- (8) D. L. Rousseau and S. P. S. Porto, Phys. Rev. Lett. 20, 1354 (1968).
- (9) D. Mihailovic, K. F. McCarty, and D. S. Ginley, Phys. Rev. B 47, 8910 (1993).
- (10) M. V. Klein, in Light Scattering in Solids III, edited by M. Cardona and G. Güntherodt, Topics in Applied Physics Vol. 51 (Springer-Verlag, Berlin, 1982), p. 140.
- (11) W. B. Grant, H. Schulz, S. Hüfner, and J. Pelzl, Phys. Stat. Sol. (b) 60, 331 (1973).
- (12) G. A. Bolotin, Yu. I. Kuz’min, Yu. V. Knyazev, Yu. S. Ponosov, and C. Thomsen, Phys. Sol. State, 43, 1801 (2001).
- (13) U. Siegner , M. -A. Mycek, S. Glutsch, and D. S. Chemla, Phys. Rev. Lett. 74, 470 (1995).
- (14) M. Hase, M. Kitajima, A. M. Constantinescu, H. Petek, Nature 426, 51 (2003).
- (15) M. Wickenhauser, J. Burgdörfer, F. Krausz, and M. Drescher, Phys. Rev. Lett. 94, 023002 (2005).
- (16) W. S. Fann, R. Storz, H. W. K. Tom, and J. Bokor, Phys. Rev. Lett. 68, 2834 (1992).
- (17) A. Melnikov, I. Radu, U. Bovensiepen, O. Krupin, K. Starke, E. Matthias, and M. Wolf, Phys. Rev. Lett. 91, 227403 (2003).
- (18) U. Bovensiepen, A. Melnikov, I. Radu, O. Krupin, K. Starke, M. Wolf, and E. Matthias, Phys. Rev. B 69, 235417 (2004).
- (19) M. Hase, K. Ishioka, J. Demsar, K. Ushida, and M. Kitajima, Phys. Rev. B 71, 184301 (2005).
- (20) At excitation levels above 5 mJ/cm2 melting of the sample was observed at 300 K.
- (21) Fano lineshape is observed no matter what kind of function is used to subtract the incoherent response (e.g. double exponential, stretch and so on), and the observed fluence dependence of Fano parameter is qualitatively the same in any case.
- (22) It is convenient to study the evolution of the Fano line shape in terms of the Fano parameter where in the limit of 0, the Fano line shape becomes Lorentzian, indicating the coupling strength is negligibly small.
- (23) O. V. Misochko, K. Kisoda, K. Sakai, and S. Nakashima, Phys. Rev. B 61, 4305 (2000).
- (24) G. Kanellis, W. Kress, and H. Bilz, Phys. Rev. Lett. 56, 938 (1986).
- (25) At the pump fluence of 4.10 mJ/cm2, the final electronic temperature is estimated to be 5500 K and depends marginally on the initial temperature . On the other hand, the lattice temperature after electron-phonon thermalization reaches 500 K, where the lattice heating being dependent on . However, since the Fano-resonance is observed within 1 ps (see Fig. 3), contribution of the lattice heating, which arises after a few ps, to the Fano-resonance is negligibly small.
- (26) The CWT spectra exhibit phonon softening at 0.5 ps, which might be due to lattice anharmonicity and/or the plasma-induced softening. The existence of the dip, however, can be explained neither by the anharmonicity nor the plasma-induced softening, both of which only broaden the phonon spectra toward low frequency side.
- (27) results in only weak dependence of with .
- (28) C. Guo, G. Rodriguez, A. Lobad, and A. J. Taylor, Phys. Rev. Lett. 84, 4493 (2000).