Quantitative Evaluation of the Effects of Positional versus Orientational Disorder on the Scattering of Acoustic Phonons in Disordered Matter
Abstract
The phonon scattering processes on the three solid phases of ethanol are investigated by means of thermal conductivity, light and neutron scattering measurements as well as molecular dynamics simulations on single-crystalline models for the two crystalline modifications (fully ordered monoclinic and orientationally disordered phases). The orientationally disordered crystal is found to exhibit a temperature dependence of the thermal conductivity that is remarkably close to that found for the structurally amorphous solid, specially at low temperatures. The results, together with measurements of the Brillouin linewidths as derived from light scattering measurements emphasize the role of orientational disorder on phonon scattering. The experimental results obtained on polycrystal samples are then discussed with the aid of computer simulations on single-crystalline models of both and monoclinic crystals. Our findings are in good agreement with the wealth of thermodynamic and dynamic data available so far eto1 , but are in stark contrast with inferences made from the analysis of inelastic X-ray data on polycrystalline samples matic , where a common nature for the excitations in all phases is postulated.
pacs:
66.70.+f,65.60.+a,61.43.+j,63.50.+x,63.20.LsI Introduction
The present understanding of the mechanisms governing heat transport in disordered media rests upon concepts grounded on heat-pulse experiments showing that acoustic phonons, specially those having transverse polarization are the main heat carriers vu . The lifetime and therefore the mean-free-path of such excitations is known to be severy limited due to the action of several scattering mechanisms which are additional to those mainly dealing with the kinematics of the phonon gas, that are well established for fully ordered crystals.
One of the most striking findings revealed from work carried out over the last couple of decades, concerns the quantitative similarities exhibited by the thermal conductivity of bulk amorphous materials rev between say 0.1 K and 10 K, independent of chemical composition. In fact, from the collected dataset, which now includes a good number of disordered crystals, including a quasicrystal rev ; quasi , it is found that the ratio of the wavelength of the acoustic wave to the mean free path of all these solids ranges within 10-2 - 10-3, which suggests the presence of ‘’universal” behavior of some sort. On such grounds, it is becoming increasingly clear that the presence of ‘’glassy dynamics” cannot be attributed in full to the absence of static translational long-range order (LRO).
Within the disordered crystals referred to above, some molecular or ionic materials where the constituent particles have random static orientations while their centers of mass sit at the nodes of a three dimensional crystalline lattice are also known to exhibit glass-like excitations. Within those, solid ethyl alcohol is perhaps the most convenient benchmark to carry out a quantitative comparison of the effects brought forward by the complete lack of LRO eto1 on the most sensitive property to explore the propagation of excitations in condensed matter, such is the thermal conductivity. The material, apart from the well known monoclinic crystalline (fully ordered, Z = 2, FOC) modification, can be prepared in three long-lived (although metastable) phases, that are an amorphous solid or glass, an orientationally-disordered crystal, ODC (or orientational glass) showing static orientational disorder but having translational LRO since the molecules sit at the nodes of a lattice, and a crystal with dynamic orientational disorder (rotator-phase crystal or RPC) which retains LRO as a lattice still exists. Two calorimetric glass-transitions eto1 take place about the same range of temperatures and centered about 97 K and correspond to the canonical glass supercooled liquid and a rotational freezing transition ODCRPC eto1 , that is well understood as a purely dynamic phenomenon (see M.Jimenez-Ruiz et al. in Ref. eto1 ).
Here we report on measurements of the thermal conductivity of ethyl alcohol for all the solid phases as well as on measurements of the acoustic phonon lifetimes as determined by means of optical Brillouin scattering. Our aim in pursuing such a route is twofold. First and foremost, as stated in a recent review rev the measurements will provide additional tests on claims of quantitative ‘’universality” on the properties of heat propagation at low and intermediate temperatures on disordered matter brought forward by a class of materials for which no data were available in Ref.rev . On a more fundamental vein, our study also aims to verify recent claims concerning high-frequency (i.e. THz) acoustic excitations sampled in disordered matter by means of inelastic X-ray (IXS) or neutron scattering (INS) silica ; lb . More specifically, our results may contribute to clarify whether the spectral feature characteristic of the INS or Raman spectra of most glasses usually referred to as the ‘’Boson peak” can be taken as a signature of a high-frequency limit beyond which acoustic excitations become localised as proposed by some authors silica ; lb , or contrary to that, phonons may propagate down to microscopic scales without having their lifetimes limited by strong scattering processes, as known to be the case for excitations up to GHz frequencies. In this respect, here we will particularly focus onto some details concerning the nature of the spectral response observed by means of IXS on polycrystals of the same material matic , for which two rather different interpretations have been proposed matic ; lb . To the ends just delineated, we complement the experimental study with calculations of the phonon frequencies and linewidths for both the FOC and ODC carried out by means of Molecular Dynamics simulations on single-crystalline models of both materials using for the purpose well contrasted intermolecular potentials miguel . In doing this we will follow the evolution of the coherent dynamic structure factor accross the first Brilloin zone deriving unambiguous estimates for the phonon frequencies and inverse lifetimes, an exercise which cannot be pursued in polycrystalline samples as known since long dewette . Such calculations are complementary to previous harmonic Lattice Dynamics results on the monoclinic phase carried out for a semi-rigid model which incorporates the lower lying molecular modes and has been tested against thermodynamic (i.e. specific heat data up to 30 K) and spectroscopic data such as the frequency distributions as derived from neutron scattering as well as Raman spectral data. For more details in this particular aspect the interested reader is referred to Ref.ld .
II Experiments and computational details
Thermal conductivity measurements which are detailed in Ref.sasha were carried out under equilibrium vapor pressure at 2-159 K by the steady-state potentiometric method using a special setup Krivchikov-2005 . The preparation of the glass, disordered crystal or fully ordered monoclinic phase was carried out following previously described procedures eto1
Brillouin light-scattering measurements were carried out using a multipass tandem Fabry-Perot interferometer from about 5 K up to 160 K on backscattering geometry on both glass/liquid and ODC/RPC phases. Measurements on the monoclinic modification were hampered by the strong speckle patterns arising from the sample.
Neutron inelastic scattering experiments were performed using the MARI spectrometer at ISIS (Rutherford Appleton Laboratory), using an incident energy of 15 meV and a temperature of 10 K on fully deuterated samples. The different sample states were prepared in situ, the transformation between themmonitored by means of diffraction measurements. Additional measurements on the Boson peak were carried out using teh IN14 triple axis spectrometer at the Institut Laue Langevin.
Molecular Dynamics simulations were carried out using a semi-flexible representation of the molecules and its predictive capabilities are described in Refs.miguel .
III Results
A summary of the measurements of the thermal conductivity of FOC, ODC and RPC phases is shown in the Fig.1. A glance to such a figure shows
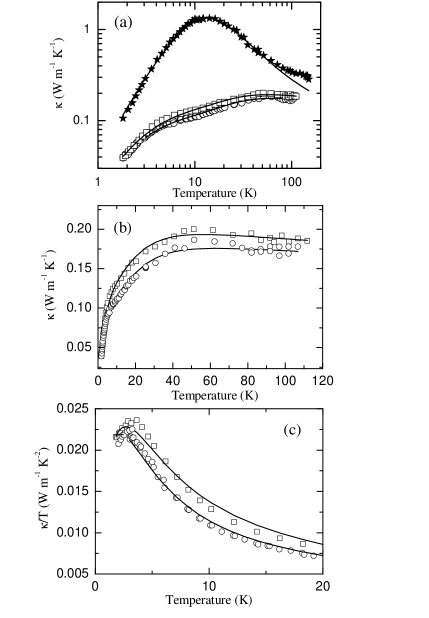
that the conductivity of the FOC phase exhibits a shape much alike that of most crystalline solids explored so far. From melting ( 159 K) down to some 27 K, the thermal conductivity follows the exponential relation with E = 38.3 0.9 K. The maximum is located at T = 12 K and below 4.5 K it then decreases following the well established behavior. Notice the abrupt decrease in thermal conductivity by 42 in a narrow temperature interval.
Both ODC and glass exhibit a temperature dependence of (T) rather similar to that of most amorphous solids rev . The thermal conductivity increases with temperature with the largest growth registered within the region below 4 K. A smeared out ‘’plateau” is then found within 5 K - 10 K, above which experiences a further increase. Such an increase lasts up T = 50 K, from where (T) for both samples shows a very mild dependence on temperature up to both glass-transitions range at 97 K. The data for the ODC closely follows that of the amorphous solid. In real numbers, the thermal conductivity of the ODC is higher than that of the structural glass by about 2 per cent at 2 K, 8 per cent at 3.2 K, 16 per cent at 10 K 12 per cent at 25 K and 85 per cent above 50 K. At temperatures beyond our data shows that for the supercooled liquid and for the RPC are both independent of temperature, its value being close to the thermal conductivity of liquid ethanol at the temperature of solidification, = 159 K.
The data has been analyzed on phenomenological grounds by means of the model of soft potentials sasha , where phonon scattering is pictured as caused by low energy excitations such as tunneling states, classical relaxors and soft quasiharmonic vibrations. As the most relevant parameters derived from fitting to such a model one gets estimates for the dimesnionless tunneling strength as well as the quentity which characterizes the crossover from a regime dominated by phonon scattering by low-energy excitations (tunneling states and classical relaxors) into another dominated by scattering by soft quasiharmonic vibrations. Numerical values for both quantities yield 8.0, 8.6 and 4.5 for the glass, ODC and FOC respectively, while those for yield 3.6 K, 4.0 K and 14.0 K for the same three phases. Put into different words, both the tunnel strenght and the crossover energy yield very close values for both glass and ODC but largely differ from that found for the fully ordered crystal.
From values found for the strength parameter a value for the ratio of the wavelength of the acoustic wave to its mean-free-path the relationship given by Pohl et al. rev a value for the ratio of the wavelength of the acoustic wave to its mean-free-path is derived,
| (1) |
and yields figures 8 10 -3, that are in quantitative agreement with data reported in Ref.rev and thus lend further support to the claim of ‘’universal” behavior there expounded since it is shown to be also followed by this class of materials. Notice that the estimate for the monoclinic crystal would come close to an order of magnitude larger and thus well outside charateristic limits of disordered matter.
A direct experimental route to asess the findings just referred to is provided by measurements of the phonon frequencies and linewidths by means of Brillouin light-scattering spectroscopy. Notice that for a disordered solid, it is within this limit where the concept of a phonon retains its physical meaning. This comes as a consequence of the fact that at scales where the experiments are typically performed that is wavevectors of the order of 10-3 Å-1 and frequencies of some GHz that are comparable to those sampled by thermal conductivity measurements, the solid behaves as an elastic continuum where acoustic excitations exhaust the frequency spectrum.
The experimental spectra consist on a single peak attributable to longitudinal phonons, the transverse component being too weak to be observed. The quantities of interest are here the Brillouin peak frequencies as well as the peak widths . From such quantities we calculate the fractional frequency shift and the ratio of Brillouin linewidth to its frequency as
| (2) |
Here, the fractional frequency shift is calculated with respect to the datum measured for T = 5 K and provides a measure of the shift with temperature of the phonon spectrum, that is an estimate of the temperature coefficient of anharmonicity. In turn, provides an estimate of phonon damping in terms of a coefficient of internal friction.
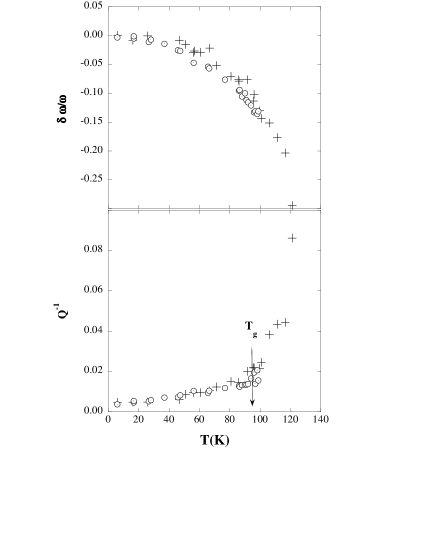
The Fig.2 displays a comparison of the evolution with temperature of both and for both glass and ODC and temperatures covering most of the range of existence of both solids. The behaviour with temperature of for both solids follow a rather mild dependence below some 30 K - 40 K which gets largely enhanced at higher temperatures. In contrast, data for the internal friction follows nearly the same quasilinear behaviour for both solids up to temperatures close to . Both measures of the anharmonic interactions in the two solids show remarkably close values, which put into different words means that the phonon scattering processes operative in both kinds of disordered systems are basically the same, which is in agreement with the thermal conductivity results described above. The results contrast with the expectancy of a far less anharmonic behavior at low frequencies for the FOC. In fact macroscopic estimates of the Gr’́uneisen coefficient (see H.E. Fischer et al. in Ref.eto1 ) for low frequencies yield values of 2.9, 4.0 and 4.4 for FOC, ODC and glass respectively.
To deepen into the origin of the differences in behavior between the two crystals, we have carried out a number of Molecular Dynamics simulations on models of both ODC and FOC single-crystals using for the purpose potentials and algorithms already tested against experimental data miguel . The calculated dynamic structure factors along the main (001, 010 and 100) crystal directions and temperatures comprising 5 K - 30 K were analyzed in detail. A sample of the results is shown in Fig.3. The lowest temperature ( 5 K) corresponds to the upper limit of the strong rise with temperature of , T = 30 K is the limiting temperature where the Debye model is able to account for the measured specific heat ld , or put into different words, where the specific heat can be fully accounted for in terms of acoustic excitations only. Finally, T = 100 K comes close to the stability limit of the ODC and also to the actual temperature where IXS measurements were conducted.
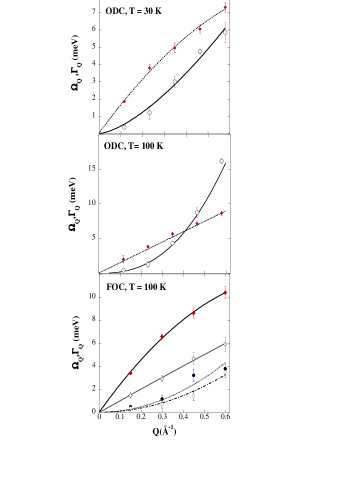
The simulation data for the ODC show that for T ¿ 5 K only the longitudinal acoustic phonon survives the strong scattering processes induced by orientational disorder. The graphs shown in the upper frame of Fig.3 for the lowest temperature depict a longitudinal branch that corresponds to a hydrodynamic sound velocity of 2639 m s-1 that remains as a well defined peak all along the Brillouin zone. Damping of such excitation follows a subquadratic dependence with wavevector, the linewidth being well approximated by Å-3/2. A transverse excitation also appears within the first two Brillouin zones. Its linear dispersion corresponds to a propagation velocity of 989 m s-1 while its large damping is accounted by a stronger than quadratic dependence Å-5/2. Increasing the temperature well above the plateau in has a scarce efect on the frequencies of the longitudinal phonon while its damping increases up to Å-3/2. The absence of a transverse acoustic branch at such temperature is here ascribed to scattering from static orientational disorder since, as shown below, such phonons are observable in the high-temperature crystal where low-energy librations are thermally populated. Increasing again the temperature up to a value consistent with that explored experimentally, that is 0.88, leads to a substantial broadening of the longitudinal mode frequencies for the ODC. These, as shown in the lower frame of Fig. 2 correspond to a hydrodynamic value for the sound velocity of 2349 m s-1, a result in agreement with light-scattering results eto1 . In addition, the phonon remains as a well defined entity up to wavevectors corresponding to one half of the Brillouin zone only, and the damping coefficient can be accounted for as . Data for the monoclinic crystal also depicted in Fig.2 show a longitudinal branch with a hydrodynamic limiting value of 3917 m s-1 together with a transverse mode propagating with a hydrodynamic velocity of 1574 m s-1. Damping of both modes is well accounted for by hydrodynamic Q-dependences with coefficients of 11.98 Å2 meV and 9.10 Å2 meV, respectively. Our data contrast with the interpretation of IXS data on polycrystals given in Ref.matic . The technique, as recently pointed out lb mostly samples inhomogeneus spectra composed by excitations additional to those of acoustic character ld which pre-empts the interpretation of maxima and linewidths of the spectral bands in terms of physical frequencies and their damping terms.
IV Discussion and Conclusions
As a starting point of the discussion lets consider the signature of static correlations for all phases of ethanol as measured by means of neutron diffraction eto1 . The Fig.4 displays a set of intermolecular static correlation functions corresponding to all the condensed phases, including the normal liquid. A glance to the figure shows, as expected, the close proximity between static correlations in liquid and glass phases as well as that existing between RPC and ODC states. Interesting enough, one notices that the main differences between the functions corresponding to the disordered crystals and those for the liquid/glass states pertain the sustained oscillations which appear having a period , where stands for the position in momentum transfers where the main reflection is located. Notice however that the relative phases of such oscillations in both fully disordered and samples are kept, irrespective of the presence of an underlying lattice.

In stark contrast, data pertaining the fully ordered crystal shows a far more complex pattern, which gets out-of-phase with those of the disordered crystals for distances beyond those characteristic of the first coordination sphere, that is above some 6 Å- 7 Å. For distances within such limit molecular orientational ordering arises from strong electrostatic and packing effects, which are expected to be not too different within the ODC and FOC states. One would then expect that excitations involving librational molecular motions would bear some resemblance in both crystals.
The lattice dynamics for the monoclinic crystal is well understood for frequencies up to about 25 meV in terms of a semirigid molecular model ld . The calculated frequency distributions compare favourably below such frequency threshold with those derived from neutron scattering for the fully hydrogenated or deuterated samples ld . The lattice dynamics model gives rise to a set of 32 dispersion branches. Within those, the acoustic modes are confined below some 8 meV, above which lies a dense mesh of mildly dispersive modes. From the analysis of the mode eigenvector components, it was found that purely acoustic modes dominate the frequency distribution below 4.2 meV and that the first well defined peak appearing at some 6 meV already has a significant optic character. The latter becomes dominant for frequencies above 9 meV. In turn, rotational and librational motions within the crsytals have been considered in detail (see Criado et al. in Ref.eto1 ) and found to correspond to reorientations amongst 24 different basic orientations set by crystal site and molecular point symmetries. The frequency distribution of such motions covers a wide range extending up to about 20 meV. Furthermore, as shown by H.E. Fischer et al. in Ref.eto1 , the frequency spectra for both glass and ODC are remarkably close and show below 5 meV the characteristic excess modes of glassy matter. In comparison, the first van Hove singularity that corresponds to zone boundary transverse acoustic phonons is still seen at 80 K. Subsequent analysis of the spectral distributions for both glass, ODC and FOC in terms of frequency moments has shown how the lower order moments (up to ), that are related to low frequencies and are thus pertinent for glass physics, for both glassy phases differ from that for the FOC, while higher order moments that weigth the higher frequencies become increasingly close for all the three phases. The facts just referred to serve to understand the close similitude of results for glass, ODC and FOC reported on Ref.matic . Such similarity comes as a consequence of the closely related spectra of molecular orientational modes in all the three phases which dominates the frequency range explorable by the IXS technique. However the spectra for the glassy phases becomes strinkingly different from that of the FOC within the freqenecy range dominated by the acoustic modes as the Fig.5 exemplifies. In other words, and to put things explicitly, the results reported on by in Ref.matic are to be taken as descriptive at best since the analysis there pursued where all the IXS intensities below some 22 meV are described in terms of a single physical frequency is not meaningful.
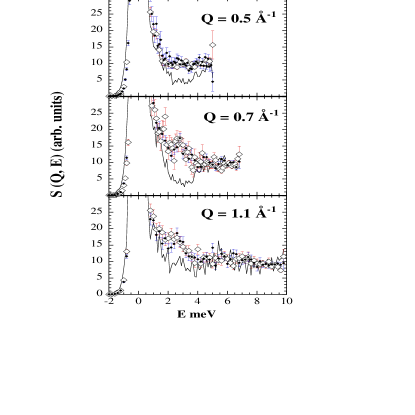
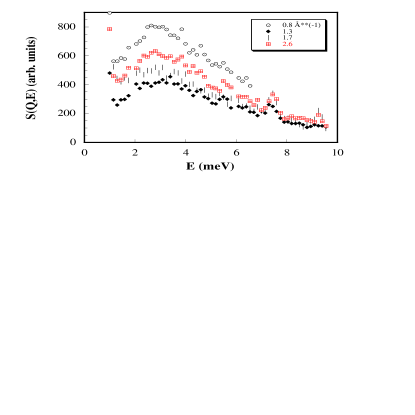
Our final remark concerns the current debate on phonon localisation due to disorder silica . In more detail, the discussion here concerns whether the propagation of acoustic excitations in glassy matter can take place beyond a spectral feature located at low frequencies known as the Boson peak. Its origin still is uncertain, but is known to be related to the hump that appears in the specific heat is plotted as . Studies in vitreous silica lb seems to indicate the existence of a crossover region well within the first pseudo-Brillouin zone that is for where the excitation linewidths equate their charateristic frequency and thus cease to propagate. Such a cross-over frequency (or wavevector) usually referred to as the Ioffe-Regel limit has been identified in some studies with that correposnding to the Boson peak. For the materials under discussion here we show in Fig.6 the shape of the low-frequency spectra for several values of momentum-transfers. Such a feature appears as a well defined peak centered at about 3 meV which shows no clear Q-dependence on its frequency or width. Its thermodynamic correlate is the T = 7 K hump in the specific heat reported in Ref.ld .
Here we address the issue just referred to by means of a comparison of the simulation data depicted in Fig.3 and the spectra showing the Boson peak displayed in Fig.6. Because of the single-crystalline nature of the simulation data, the frequencies and linewidths for the acoustic phonons cane be tracked down up to the Brillouin zone boundary. Data for the ODC at the lowest temperature ( 5 K) shows no indication of a crossover in teh Ioffe-Reggel sense and therefore, one would expect that longitudinal acoustic phonons propagate within the Brillouin zone. In contrast, data for T = 100 K do show a crossover for the ODC at about 0.4 Å-1. The inference that such a comparison allows us to make tells that thermal disorder seems a far more fundamental issue concerning the localization of acoustic waves than its static counterpart. The result, that went unnoticed in the current debate is however well known concerning the damping of acoustic phonons in cubic crystals kuleev , where it is kown that the phonon relaxation rate depends on the fifth power of the temperature.
In summary, the concurrent use of thermal conductivity measurements, light scattering experiments and molecular dynamics simulations on single crystalline models of the ODC and FOC solids has enabled us to establish the prominent role or molecular orientational disorder as the main source of acoustic phonon scattering in disordered matter. As an additional result, our study points towards the prominent role of thermal effects in the attenuation of acoustic phonons.
References
- (1) M. A. Ramos et al. Phys. Rev. Lett.78, 82 (1997); A. Criado et al. Phys.Rev.B 61, 8778 (2000); M. Jimenez-Ruiz et al. Phys.Rev.Lett.83, 2757 (1999), C. Cabrillo et al. Phys.Rev.B 64, 064206 (2001); H. E. Fischer et al. Phys.Rev.Lett. 82, 1193 (1999); M.A. Miller et al. Phys.Rev. B 57, R13977 (1998).
- (2) A. Matic et al. Phys. Rev. Lett. 93, 145502 (2004).
- (3) P.D. Wu et al. J. Low-Temp.Phys. 113, 123 (1998).
- (4) R.O. Pohl et al. Rev.Mod.Phys. 74, 991 (2002).
- (5) M. Kobas et al. Phys. Rev. B 71, 224206 (2005).
- (6) B. Rufflé et al. Phys. Rev. Lett. 90, 095502 (2003); O. Pilla et al. Phys. Rev. Lett. 85, 2136 (2000); F.J. Bermejo et al. Phys. Rev. Lett. 81, 3801 (1998).
- (7) B. Rufflé et al. Phys. Rev. Lett. 96, 045502 (2006).
- (8) A. Krivchikov et al. Phys. Rev. B (in press).
- (9) A. I. Krivchikov, B. Ya. Gorodilov, O. A. Korolyuk, V. G. Manzhelii, H. Conrad and W. Press, J.Low-Temp.Phys. 139, 693 (2005); A. I. Krivchikov, V. G. Manzhelii, O. A. Korolyuk, B. Ya. Gorodilov, O. O. Romantsova, Phys. Chem. Chem. Phys. 7, 728 (2005).
- (10) M.A. González et al. Phys.Rev. B 61, 6654 (2000);ibid Phys.Rev.E 61, 3884 (2000).
- (11) F.W. de Wette and A. Rahman, Phys. Rev. 176, 784 (1968).
- (12) C. Talón et al. Phys. Rev. B 58, 745 (1998).
- (13) I.G. Kuleev and I.I. Kuleev, Phys.Solid State (Fizika Tverdogo Tela), 47, 312 (2005).