Spontaneous ordering as an intrinsic effect at the mesoscopic scale: A vibrational insight in (Zn,Be)Se by Raman scattering and first-principles calculations
Abstract
The recent finding of a 1-bond2-phonon ‘percolation’-type behaviour in several random zincblende alloys, supporting an unsuspected 1-bond2-mode behaviour in the bond length distribution, renews interest for a discussion of CuPt-type spontaneous ordering (CPSO) as a purely intrinsic effect. We investigate this key issue from both experimental (Raman scattering) and theoretical (first-principles bond length and phonon calculations) sides, focusing on Zn1-xBexSe (). Its large contrast in cation-anion bond lengths should stimulate CPSO to some extent, and is at the origin of a uniquely well-resolved 1-bond2-phonon behaviour for the Be-Se species. Based on percolation, CPSO finds a previously missing natural explanation, at the mesosocopic scale. Also, the transfer of oscillator strength from the high- to the low-frequency Be-Se mode in the Raman spectra potentially emerges as a sensitive probe of CPSO in ZnBeSe. First-principles calculations indicate that the transfer is completed for the value of the long range order parameter of 0.5 in ZnBeSe2 (0.5), corresponding to a pure 1-bond1-mode behaviour. With further ordering the alloy is forced to re-adopt a non-rewarding 1-bond2-mode behaviour, due to the formation of ZnSe/BeSe micro-domains in the crystal. Therefore 0.5 appears as an intrinsic limit to CPSO in ZnBeSe2, and possibly in stoichiometric alloys in general.
pacs:
78.30.Fs, 63.50.+x, 63.20.-eI INTRODUCTION
The current believe so far is that in random A1-xBxC zincblende semiconductor alloys, where C denotes indifferently the cationic or the anionic species, the A-C and B-C bonds tend at any value to keep their natural lengths (L) as inherited from the parent compounds.1 This we refer to as the 1-bond1-mode (L) behaviour in the bond length distribution. Only a slight adaptation occurs when varies, due to the necessity to fit into the lattice, which, on the average, shrinks or dilates. With this, the contrast between the A-C and B-C bond lengths remains always smaller in the alloy than between the parent compounds (see, e.g., Fig. 2 in Ref. 1). In its impact on the lattice dynamics, the 1-bond1-mode (L) situation manifests itself as a typical 1-bond1-mode behaviour in the transverse optical (TO) Raman spectra, as accounted for by the well-known modified-random-element-isodisplacement (MREI) model of Chang and Mitra.2 This is based on the virtual crystal approximation that averages the alloy disorder locally, corresponding in fine to a description of the alloy at the macroscopic scale, i.e. in terms of an effective medium. Note that, usually, the larger the bond length (L), the smaller the bond force constant, and hence the lower the vibration frequency of the phonon mode (TO).
The 1-bond1-mode (L) picture is especially problematic with respect to the discussion of spontaneous ordering (SO) in alloys. First, it implies that at a given value the bond length does not depend on the local neighbourhood of the individual bonds. Accordingly no benefit, i.e. no minimization of the local strain energy due to the bond length mismatch, can be expected if a substitution of A by B be not purely random. Second, the mechanism of SO as usually observed in stoichiometric alloys (=0.5), referred to as ABC2 for simplicity hereafter, is counter-intuitive when starting from the 1-bond1-mode (L) description of the lattice relaxation in a random alloy. We recall that, most frequently, SO in ABC2 consists of the formation of a A0.5(1-η)B0.5(1+η)C/A0.5(1+η)B0.5(1-η)C quasi-superlattice along the and crystal directions,3 where , the long-range order parameter, measures the average deviation from equal representation of A and B species in the (111) substituting planes, as expected in a random alloy.3,4 This is currently referred to as CuPt-b type ordering. Here the consecutive (A,B) substituting planes have, in alternation, an excess and deficiency of A (or B). The two limiting values correspond to the random substitution (=0) and to the perfect CuPt-b ordering (=1). In other words, the SO generates a local segregation of the A and B species within a sequence of intercalated planes, i.e. it enforces the building up of regions which, locally, resemble the parent compounds. In the spirit of the 1-bond1-mode (L) description this should enlarge the overall contrast between the A-C and B-C bond lengths in the alloy, as discussed above, and thereby reduce the crystal stability.
In summary when starting from the traditional 1-bond1-mode (L) description of the lattice relaxation in a random mixed crystal at the macroscopic scale, not only would we fail to understand intuitively () how SO can be rewarding for the crystal at all, but also () why SO takes specifically the form of local segregation of the A and B species into alternate substituting planes, with interleaving planes of C atoms.
Certainly the whole of this has discouraged a discussion of the CuPt-b type SO (CPSO) in semiconductor alloys in terms of an intrinsic effect, i.e. the result of an optimal lattice relaxation in the bulk of the crystal with respect to minimization of the local strain energy as due to the contrast between the A-C and B-C bond lengths, and pushed towards a discussion more in terms of an extrinsic effect, i.e. in relation to the growth conditions at the surface.5
Actually the growth conditions play an important role. For a brief survey we focus on InGaP2 that has been extensively studied in the literature, both experimentally and theoretically (for a detailed review see Ref. 6). First it has been shown that the growth rate, the growth temperature, and also the III-V ratio do influence the degree of CuPt-b ordering, i.e. the value (see Ref. 3, and Refs. therein). Further, it was shown that substrate misorientation over a few degrees towards [111] may enforce massive ordering along one only of the two possible and directions, leading to a so-called single-variant CuPt-b type ordering.3,4 Besides, first-principles calculations performed by Zhang et al.7 indicate that, depending on the orientation of the surface phosphorus dimers during the growth process, the nature of ordering may change from the standard CuPt-b form to the much less frequent CuPt-a one, corresponding to the building up of a monolayer superlattice along the alternative and crystal directions, or even result in a triple-period ordering. Experimentally this was evidenced by Gomyo et al.8 The underlying mechanism is surfacial: the ordering basically results from (Ga,In)-site selectivity minimizing the subsurface strain induced by the top surface P-dimers during the growth process.7 This has lead to an idea to influence the ordering in depth of III-V alloys by using specific impurity atoms selected so as to stay on the top surface of the alloy during its deposition. In particular, at present much attention is awarded to the fact that such so-called surfactant atoms may stimulate or even block the natural trend of the alloy to develop the CPSO (see Ref. 9 and references therein).
One remarkable point about the CPSO is an apparent limit the nature has set to its magnitude. The highest observed value of is 0.5 (in InGaP2 see Fig. 2 in Ref. 10). We are not aware of any ABC2 alloy, where a higher degree of SO could ever be achieved.
Of course the degree of ordering can be freely chosen in a calculation. Zhang et al.10, in their sequence of (empirical potentials-based) lattice relaxations in large supercells, taking average over many different configurations for each value, deduced that the character of bond length distributions in both Ga-P and In-P species basically changes near 0.5. The authors note the closeness of this ‘anomaly’ to the experimentally achievable limit of ordering. However, they did not elaborate what exactly in their bond lengths distributions beyond 0.5 would make such configurations difficult to occur in reality. From this, we deduce that the limit of SO at 0.5 has to do with the lattice relaxation in the bulk of the crystal, as due to the contrast between the A-C and B-C bond lengths, and not only with the lattice relaxation at the surface of the alloy during its deposition, as conditioned by the growth parameters and/or surfactants.9 What emerges is that 0.5 should be discussed in terms of an intrinsic limit to CPSO in GaInP2. This appeals to rethink the whole scenario of CPSO in terms of a purely intrinsic effect, which has attracted little attention so far.
We emphasize that for doing so, one should look into more fine details of lattice relaxation in random alloys than those covered by the traditional, and crude, 1-bond1-mode (L) picture at the macroscopic scale, that fails to account for the CPSO as already discussed.
In the last few years we have shown that several A1-xBxC random alloys, e.g. (Zn,Be) chalcogenides and (Ga,In)-V systems (where V stands for As or P), exhibit in fact a 1-bond2-mode behaviour in the TO Raman spectra.11 The microscopic mechanism for the 1-bond2-mode (TO) Raman behaviour was pinpointed by first-principles/atomistic calculations to the difference in bond length (L) according to whether the bonds stay within the Zn/In-rich region or within the Be/Ga-rich one, that result from natural fluctuations in the alloy composition at the local scale12 This introduces a description of the lattice dynamics/relaxation in a semiconductor mixed crystal A1-xBxC at the mesoscopic scale, in terms of a composite made of the two finely interlaced A-rich and B-rich regions.
One key point is that, for a given bond species, the bonds appear to be longer (shorter) within the host region that refers to the parent material with the smaller (larger) lattice constant. For example, the Be-chalcogen bonds are longer in Be-rich than in Zn-rich regions of (Zn,Be) chalcogenides, and the Ga-based bonds are shorter in In-rich than in Ga-rich regions of (Ga,In)-based systems. More generally, if B-C refers to the shortest bond length in A1-xBxC alloys, we distinguish for each of the A-C and B-C bond species between the ‘short’ bonds from the A-rich region, that vibrate at a higher frequency, and the ‘long’ bonds from the B-rich region, that vibrate at a lower frequency. The phonon modes (TO) and bond lengths (L) are labelled as (TO,L), where the subscript refers to the bond species, and superscript indicates the A-rich or B-rich host region. A typical scattering of lengths, within a given bond species (A-C) or (B-C), depending on their affiliation to A-rich or B-rich host region, is of the order of the percent (1%), but amongst the short B-C bond species this scattering is larger, thereby corresponding to a clear separation between the phonon lines . For the long A-C bond species, effectively vanishes. The full description of the 1-bond2-mode (TO) behaviour, including the dependencies of the frequency and the strength of each individual mode on the alloy composition, was finalized into a so-called ‘percolation’ model. Details are reported elsewhere.11 We reproduce in Fig. 1 the resulting scheme of phonon modes for the (Zn,Be)-chalcogenides in the random case, of present interest here, to help us in the discussion. The 1-bond1-mode (TO) MREI-like behaviour is also indicated there by dotted lines. The real curve for Zn1-xBexSe is displayed e.g. in Fig. 1 of Ref. 11.

Clearly the 1-bond2-mode (TO,L) description of the lattice dynamics/relaxation in random alloys provides a more attractive area than the standard 1-bond1-mode (TO,L) alternative for the intuitive discussion of the above key issues ()–() about the SO.
The preliminary results that we have obtained so far with GaInP2 are the following. First we could explain the puzzling evolution of the Raman/infrared spectra with increasing order in terms of reinforcement of the low-frequency TO mode at the cost of the high-frequency TO mode. Therefore, at least in principle, the strength ratio between the low- and high-frequency Ga-P modes in their 1-bond2-mode description can be used as a probe of the CPSO. Basically the larger the R value, the higher the degree of CPSO. Transposed to bond lengths this indicates that the SO would tend to generate those local atom arrangements in the crystal that favour the long Ga-P bonds from the Ga-rich region to the detriment of the short Ga-P bonds from the In-rich region. This way the contrast in bond lengths between the short Ga-P bonds and the long In-P bonds is minimized, resulting in higher crystal stability. Note that we discuss SO in GaInP2 as a purely intrinsic effect, which relies entirely on the contrast between the Ga-P and In-P bond lengths. Further, we could provide a preliminary explanation as to why CPSO is apparently limited to 0.5 in GaInP2.13 Basically the reason is that the short Ga-P bonds from the In-rich region have totally disappeared at this limit, as can be inferred from total disappearance of the TO mode in the Raman/Infrared spectra,14,15 which suppresses the driving force for further ordering.
However, many key questions remain open. The discussion above offers some insight into the issue (), that is, how SO can be rewarding for a crystal. Yet the issue () remains unaddressed, because no link was established between the Raman spectra and underlying details of the crystal structure depending on . In particular, the reason as why the CuPt type atom arrangement would lead to disappearance of the shortest Ga-P bonds was not clarified so far. Besides, a novel question emerges: () if CPSO is actually hindered beyond 0.5, as we proposed for GaInP2, what is the forbidding mechanism behind at the microscopic scale?
In the present work we address the above important issues with the aim to derive a consistent picture for the CPSO that incorporates the prerequisite of a 1-bond2-mode (TO,L) description of the lattice relaxation at =0 for both the Ga-P and In-P species. Ideally the key notion of an intrinsic limit to CPSO, as earlier discussed for the reference GaInP2 system, should come out. This we investigate via a thorough study of the dependence of the 1-bond2-mode (TO,L) behaviour versus ordering in the Zn1-xBexSe system, from both the experimental and theoretical sides.
An immediate motivation for focusing on this system is that our earlier Raman data seem to indicate CPSO to some extent in our set of Zn1-xBexSe epilayers. For example, at the stoichiometry (=0.5) the strength ratio between the TO (at low frequency) and the TO (at high frequency) modes should be close to 1 in case of random Be substitution for Zn in (Zn,Be) chalcogenides (refer to Fig. 1). While this is true for ZnBeTe2 (see Fig. 3 of Ref. 16), is larger than expected in ZnBeSe2 (see Fig. 4 of Ref. 7). In fact, in Zn1-xBexSe epilayers 1 at 0.4 (see Fig. 2 of Ref. 11) and not at 0.5. More generally, the value is always smaller in Zn1-xBexSe than in Zn1-xBexTe, at any Be content . For an insight at large values, where the Be-based signal shows up clearly, compare the top curves from Fig. 2(c) in Ref. 16 and from Fig. 4(c) in Ref. 11. The apparent -anomaly in Zn1-xBexSe has first been tentatively attributed to larger damping or smaller Faust-Henry coefficient of the Be-Se vibrations in the Zn-rich region, for an unspecified intrinsic reason (see Ref. 11, and Refs. therein). More consistently, another possible explanation is that our Zn1-xBexSe epilayers exhibit CPSO to some extent, by an analogy with InGaP2 (refer above). In this case the apparent -anomaly would not be intrinsic. In particular, it should depend on the growth conditions to some extent. We investigate this issue in the first, experimental, part of this work by using an alternative set of Zn1-xBexSe alloys, grown as single crystals, with the underlying idea that these might be less prone to SO than the epilayers. Indeed while re-examining the Raman/infrared data available for GaInP2 in the literature, we noted that only those samples grown as epitaxial layers do significantly exhibit the CPSO. The samples grown as single crystals seem to be random (refer to the inset of Fig. 2 in Ref. 13). Apparently this is not fortuitous, as the same trend was also evidenced with ZnSexTe1-x, over the whole composition range.17
We mention that the amount of SO in our specific Zn1-xBexSe epilayers, if any, is expected to be low. Indeed we have detected earlier a singularity in the -dependence of the frequency of the TO mode, that refers to the Be-rich region, when the latter region turns from a dispersion of bounded clusters with fixed internal geometry (small -values, stable frequency) into a pseudocontinuum with smoothly -dependent internal geometry (large -values, smoothly -dependent frequency). The transition occurs at the so-called Be-Se bond percolation threshold, denoted . Remarkably the singularity was observed at 0.19 (refer to Fig. 1 in Ref. 11, for example), i.e. the theoretical value if random B substitution to A is assumed on the fcc (A,B)-sublattice of zincblende A1-xBxC alloys [18]. On this basis our Zn1-xBexSe epilayers were previously attested as quasi-random systems, hence their values should remain close to zero.
More generally ZnBeSe is a choice system to address the key questions () to () above. First it exhibits a contrast in the bond lengths (9%) comparable to that in GaInP (7%). Accordingly if CuPt ordering has an intrinsic origin and stems from the latter contrast, as we expect, this should stimulate CPSO to some extent, depending on the growth conditions. Second, the contrast in the bond force constants is extremely large in ZnBeSe, essentially due to the unique covalent character of the Be-bonding among II-VI compounds.19,20 A consequence is that the Zn- and Be-based bonds vibrate in well-separated frequency domains, which allows, in particular, a direct insight into the Be-based spectral range, where the 1-bond2-mode (TO) behaviour is especially pronounced. An uniquely good resolution of split Be-Se lines (50 cm-1) allows reliable insight into the relative strength of the two Be-Se modes, that seems to be a relevant probe of the CPSO by analogy with GaInP2.13 In fact ZnBeSe seems to be a more favourable test case than InGaP2, in which the Ga-P and In-P spectral ranges do overlap strongly, and the splitting between the two Ga-P TO modes is two times smaller (20 cm-1).
We are not aware of any vibrational study of the CPSO within the classes of II-VI or I-VII alloys. As for III-V’s, little work has been dedicated to the dependence of lattice dynamics versus ordering in systems other than GaInP2, in spite of the fact that the tendency for CPSO is a common feature in this class of alloys. Based on Raman spectroscopy data, an evidence for CPSO has been reported in GaInAs2 grown lattice-matched to (001) InP substrates,21,22 and also in GaAs1-xNx ( 0-5%).23 We note that in all cases the vibrational insight into the CPSO remained but qualitative.
More precisely we note that the previous attempts to clarify the influence of ordering on the Raman spectra of the above systems were mostly performed in the longitudinal optical (LO) symmetry. Here, the most reliable indicator of SO seems to be the emergence of the folded longitudinal acoustical (FLA) phonon, which otherwise does not show up in the Raman spectrum of the random alloy.22 Unfortunately there does not seem to exist any straightforward correlation between the strength of this mode and the degree of ordering. By way of example, in the case of GaInP2 an unambiguous emergence of the FLA mode at 205 cm-1 requires a minimum amount of ordering of 0.3, and the strength of the mode remains approximately constant at larger values up to 0.5 (refer to Fig. 5 in p. 399 of Ref. 6, and to Fig. 4 in Ref. 3). As far as pure optical modes are concerned, we have shown elsewhere in extensive detail that the TO symmetry is much more sensitive than the LO alternative to detect possible changes in either the frequency or the oscillator strength of the individual oscillators in the crystal.11 With respect to earlier reported measurements in the TO symmetry, we are only aware of important contributions by Mestres et al.24 and Cheong et al.14 dedicated to GaInP2, but the discussion remained qualitative only. Taken together, this reinforces the motivation for the present detailed investigation of the lattice dynamics of Zn1-xBexSe in the TO symmetry.
The manuscript is organized as follows. In Sec. II we give the experimental details concerning the preparation of the samples and the recording of the Raman spectra, and we outline the first-principles methods for the calculations of the bond length and phonon properties. As an introduction to Sec. III we propose a consistent intrinsic mechanism for the CPSO, based on our 1-bond2-mode (TO,L) description of the lattice dynamics/relaxation in random mixed crystals at the mesoscopic scale. According to this, CPSO should show up via a systematic transfer of oscillator strength between the two modes that refer to the same bond species in the Raman spectra. By comparing the well-resolved 1-bond2-mode (TO) Be-Se Raman responses from Zn1-xBexSe single crystals (0.100.53) and epitaxial layers (00.92), such a transfer is actually evidenced for the epilayer set. This corresponds to a slight over-representation of the ‘long’ Be-Se bonds from the Be-rich region, to the detriment of the ‘short’ Be-Se bonds from the Zn-rich region, as should be expected in the case of moderate CPSO. Quantitative information is derived from contour modeling of the TO Raman lineshapes by using our phenomenological ‘percolation’ model. In Sec. IV we perform first-principles calculations with a series of fully-relaxed 32-atom Zn8Be8Se16 supercells for complementary insight at the microscopic scale. First this is to verify that CuPt type ordering actually generates the interplay between the two Be-Se Raman modes as observed with the epilayer set. The calculations are pushed further to provide insight into the critical value corresponding to the full disappearance of the ‘short’ (‘long’) Be-Se (Zn-Se) species in the representative ZnBeSe2 alloy. At last, we investigate the nature of the threshold mechanism, if any, that should hinder SO beyond this limit, as earlier proposed for GaInP2.13 Concluding remarks are given in Sec. V.
II EXPERIMENT AND FIRST-PRINCIPLES METHOD
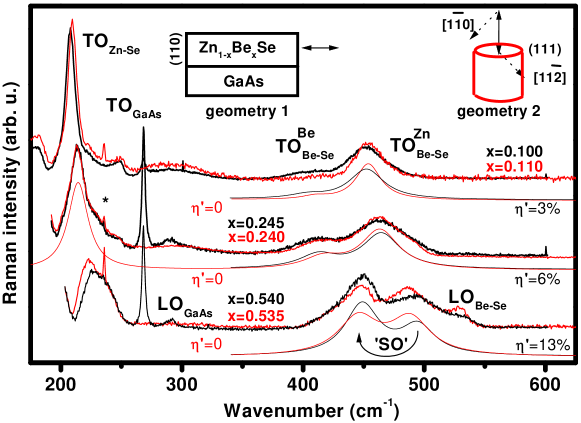
We analyzed two sets of Zn1-xBexSe samples, i.e. 1 m-thick layers (00.92) grown by molecular beam epitaxy onto a (001) GaAs substrate using several ZnSe monolayers as an intermediate buffer, and single crystals (0.10, 0.25, 0.50) grown as cylinders (8 mm in diameter, 20 mm in length) by using the high-pressure Bridgman method. The single crystals were oriented and cut perpendicular to their growth direction, that was checked to be the [111] crystal axis by high-resolution X-ray diffraction, and then mechanically polished to optical quality. For each sample the value was determined with a typical accuracy of 0.5% from the lattice constant measured by X-ray diffraction, assuming a linear dependence (Vegard’s law). The epilayers are lattice-matched with the GaAs substrate at 0.03. Combined X-ray measurements of the in-plane and out-of-plane lattice constants revealed a substrate-induced residual biaxial tensile strain in the layers up to 0.25, above which limit the layers are fully relaxed.25 We have checked earlier that the residual strain in the epilayers is homogeneous, at least from the vibrational side (refer to Fig. 4 in Ref. 26). Basically there is no such variation of the residual strain in the epilayer from the ZnBeSe/GaAs interface to the top surface that could cause any detectable distortion of either Zn-Se or Be-Se phonon lineshapes, apart from slight overall red shifts. Besides, micro-Raman spectra recorded along the 1‰ (100) slope of a bevelled edge realized by chemical etching with the Zn0.38Be0.62Se/GaAs system have shown that the intermediary ZnSe buffer layer has initiated the growth of a thin ZnSe-like amorphous layer prior the proper deposition of the alloy at the nominal composition.27 We deduce that the growth of the alloy is free from the substrate influence at large values. We retain that there are two well-separated values corresponding to critical behaviours with respect to the substrate-induced tensile strain in the epilayers, i.e., 0.25 and 0.6.
Raman spectra were recorded at room temperature with the Dilor microprobe setup by using the 514.5 nm Ar+ excitation. Pure TO spectra from the epilayers were obtained in backscattering on the (110) edge face with unpolarized excitation/detection (geometry 1, see Fig. 2)28 By using the (100) microscope objective the laser spot on the sample surface could be reduced down to 1 m, but the microprobe generally overlaps onto the GaAs side, which activates the parasitic (268 cm-1, allowed) and (292 cm-1, theoretically forbidden) modes. For the single crystals we used (111) backscattering, corresponding to both TO and LO modes allowed. Specific TO access was achieved by taking crossed polarizations for the incident and scattered beams, and turning the sample around the [111] axis until the polarizations got parallel to the and crystal axis, respectively (geometry 2, see Fig. 2).28
The first-principles calculations of bond lengths and phonons were performed for the stoichiometric composition using a series of Zn8Be8Se16 supercells constructed so as to represent different values of the order parameter, =0 through 1, by using the computer code Siesta.29,30 The details concerning the building up of the supercells are reported in Sec. IV. These are fully relaxed, with respect to crystal cell parameters and internal atomic positions. The norm-conserving pseudopotentials and the basis set are just those already optimized for our earlier calculations with the ordered Zn4-nBenSe4, =1,3 (=0.25, 0.75) supercells and our prototype disordered Zn26Be6Se32 supercell at the Be-Se bond percolation threshold. Extensive information is given in Ref. 12.
III RAMAN SCATTERING AND ‘PERCOLATION’ MODEL: AN INSIGHT AT THE MESOSCOPIC SCALE
As a basis for the discussion of the experimental data in Sec. III-B, we outline in Sec. III-A a more accomplished version of the mechanism earlier introduced to explain the puzzling evolution of the 1-bond2-mode (TO) Ga-P behaviour in the course of varying the order parameter in the reference GaInP2 system.13 In particular this version fills the gap regarding question () raised in Sec. I. A priori the same picture should apply to the similar 1-bond2-mode (TO,L) Be-Se behaviour in Zn1-xBexSe, by analogy.
III.1 CPSO: An intrinsic mechanism at the mesoscopic scale
Clearly the existence of two different bond lengths (L) per species in a random A1-xBxC alloys (=0), supported by the 1-bond2-mode (TO) ‘percolation’ type behaviour of the lattice dynamics, is not optimum regarding the stability of the crystal structure. A minimization of the local strain energy, hence higher crystal stability, can be achieved simply by reducing the diversity in bond length in the sense of just selecting the one single bond length per species that minimizes the contrast between the A-C (long) and B-C (short) bond lengths, i.e. the ‘shorter’ A-C bonds from the A-rich region and the ‘longer’ B-C bonds from the B-rich region. This explains how SO can actually be rewarding for the crystal – recall issue () in Sec. I. Ultimately only the latter bond species should remain in the crystal. Transposed to phonon spectra, SO would correspond to reinforcement of the TO and TO modes at the cost of the TO and TO modes, respectively, to full disappearance of the latter (refer to the antagonist curved arrows in Fig. 1 in the case of ZnBeSe).
An interesting question – in reference to issue () of Sec. I – is which local atom arrangements would best promote this tendency? Apparently those leading to local phase separation, because this is the sine qua non condition to confine B-C and A-C bonds within B-rich and A-rich environments, respectively. When starting from a situation where the A and B atom species are represented in each substituting plane in proportion to the alloy composition (=0), certainly the most straightforward way to achieve this would be massive ZnBe exchange between adjacent (111) substituting planes so as to enforce their alternate A- and B-enrichment throughout the crystal. In the representative ABC2 system this eventually results in long range order under the form of a A0.5(1+η)B0.5(1-η)C/A0.5(1-η)B0.5(1+η)C superlattice along the [111] crystal direction.
As the mechanism that we propose for the CPSO in A1-xBxC mixed crystals entirely relies upon the contrast in bond lengths between the A-C and B-C species, the CPSO should not be observed when the latter contrast vanishes. As a matter of fact, it is well-known that Al1-xGaxAs, which is the ultimate system with this respect (the difference between the Al-As and Ga-As bond lengths is smaller than 1.5‰), never develops the CPSO.6
Thus, when starting from the 1-bond2-mode (TO,L) description of random A1-xBxC alloys (=0), an intrinsic driving force behind SO is identified, in response to question (), and it becomes clear why the mechanism of SO consists of local segregation of the A and B species within alternate substituting planes, that is the answer to question (). Below we discuss on this novel basis the apparent -anomaly earlier detected in the Be-Se TO Raman response of the Zn1-xBexSe epilayers (refer to Sec. I).
III.2 Experimental results and discussion (Zn1-xBexSe, )
We superimpose in Fig. 2 the raw TO Raman spectra from the single crystals (red) and the epilayers (black) with values similar within 1%, after normalization to the strength of the 1-bond1-mode (TO) MREI-like TOZn-Se signal at 215 cm-1, taken as an internal reference. The Be-Se bonds vibrate at higher frequency, near 450 cm-1, due to their stiffer/shorter character and their smaller reduced mass. Both the TO mode, at 425 cm-1, and the TO mode, at 475 cm-1, show up clearly. We recall that these refer to the ‘long’ Be-Se bonds from the Be-rich region and the ‘short’ Be-Se ones from the Zn-rich region, respectively. We note the parasitical activation of the theoretically forbidden LOBe-Se mode around 535 cm-1 at 0.5. This is attributed to partial breaking of the selection rules, the result of large alloy disorder close to the stoichiometry. All the TO modes become blue-shifted when the Be content increases. This is a compression effect in response to an overall shrinking of the lattice. We note that the linewidths are similar for the two sets of samples, both in the Zn-Se and Be-Se ranges, which indicates similar crystal qualities.
Moreover, it is remarkable that the Zn-Se lineshapes from the two sets of samples do match almost perfectly after the above mentioned normalization, provided a slight overall translation along either the ordinate or the abscissa axis is applied. Accordingly any difference between the two sets of Be-Se Raman responses that can not be suppressed after such overall translation is beyond the experimental error. As a matter of fact the agreement is not as good in the Be-Se spectral range. The strength ratio between the TO and the TO modes is systematically larger for the epilayers than for the single crystals, at any value, testifying thereby an internal distortion of the Be-Se signal. This suffices to rule out our earlier view that the -anomaly with the ZnBeSe2 epilayer is intrinsic (refer to Sec. I).
A detailed quantitative insight therein is obtained via contour modeling of the TO spectra by using a three-oscillator version [Zn-Se, (Be-Se)Be, (Be-Se)Zn] of our phenomenological ‘percolation’ model. The Zn-Se and Be-Se input parameters are given elsewhere, together with the technical details of the model.11 Differently from our previous approaches we do not consider any renormalization of the BeSe Faust-Henry coefficient in the Zn-rich region. Optimal contour modelling of the Raman lineshapes was obtained by taking the same phonon damping for the two Be-Se modes. Our principal adjustable parameter here is how the available Be-Se oscillator strength shares between the two Be-Se modes. Otherwise slight frequency adjustment, no larger than 3 cm-1 (refer in particular to the low frequency Be-Se mode at 0.10, and to the high frequency Be-Se mode at 0.50), is applied when needed to achieve optimum data modelling. However, no systematic trend, that is worth to discuss, could be evidenced with this respect. We stress that optimization of the curve fitting procedure in the Zn-Se spectral range does not generate any internal distortion of the Raman response in the Be-Se spectral range, and vice versa. The resulting theoretical curves, shifted downwards from the data for better clarity, while using the same colour code, are shown in Fig. 2, with special emphasis upon the sensitive Be-Se range.
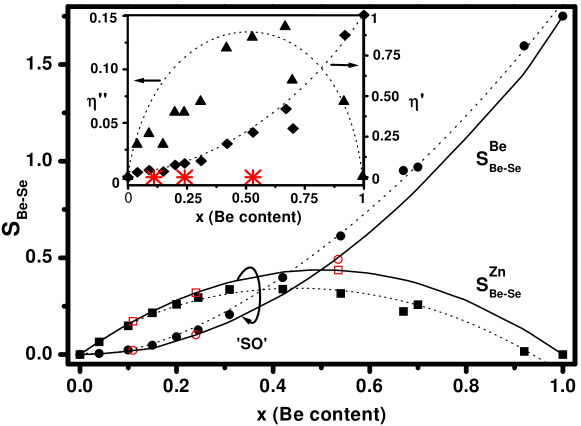
The (circles) and (squares) oscillator strengths (with the conventional notation) derived from contour modelling of the TO Raman spectra for the whole set of epilayers (black, solid symbols) and the single crystals (red, open symbols) are displayed in the main panel of Fig. 3. Dotted lines act as guide for eye. The theoretical amounts in case of random Be?Zn substitution, i.e. and , where is the oscillator strength in pure BeSe (refer to Fig. 1), are shown for reference purpose (thin lines). While in the single crystals the overall Be-Se oscillator strength at the alloy composition divides consistently with the above expressions, as it can be expected for random alloys, in the epilayers the amount awarded to the TO (TO) mode is systematically larger (smaller) than expected. This is consistent with CPSO, i.e. over (sub) representation of the ‘long’ (‘short’) Be-Se bonds from the Be-rich (Zn-rich) region as schematically indicated by the curved arrow at the bottom of Fig. 2 (refer also to the upper curved arrow in Fig. 1), with concomitant impact on the local strain energy as discussed above. The reverse trend would enlarge the overall contrast between the Zn-Se and Be-Se bond lengths in the alloy, and is thereby forbidden by SO in principle.
Interestingly the Zn-Se signal from the ZnBeSe2 epilayer (refer to the spectrum in black at the bottom of Fig. 2), which reveals the most spectacular effect in the Be-Se range, is slightly blue-shifted with respect to the single-crystal reference. This is exactly the trend expected in case of CPSO, i.e. the result of reinforcement of the ‘short’ Zn-Se species, vibrating at high frequency, to the detriment of the ‘long’ species, vibrating at low frequency (refer to the lower curved arrow in Fig. 1). Now, care must be taken that the discrete Zn-Se Raman signal is corrupted by a parasitic Fano interference with a disorder-activated acoustical continuum at large values, as evidenced by the characteristic antiresonance at 200 cm-1 (Ref. 11). This does not allow us to be fully conclusive. Reliable insight into the actual dependence of the vibrational properties in the Zn-Se spectral range versus ordering is obtained by theoretical means in Sec. IV.
We denote as and the fraction of ‘short’ Be-Se bonds that have turned ‘long’ due to SO, and their corresponding fraction with respect to the total number of bonds in the crystal, respectively. is given by the relative decrease of with respect to the random case , i.e. , where the additional superscript ‘r’ refers to the random case. follows directly. In practice is a measure of the transfer of Be-Se oscillator strength from the higher frequency mode to the lower frequency one, as a deviation with respect to the nominal partition of Be-Se oscillator strength in the random case (refer to Fig. 1). The (diamonds) and (triangles) values obtained with the epilayers are shown in the inset of Fig. 3. The vs. curve corresponds to a smooth parabolic-like divergence, which indicates that the larger , the more easily the ‘short’ Be-Se bonds convert into the ‘long’ ones. By comparison, for the single crystals, at any value (refer to the red stars in the inset of Fig. 3). From the vs. curve, less than 15% of the bonds would be concerned with CPSO in the epilayers. Remarkably, CPSO would be activated from the dilute limits. It gets maximum at 0.5 (0.15). At this limit the Be-Se and Zn-Se bonds are equally represented in case of random Be substitution to Zn, as are the ‘short’ and ‘long’ variants for each bond species, thus creating a situation where four different bond lengths coexist in the alloy with identical populations. This results in a maximum local strain energy in the crystal, hence making more appealing an option to reduce the strain through the development of SO.
It is important to note that the (, ) vs. curves do not exhibit any singularity around the critical values of 0.25 and 0.6 (refer to Sec. II). This indicates that these curves should not be discussed in relation to the substrate-induced residual tensile strain in the epilayers. This legitimates a posteriori our above discussion of the observed transfer of Be-Se oscillator strength in terms of an intrinsic process, i.e. along the broad lines developed at the beginning of this section (refer to subsection A).
The possibility of the CPSO in the Zn1-xBexSe epilayers gets additional support from the bowing of the optical bandgap () observed for our two sample sets, and reported in the literature. Indeed it is well known that the CPSO reduces .6 As a matter of fact, the existing data indicate that the free exciton recombination line is blue-shifted at the constant rate of 24.10 meV per %Be throughout the sequence of our single crystals (=0.4, =40 K), and at the smaller rate of 23.00 meV per %Be with our epilayers (=0.6, =10 K).32 Actually this is consistent with our view that the epilayers exhibit the CPSO to some extent, as inferred from the Raman data. Incidentally the extra bowing of the optical bandgap in the case of the epilayers can not be attributed to the residual tensile strain due to the lattice mismatch at the ZnBeSe/GaAs interface. Indeed our epilayers are fully relaxed above 0.25 (refer to Sec. II), and Tournié et al.32 did not detect any singularity in the dependence of the optical bandgap on around this critical alloy composition. Note that from 10 K to 40 K the excitonic line of our ZnSe and Zn0.59Be0.41Se epilayers are red-shifted by 50 meV33 and 35 meV (see Fig. 21, p. 96 in Ref. 25), respectively, so that at 40 K the epilayer rate is renormalized to 23.35 meV per %Be, i.e. closer to the rate found for the single crystals. Actually, the difference is small. By comparison, the rate for perfectly-ordered Zn1-xBexSe is 11.60 meV per %Be (=0.5, =0 K), as determined from recent first-principles calculations performed by Tsai et al. with fully relaxed supercells.34 If we focus on ZnBeSe2, the -difference between our single crystal and our epilayer would be 50 meV, representing only 8% of the total -reduction from random (our single crystal) to perfectly-ordered ZnBeSe2. When brought back to the theoretical vs. curve now available for the reference InGaP2 system,10 this is just beyond the -fluctuation at 0, corresponding to 0.1. While such value is generally consistent with a small amount of CPSO in the epilayers (=0.15, see above), as expected (refer to Sec. I), we must admit that the observed trend in the bandgap can not yet serve as evidence for ordering by itself. Indeed in Zn1-xBexSe, where the ordering is by far less pronounced than in Ga1-xInxP, the lowering of the optical bandgap, especially as small as that reported here, can be attributed to many reasons besides the SO.
Certainly, the technique of choice to detect the CPSO would be diffraction of electrons. The CPSO would manifest itself via the emergence of additional features in the electron diffraction pattern, corresponding to an additional periodicity due to the alternation of Ga-rich and In-rich monolayers along the [111] direction, on top of the basic periodicity from the lattice. However, given the experience concerning GaInP2, it seems improbable that CPSO could be revealed by electron diffraction for values lower than 0.2, as is apparently the present case.
More generally, 0.2 seems to be the limit for proper detection of the CPSO by any of the traditional experimental means. A possible alternative to detect the CPSO below this limit is our suggestion to measure a deviation in the ratio of strength between the two TO Raman lines that refer to the same bond species, with respect to the nominal ratio for random alloys (as derived from the fractions given within square brackets in Fig. 1). In particular at the stoichiometry, where the CPSO has just been argued to be most likely to occur, this must be a quite sensitive method because the two modes at =0 are expected to show up with similar intensities, so that any fluctuation in the above ratio should be easily detectable. Basically there is no intrinsic limit of detection here. We recall that the puzzling interplay between the strengths of the two Ga-P Raman modes (TO) of the reference GaInP2 alloy when ordering increases was successfully explained on this very basis recently.13 This method seems to be sensitive in the dilute limit also. Indeed we have identified earlier in N-dilute InGaAsN such interplay between those two Ga-N modes that come from the N-rich and the (Ga,In)-rich regions,35 apparently the result of CuPt type ordering.21
We admit as an intermediate summary that the CPSO in our ZnBeSe epilayers, as inferred from the Raman data, could not be so far independently confirmed by other experimental means, due to a presumably too low degree of ordering which falls below the detection threshold. However, our Raman approach is validated by an analogy with GaInP2. Independent support comes from the theoretical side, in the form of first-principles phonon/bond length calculations discussed below.
IV FIRST-PRINCIPLES CALCULATIONS (ZnBeSe2): AN INSIGHT AT THE MICROSCOPIC SCALE
Here we address the issue () introduced in Sec. I, about the nature of the microscopic mechanism that should hinder CPSO in ABC2 alloys beyond 0.5. For direct insight into this key issue, we performed first-principles calculations of the dependence of the bond length and phonon properties in ZnBeSe2 on the degree of ordering, taken from the random limit (=0) up to the formation of the CuPt-type superstructure (=1).
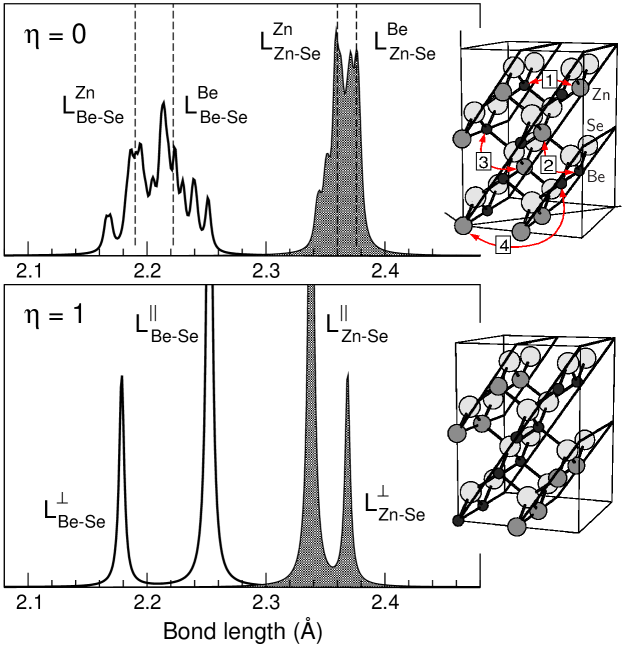
We used Zn8Be8Se16 32-atom supercells, spanned by the vectors , and in units of the lattice constant of (cubic) unit cell of the zincblende structure. Se atoms retain the anion positions, whereas cation sites are occupied by Zn and Be in such a way as to achieve a desired value of . The =0 supercell (shown in the top panel of Fig. 4) assures equal distribution of Zn and Be over (111) cationic planes (in the original cubic zincblende setting), irrespectively of a possible orientation of the (111) plane family. The supercells corresponding to =0.25, 0.50, 0.75 and 1.00 (for the latter, refer to the bottom panel of Fig. 4) are then constructed by gradually interchanging one (Be,Zn) pair after another, between consecutive cationic planes. The successive swaps are labelled as 1 to 4 in the starting supercell shown at the top of Fig. 4. A deviation of from zero arbitrarily fixes a family of (111) planes, as is also shown in the supercell drawings. The construction of supercell for a given value is an otherwise ambiguous procedure. A full statistical analysis over all possible supercell choices compatible with a given value would be too computationally demanding. Our aim here is to offer representative supercells for different values, and to discuss the trends in the distribution of bond length and phonon frequencies, as the pattern of cation-anion connectivity varies with .
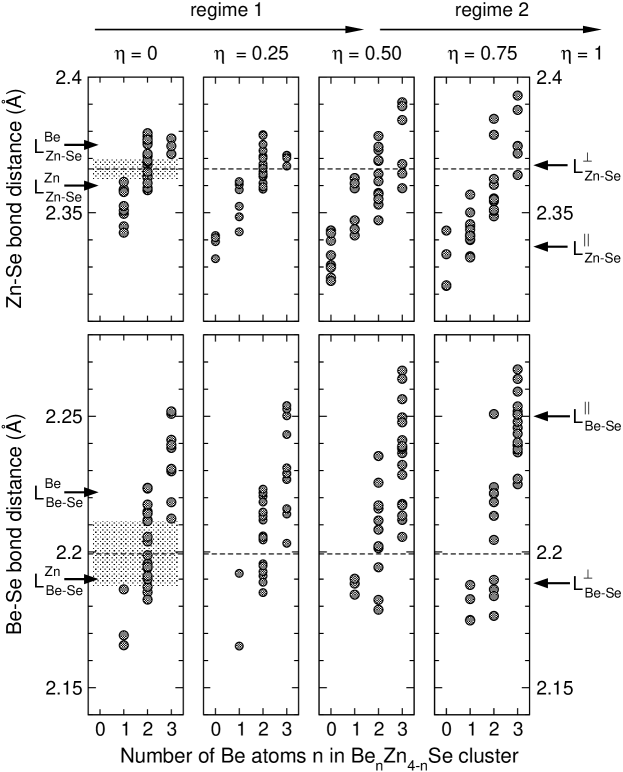
For each supercell chosen, we allow a full unconstrained optimization of structure (lattice constants and internal parameters) and obtain a certain scattering of (64 in total) bond lengths, which are shown (with artificially introduced broadening) in the body of Fig. 4, for the extreme cases =0 (top panel) and =1 (bottom panel). The perfectly CuPt-ordered case =1 is especially simple (see below). The distribution of bond lengths for =0 and other values is more obscure and shown in Fig. 5, for the sake of more detailed analysis, split into several groups, according to the number (=0-4) of Be atoms in the Se-centred Zn4-nBen host tetrahedron clusters.
With the structure fully optimized for each supercell, we calculate the spectrum of phonon frequencies of the zone-centre of the supercell, by the frozen phonon technique. As we are particularly interested in comparison with the Raman spectra which probe the zone-centre phonons of the underlying primitive cell, we recover the density of states of transversal phonons (TO-DOS) by projecting each vibration mode in the supercell onto the uniform translation of the primitive zincblende cell. In doing this, we follow an approach earlier used in Ref. 11, specifically Eq. (4) therein. The resulting TO-DOS curves for the different values are shown in Fig. 6.
IV.1 Phonon / bond length situation in the random (=0) and CuPt ordered (=1) crystals
First we discuss the phonon/bond length behaviours at the two extreme values, for reference purpose.
At =1 ZnBeSe2 consists of a [111]-oriented ZnSe/BeSe monolayer superlattice (refer to the supercell at the bottom of Fig. 4). Lattice-matching at the interface is achieved via in-plane hydrostatic tension (compression) and out-of-plane compression (tension) of the BeSe (ZnSe) layer. Accordingly the bond lengths, on the average well separated into short Be-Se and long Zn-Se bond species, do further split into three identical in-(111)-plane ones (longer than average for Be-Se, shorter than average for Zn-Se) and a single out-of-(111)-plane one. Our notation is
(refer to the bottom panel of Fig. 4, and also to the right side of Fig. 5), where the subscript refers to the bond species, and superscripts and represent in-plane and out-of-plane bonds, respectively. The TO-DOS features in Fig. 6 are correspondingly labelled, just replacing L by TO.
Now we turn to =0. Here the TO-DOS (top curve of Fig. 6) exhibits, within each of the Zn-Se (270 cm-1) and Be-Se (525 cm-1) spectral ranges, two distinct phonon modes of similar strengths, as could be ideally expected from the ‘percolation’ picture (refer to the relative strengths of the individual modes, as indicated within square brackets in Fig. 1). For unambiguous insight in the Zn-Se spectral range, refer to the discussion of Fig. 7 (left panel) below. Therefore for labelling the modes we retain the earlier introduced terminology of the percolation picture, i.e. TO. Similar labelling, with TO replaced by L, is used to mark the corresponding dominant lines in the Be-Se and Zn-Se bond length distributions (refer to the top panel of Fig. 4, and also to the left side of Fig. 5). Incidentally, the present calculations provide the first evidence for 1-bond2-mode (TO) behaviour at the stoichiometry in Zn1-xBexSe, in both the Zn-VI and Be-VI spectral ranges.
Let us compare briefly the obtained TO-DOS curve at =0 with the corresponding Raman data (refer to the spectra at the bottom of Fig. 2), to check the validity of our first-principles calculations. We note that the calculated and experimental Be-Se phonon splittings are similar, i.e. of 45 cm-1, even though the TO-DOS curve is globally blue-shifted by about 50 cm-1 with respect to the Raman spectra, an effect of slightly too compressed lattice, due to a well-known overbinding of the local density approximation. The same overall blue-shift was observed in our earlier study at the Be-Se bond percolation threshold, 19% of Be.12 Further on, the corresponding difference in bond length, i.e. 1.35% (refer to the dotted lines in the top panel of Fig. 4), is similar to that earlier estimated at the latter limit.12 This is consistent with quasi-invariance of the Be-Se phonon splitting under change of the alloy composition, as can be inferred from the Raman data (refer to Fig. 1). On the Zn-Se side the calculated difference in bond length reduces to (see Fig. 4, top panel), with concomitant impact on the phonon splitting, estimated as 10 cm-1 (see Fig. 7, left panel, discussed below). No direct comparison with the experimental ZnBeSe2 data is possible here, because the Zn-Se Raman signal is strongly distorted by a parasitic Fano-interference, as already mentioned. One can turn to the Zn-Te Raman response from the similar Zn1-xBexTe alloy (the Be-VI phonon splitting at the stoichiometry is 25 cm-1 here, see Fig. 1 in Ref. 16). A direct insight at the stoichiometry is hindered because the Zn-Te signal is too weak to be detected,36 but we argued above that the estimate at the Be-Te bond percolation threshold could serve as a substitute. The observed splitting of 8 cm-1 (Ref. 36) is in reasonable agreement with the present calculation estimate for the Zn-Se species.
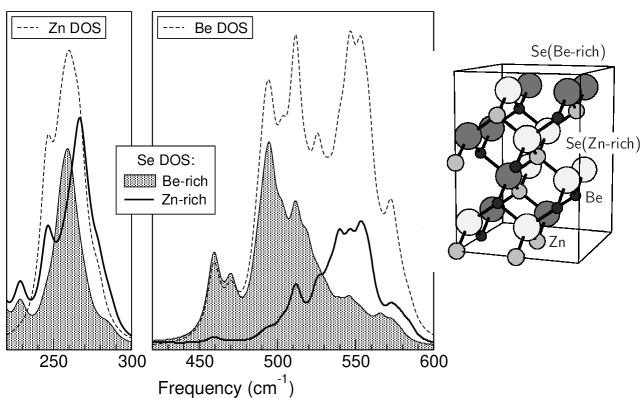
Now we discuss the bond length aspect. What emerges from Fig. 5 is that the longer (shorter) Be-Se and Zn-Se bonds come from Se-centred tetrahedra with a large (small) number of Be atoms at the vertices, i.e. 2-3 (1-2). Note that a similar trend was earlier observed by Silverman et al.37 in their first-principles calculations dedicated to GaInP. Introducing a link to the earlier proposed terminology of the ‘percolation’ picture, we shall refer to such ‘long’ (‘short’) bonds as those belonging to the Be-rich (Zn-rich) region. The important point here is that none of the Be-rich and Zn-rich regions reduces to a single Se-centred tetrahedron species. This implies that the 1-bond2-mode (TO,L) behaviour can not be discussed in terms of a mere tetrahedron problem.
More precisely, what is certain is that the Se atoms surrounded by 1 and 3 Be atoms all belong to the Zn-rich and Be-rich regions, respectively. We take advantage of this clear discrimination and mark the Zn-Se and Be-Se bond lengths just in-between these two data sets (refer to the dotted lines in the middle of the shaded areas at =0 in Fig. 5), for straightforward – qualitative – insight upon the evolutions of the Zn-Se and Be-Se distributions of bond lengths in the Zn-rich and Be-rich regions as the degree of CuPt ordering increases. Among the Se atoms with 2 Be atoms as first neighbours, some belong to the Zn-rich region and others to the Be-rich one, but this discrimination is less straightforward. A possible partition criterion follows from examining the individual atom-resolved TO-DOS for each Se atom (not shown). A given Se atom is classified as part of the Be-rich (Zn-rich) region if the barycentre of its individual TO-DOS is located on the low (high) frequency side, both in the Be-Se and Zn-Se spectral ranges. Obviously this criterion is not free from ambiguity, because some Se atoms vibrate at lower as well as at higher frequencies throughout each of the Zn-Se and Be-Se spectral ranges. Our separation of the Se atoms into those belonging to the Be-rich region and to the Zn-rich one in our =0 supercell is shown in Fig. 7, along with the partial TO-DOS corresponding to these two groups of Se atoms. As expected, the partial TO-DOS of the Se atoms from the Be-rich and Zn-rich regions mimic fairly well the individual and features from the TO-DOS related to the Zn and Be atom species (shown by dotted lines), respectively, in the corresponding spectral ranges.
From the supercell shown in Fig. 7 it appears that the two sub-continua formed by the Se atoms from the Be-rich and Zn-rich regions are finely interlaced, as predicted by the ‘percolation’ picture.11 One crucial question is whether there exists any specific feature in the topologies of the Se atoms from the Be-rich and Zn-rich regions that can be turned into a ‘microscopic rule’ for proper identification of the atoms/bonds from one or the other region. Unfortunately, a careful examination of the two Se-topologies does not reveal any straightforward ‘rule’. Probably the degree of connectivity between the individual bonds of like species should play a role, although a proper criterion in relation to connectivity could not be derived in our case. Our present view is that the topologies of the Be-rich and Zn-rich regions should be more suitably defined at the mesoscopic scale, by using some proper fractal exponent. Further discussion of this aspect falls beyond the scope of this work. Generally, the whole of this is consistent with our description of the 1-bond2-mode (TO,L) behaviour in terms of a percolation-based phenomenon.
At this stage we can state that our first-principles calculations successfully account for a 1-bond2-mode (TO,L) type behaviour not only in the perfectly-ordered CuPt-type alloy (=1), which is rather obvious, but also in the random alloy (=0), as observed in the Raman spectra, which was not so obvious.
IV.2 Phonon / bond length situation in its dependence on the degree of ordering ()
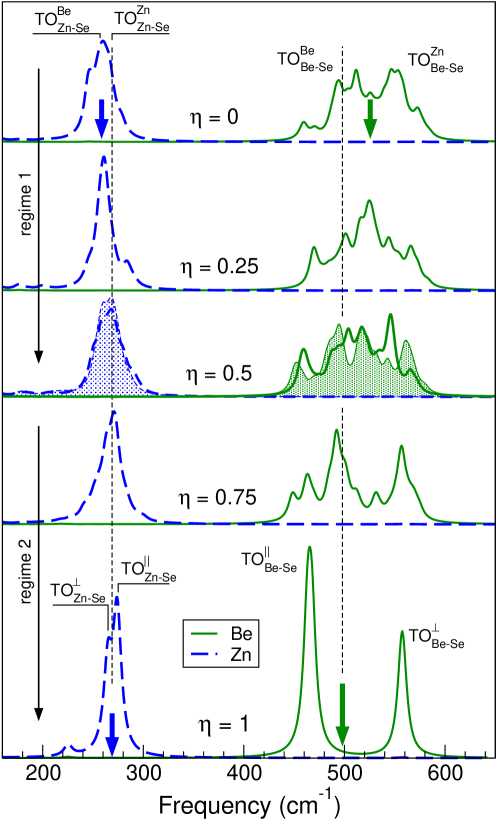
Now we discuss the full -dependence of the bond length data (Fig. 5) and of the TO-DOS (Fig. 6) under the above angle. Two regimes, different in nature, can be distinguished: regime 1, directly issued from the peculiar 1-bond2-mode (TO,L) percolation-type situation at =0; and regime 2, just the progressive building up of the typical 1-bond2-mode (TO,L) superlattice-type behaviour at =1. For more clarity in the discussion below, we mark by arrows the barycentres of the Zn-Se and Be-Se TO-DOS at the extreme values in Fig. 6.
In regime 1 (0¡0.5, typically) the starting (=0) 1-bond2-mode (TO,L) Zn-Se and Be-Se TO-DOS seem to turn progressively 1-bond1-mode (TO,L) in character, simultaneously re-centring upon the individual Zn-Se and Be-Se modes that face each other at =0, i.e. and . This indicates that the transfer of Be-Se oscillator strength detected in the Raman spectra of our epilayers (Sec. III-B) is actually consistent with CPSO. The observed transfer is small in the present case, as already discussed, signing the emergence of CPSO only, i.e. the onset of regime 1.
The end of regime 1, is apparently reached at 0.5 (refer to the middle curve in Fig. 6) – recall our issue (). Indeed at this limit both the Be-Se and Zn-Se phonon responses seem of a 1-bond1-mode (TO) type, although the features are rather broad. More precisely the Be-Se and Zn-Se responses apparently reduce to the only and modes, respectively, that have attracted the quasi-totality of the oscillator strength in each spectral range. Incidentally we have checked that the TO-DOS obtained by inverting Zn and Be atoms in the 0.5 supercell, thereby leaving the value unchanged, is very similar to the original one (refer to the shaded curves at 0.5 in Fig. 6). This confirms that the ‘full condensation’ at 0.5 is not fortuitous, the result of a favourable atom arrangement, but actually intrinsic, fixed by the value only. The whole of this is consistent with the bond length data in Fig. 5. At =0.5, only 6 Be-Se (8 Zn-Se) bonds out of 32 remain ‘short’ (‘long’), i.e. still belong to the Zn-rich (Be-rich) region (compare the data on each side of the reference dotted lines in Fig. 5), if using the terminology of the ‘percolation’ picture. A crucial point is that at 0.5 the local bonding between the anionic and cationic (111) planes still has a (Zn-Se, Be-Se)-mixed character (see the atom arrangement in the 0.5 supercell), as in a random alloy. Regime 1 is schematically represented by the antagonist curved arrows in Fig. 1.
With further ZnBe exchange beyond 0.5, the (Zn-Se, Be-Se)-mixed character of the local bonding between the cationic and anionic planes is lost, due to the formation of ZnSe/BeSe superlattice-like micro-domains here and there (see the atom arrangement in the =0.75 supercell). The alloy enters the so-called regime 2, in which the Be-Se and Zn-Se TO-DOS, and also the bond length distributions, turn bi-modal again, the result of the difference between the in-plane and out-of-plane bond lengths within these micro-domains (refer to the discussion at =1). The trend is emphasized progressively until perfect CuPt-ordering. The key point is that, in contrast with regime 1, regime 2 does not seem much rewarding with respect to further minimization of the local strain energy in the crystal. This is clear especially from Fig. 5, where ordering in regime 2 leaves the overall difference between the Zn-Se and Be-Se bond lengths quasi-unchanged with respect to the 0.5 situation. The same conclusion can be derived also from quasi-invariance of the barycentres of the Zn-Se and Be-Se TO-DOS beyond 0.5 (compare the locations of the dotted lines and of the arrows at =1 in Fig. 6).
Basically it seems that the cause for further SO is suppressed in regime 2, that is the answer to issue () raised in Sec. I. What emerges is that the end of regime 1 should be an intrinsic limit to CPSO. It is important to notice that with the traditional 1-bond1-mode (TO,L) description at =0, the regime 1 is totally suppressed, and along with it the notion of an intrinsic limit to CPSO, being an essential element of this regime, disappears as well.
If we recollect the reference GaInP2 system, it is very interesting to note that 0.5 corresponds to a singularity in the evolution of the bond length distribution versus the order parameter,10 as already discussed. In the latter work the bonds were discriminated a priori according to whether they were along the ordering direction or along the lateral direction, at any value, leading automatically to a discussion of the observed behaviours in terms of superlattice-type effects only, corresponding to our regime 2 essentially. However, the nature of the singularity at 0.5 could not be explained on this basis, neither why this critical value just corresponds to the strongest ordered GaInP2 samples currently available. Our present view is that the singularity in the bond length distribution of GaInP2 parallels the singularity in the phonon mode behaviour of ZnBeSe2, and should be discussed in terms of a transition from regime 1 to regime 2, with, at the end, the proper identification of 0.5 as an intrinsic limit to SO in GaInP2. As a matter of fact we recall that GaInP2 was shown to exhibit the same phonon mode behaviour as ZnBeSe2 at =0.13 Therefore this alloy should go through regime 1 before entering regime 2 when ordering increases.
In summary our view is that in ABC2 alloys, the AB exchange between consecutive substituting planes is advantageous for minimizing the local strain energy until AC/BC superlattice-like micro-domains are formed, and this eventually hinders a further increase of CPSO. This end is reached at 0.5, the junction of regimes 1 and 2. At this limit there is a pure 1-bond1-mode behaviour in the TO Raman spectra. Apart from this special situation the phonon mode behaviour is of a 1-bond2-mode type, whereby this behaviour is of different nature on two different sides of 0.5, i.e. of a percolation-type at lower value and of superlattice-type at higher value.
V CONCLUSION
We tackle the key issue of CPSO by assuming a 1-bond2-mode (TO,L) behaviour for the random A1-xBxC zincblende mixed crystals as accounted for by our so-called ‘percolation’ picture at the mesoscopic scale, which markedly deviates from the traditionally admitted 1-bond1-mode (TO,L) description at the macroscopic scale. In particular, on this novel basis it becomes possible to identify an intrinsic driving force behind the spontaneous local segregation of the A and B species within different, intercalated, series of substituting planes, with interleaving planes of the other unperturbed C species. As a case study we discuss the phonon mode behaviour of the ‘model’ Zn1-xBexSe system, that exhibits a clear 1-bond2-mode behaviour in the Be-Se spectral range, from both the experimental and theoretical sides.
On the experimental side, we discuss the different 1-bond2-mode TO Raman responses of the short Be-Se species from Zn1-xBexSe single crystals (0.100.53) and epitaxial layers (00.92) in the context of our ‘percolation’ approach resorting to the contour modelling for a support. In the single crystals, the strength ratio between the low- and high-frequency Be-Se modes scales as expected for random systems, i.e. as . In the epilayers, the values are larger, corresponding to a typical over (sub) representation of 10% of the ‘longer’ (‘shorter’) Be-Se bonds from the Be-rich (Zn-rich) region, apparently a manifestation of some small degree of CPSO, as earlier discussed in relation to GaInP2.13 Generally the balance of strength between the two modes in the 1-bond2-mode TO Raman response of each bond species in A1-xBxC mixed crystals potentially emerges as a straightforward and sensitive quantitative probe for CPSO at any value. In principle, there is no intrinsic limit of detection here.
On the theoretical side we perform first-principles calculations with a series of fully relaxed Zn8Be8Se16 supercells, for detailed insight into the dependencies of the vibrational and bond length properties on ordering in the representative ZnBeSe2 alloy, from the random limit (=0) up to full CuPt-type ordering (=1). Two different regimes can be distinguished.
Regime 1 corresponds to progressive segregation of the Zn and Be species within alternate substituting planes, that happens so long as the local bonding between the cationic and anionic planes keeps locally a (Zn-Se, Be-Se)-mixed character, like in a random alloy. Regime 1 leads to ‘full condensation’ of the original 1-bond2-mode (TO,L) behaviour at =0 onto the ultimate 1-bond1-mode (TO,L) behaviour where the Zn-Se and Be-Se modes which eventually survive are those with initially closest frequencies, i.e. the harder of the Zn-Se modes and the softer of the Be-Se modes. These obviously refer to the Zn-Se bonds within the Zn-rich region only, thereby all ‘short’, together with the Be-Se bonds within the Be-rich region only, thereby all ‘long’, respectively. This way the contrast between the Zn-Se and Be-Se bond lengths is minimized, thus optimizing the crystal stability. The end of this regime, i.e. the ‘full condensation’, is reached at 0.5. In the synthetic scheme displayed in Fig. 1, regime 1 is represented by the antagonist curved arrows. Basically in the experimental section of this work, we were able to observe the onset of regime 1.
With further local segregation of the Be and Zn species beyond 0.5, the alloy enters regime 2 corresponding to re-adoption of a 1-bond2-mode (TO,L) behaviour, the result of the formation of ZnSe/BeSe micro-domains here and there. The key point is that regime 2 does not seem much rewarding with respect to further minimization of the overall contrast between the Zn-Se and Be-Se bond lengths in the alloy, which therefore eliminates the driving force for a further increase of SO. On the above basis 0.5 appears as an intrinsic limit to SO in ZnBeSe2, and possibly in stoichiometric alloys in general.
Acknowledgements
This work has been supported by the Indo-French Center for the Promotion of Advanced Research (IFCPAR project N∘ 3204-1: Lattice dynamical and structural study of Be-based II-VI semiconductor alloys), and by an Action en Région de Coopération Universitaire et Scientifique (ARCUS) programme. The authors acknowledge the access to the computing facilities at the Centre Informatique National de l’Enseignement Supérieur (CINES project N∘. pli2623, Montpellier, France), and the support of the Region Lorraine for awarding one Chaire Internationale d’Accueil for A.V. Postnikov at University of Metz. The group of Metz would like to thank Dr. K.C. Rustagi for encouragement and useful discussions.
References
| J.C. Mikkelsen and J.B. Boyce, Phys. Rev. Lett. 49, 1412 (1982). | |
| I.F. Chang and S.S. Mitra, Adv. Phys. 20, 359 (1971). | |
| F. Alsina, N. Mestres, J. Pascual, C. Geng, P. Ernst and F. Scholz, Phys. Rev. B 53, 12994 (1996). | |
| A. Hassine, J. Sapriel, P. Le Berre, M.A. Di Forte-Poisson, A. Alexandre and M. Quillec, Phys. Rev. B 54, 2728 (1996). | |
| A. Chakrabarti, P. Kratzer and M. Scheffer, Phys. Rev. B 74, 245328 (2006). | |
| A. Mascarenhas, Spontaneous Ordering in Semiconductor Alloys, (Kluwer Academics, New York, 2002). | |
| . S.B. Zhang, S. Froyen and A. Zunger, Appl. Phys. Lett. 67, 3141 (1995). | |
| A. Gomyo, M. Makita, I. Hino and T. Suzuki, Phys. Rev. Lett. 72, 673 (1994). | |
| A. Chakrabarti and K. Kunc, Phys. Rev. B 72, 45342 (2005). | |
| 10 | Y. Zhang, A. Mascarenhas and L.-W. Wang, Phys. Rev. B 64, 125207 (2001). |
| 11 | O. Pagès, M. Ajjoun, T. Tite, D. Bormann, E. Tournié and K.C. Rustagi, Phys. Rev. B 70, 155319 (2004). |
| 12 | A.V. Postnikov, O. Pagès and J. Hugel, Phys. Rev. B 71, 115206 (2005). |
| 13 | O. Pagès, A. Chafi, D. Fristot and A.V. Postnikov, Phys. Rev. B 73, 165206 (2006). |
| 14 | H.M. Cheong, F. Alsina, A. Mascarenhas, J.F. Geisz and J.M. Olson, Phys. Rev. B 56, 1888 (1997). |
| 15 | F. Alsina, J.D. Webb, A. Mascarenhas, J.F. Geisz, J.M. Olson and A. Duda, Phys. Rev. B 60, 1484 (1999). |
| 16 | O. Pagès, T. Tite, A. Chafi, D. Bormann, O. Maksimov and M.C. Tamargo, J. Appl. Phys. 99, 63507 (2006). |
| 17 | B. Freytag, P. Pavone, U. Rössler, K. Wolf, S. Lankes, G. Schötz, A. Naumov, S. Jilka, H. Stanzl and W. Gebhardt, Solid State Commun. 94, 103 (1995). |
| 18 | D. Stauffer, Introduction to Percolation Theory (Taylor and Francis, London, 1985). |
| 19 | C. Vérié, J. Cryst. Growth 184/185, 1061 (1998). |
| 20 | V. Wagner, J.J. Liang, R. Kruse, S. Gundel, M. Keim, A. Waag and J. Geurts, Phys. Stat. Sol. (b) 215, 87 (1999). |
| 21 | H.M. Cheong, S. P. Ahrenkiel, M. C. Hanna and A. Mascarenhas, Appl. Phys. Lett. 73, 2648 (1998). |
| 22 | M. C. Hanna, H. M. Cheong and A. Mascarenhas, Appl. Phys. Lett. 76, 997 (2000). |
| 23 | A. M. Mintairov, P. A. Blagnov, V. G. Melehin, N. N. Faleev, J. L. Merz, Y. Qiu, S. A. Nikishin and A. Temkin, Phys. Rev. B 56, 15836 (1997). |
| 24 | N. Mestres, F. Alsina, J. Pascual, J.M. Bluet, J. Camassel, C. Geng and F. Scholz, Phys. Rev. B 54, 17754 (1996). |
| 25 | C. Chauvet, Ph.D thesis, Centre de Recherche sur l’Hétéroépitaxie et ses Applications (CNRS), University of Nice Sophia-Antipolis, 2001. |
| 26 | O. Pagès, M. Ajjoun, D. Bormann, C. Chauvet, E. Tournié, J.P. Faurie and O. Gorochov, J. Appl. Phys. 91, 9187 (2002). |
| 27 | O. Pagès, M. Ajjoun, J.P. Laurenti, D. Bormann, C. Chauvet, E. Tournié, J.P. Faurie and O. Gorochov, Opt. Mat. 17, 323 (2001). |
| 28 | R. Loudon, Adv. Phys. 13, 423 (1964). |
| 29 | P. Ordejon, E. Artacho and J. M. Soler, Phys. Rev. B 53, R10441 (1996). |
| 30 | J. M. Soler, E. Artacho, J. D. Gale, A. Garcia, J. Junquera, P. Ordejon, and D. Sanchez-Portal, J. Phys.: Condens. Matt. 14, 2745 (2002). |
| 31 | A. Bukaluk, A.A. Wronkowska, A. Wronkowski, H. Arwin, F. Firszt, S. Ł\kegowski, H. M\keczyńska, J. Szatkowski, Appl. Surf. Sci. 175-176, 531 (2001). |
| 32 | C. Chauvet, E. Tournié and J.P. Faurie, Phys. Rev. B 61, 5332 (2000). |
| 33 | E. Tournié, C. Morhain, G. Neu, M. Laügt, C. Ongaretto, J.-P. Faurie, R. Triboulet and J. O. Ndap, J. Appl. Phys. 80, 2983 (1996). |
| 34 | M.-H. Tsai, F. C. Peiris, S. Lee and J. K. Furdyna, Phys. Rev. B 65, 235202 (2002). |
| 35 | T. Tite, O. Pagès, E. Tournié, Appl. Phys. Lett. 85, 5872 (2004). |
| 36 | O. Pagès, T. Tite, K. Kim, P.A. Graf, O. Maksimov and M.C. Tamargo, J. Phys.: Condens. Matter 18, 577 (2006). |
| 37 | A. Silverman, A. Zunger, R. Kalish and J.Adler, Phys. Rev. B 51, 10795 (1995). |