Linear response separation of a solid into atomic constituents:
Li, Al, and their evolution under pressure
Abstract
We present the first realization of the generalized pseudoatom concept introduced by Ball, and adopt the name enatom to minimize confusion. This enatom, which consists of a unique decomposition of the total charge density (or potential) of any solid into a sum of overlapping atomiclike contributions that move rigidly with the nuclei to first order, is calculated using (numerical) linear response methods, and is analyzed for both fcc Li and Al at pressures of 0, 35, and 50 GPa. These two simple fcc metals (Li is fcc and a good superconductor in the 20-40 GPa range) show different physical behaviors under pressure, which reflects the increasing covalency in Li and the lack of it in Al. The nonrigid (deformation) parts of the enatom charge and potential have opposite signs in Li and Al; they become larger under pressure only in Li. These results establish a method of construction of the enatom, whose potential can be used to obtain a real-space understanding of the vibrational properties and electron-phonon interaction in solids.
pacs:
71.15.-m, 71.20.Dg, 74.25.Jb, 74.62.FjI Introduction
The desire to describe condensed matter as a collection of (generalized) atoms is older than the discipline of solid state physics itself, extending back to the ancient Greek atomists.demo ; book This passion remains as strong as ever, embodied in site-based models, atomic orbital calculational approaches, and in a resurgence of interest in Wannier functions. At the other extreme lies the homogeneous electron gas starting point for condensed systems, where the atomic nature is disregarded at first and brought in only as necessary to address the realities of real solids. These two viewpoints comprise the traditional viewpoints of solid state chemistry and condensed matter physics, respectively. The simple model of overlapping free atoms is useful pedagogically but neglects the real physics of the formation of solids.
Anti-intuitively, the itinerant weak-pseudopotential viewpoint provided the first example of how the density and the electronic potential can be separated uniquely into atomic contributions. In the limit of weak pseudopotentials, the neutral pseudoatom approach of Zimanziman gives a description of a nearly-free-electron solid as overlapping atomic contributions, a description that extends to lattice dynamics and even to the melt. It is however severely restricted by the limitation to weak pseudopotentials, which applies only to the alkali metals and may not give satisfactory accuracy even there.
Dagens defined an auxiliary neutral atom arising from a change in density (with zero net charge) induced by a screened potential in jellium.dagens This density functional theory inspired prescription was solved numerically for Li and Na, but does not address the overlapping of such entities. In the work of Streitenberger streitenberger a generalized pseudoatom model is introduced that extends the pseudoatom concept of Ziman to inhomogeneous electron-ion systems for simple metals. The model is based on linear-response theory in the density functional framework and is applied to a metal surface.
I.1 Formal background
Three decades ago Ball introduced a generalized pseudoatom density decomposition concept, one that applies to any solid. Ball1 ; Ball2 It is this specification that we follow in this paper. The development of the broad pseudoatom concept and the terminology (pseudoatom; auxiliary neutral atom; generalized pseudoatom; quasi-atom) has a long history, and the term pseudoatom also means ‘atom described by a pseudopotential’ and ‘phantom atom to tie off dangling bonds’, as well as many other applications, as a literature search will readily reveal. It will therefore be useful to introduce unambiguous language in the following: instead of using the generalized pseudoatom terminology of Ball we introduce the term enatom. 111Greek: ”en” denotes within or inside; ”atom” denotes indivisible part. Therefore ”enatom” connotes the indivisible part inside a system. It should be clarified that Ball’s pseudoatom has nothing to do with any pseudopotential (a common use of the term).
For any reference position of atoms, the (vector) first-order change in charge density upon displacing one atom at from its equilibrium position , i.e., the linear response to displacement, can be separated into its irrotational and divergenceless components
here is the charge density of the system. An immediate result is a pair of remarkable sum rules. Ball1 (i) The lattice sum of the rigid density222Our definition of the rigid part is predominantly positive [like ] and differs in sign from the convention of Ball.Ball1 gives an exact decomposition of the crystal charge density into atomic contributions:
| (2) |
(ii) The lattice sum of the deformation density (or “backflow”) vanishes identically:
| (3) |
This strong constraint reflects that this nonrigid density is a cooperative effect of neighboring atoms, which nevertheless can be broken down uniquely into individual atomic contributions. Clearly atoms that are equivalent by symmetry have identical and ; an elemental solid with one atom per primitive cell only has one of each.
This cooperative origin (a solid state effect) of the deformation density can be understood by considering that an atom, embedded in a jellium background, would have no deformation density. In fact, if the density is when the atom is at the origin, then by translational symmetry the density is when the atom is located at . Therefore and there is no nonrigid contribution. Furthermore, within standard treatments (such as the local density approximation) is spherical, because the atom is embedded in an isotropic environment. Thus the deformation density and the anisotropy of the rigid density arise solely from the inhomogeneity of the system, i.e., by neighboring atoms. The other extreme is represented by a covalent solid, which is held together by strong directional bonds. The rigid density will be highly non-spherical, and the deformation density will be comparatively large, reflecting the fact that when an atom moves its bonding is disrupted.
To first order in displacements from the reference point (typically the equilibrium lattice), the density is given by Ball1
The quantity inside the sum is the enatom of atom and moves rigidly with the nucleus to first order. (The in the argument of can be replaced by without changing the expression to first order.) Analogous decomposition and sum rules apply to the potential :wep
Since and are first order quantities, the changes in density and potential 333The fields and are only defined up to a gauge transformation: leads to the same physical deformation density for any scalar ‘potential’ . Nevertheless, it makes sense to specify and uniquely (up to a constant) by requiring it to be divergenceless. The Helmholtz prescription provides this divergenceless field. wep can be related by linear response theory.wep The deformation arises solely from off-diagonal components of the dielectric matrix , i.e., deviation of from the form.
Equation (I.1) allows for a transparent interpretation of the quantities and . The total charge density of a system of displaced atoms is constructed from the charge densities that move rigidly with the atoms upon displacement, plus a second part that describes how the charge density deforms due to nuclear displacement.
It is important to keep in mind that, although the rigid enatom density (potential) is a specified decomposition of the crystal analog, it does not arise simply from screening of the pseudopotential (which is the case in weak pseudopotential theory). It is intrinsically a dynamically determined quantity, involving only linear response. Specifically, the enatom potential arises from a screened displaced (pseudo)potential
| (6) |
while the enatom density arises from the linear change in wave functions
| (7) |
which can be obtained from first-order perturbation theory. (The first factor of 2 is for spin.)
A related quantity is the atomic deformation potential (change in any band energy due to displacement of the atom at ), given from perturbation theory by
| (8) |
in terms of enatom quantities. Khan and Allen showed the relation of this deformation potential to electron-phonon matrix elements.khan Resurgent interest in electron-phonon coupled superconductivity has led to the suggestion by Moussa and Cohen that this quantity may provide insight into strong coupling.Cohen
Although Ball was the first to introduce the enatom decomposition and begin to make use of it, the importance of had been recognized earlier. Sham emphasized its essence in the formulation of lattice dynamics, related it to the shift in potential by the density response function,sham and tied its integral to effective charges. Its application to ionic insulators was extended by Martin, who showed that the enatom dipole and quadrupole moments are the fundamental atomic entities that underlie piezoelectricity.martin
As powerful as the enatom concept is (see discussion below), very little use has been made of it. Falter and collaborators have adopted a related quasi-ion idea for sublattices of multiatom compounds, and used linear response theory (or models) to evaluate sublattice charges for Si.falter85 ; falter89 Ball and Srivastava calculated some aspects of the rigid and deformation parts of the density in Ge and GaAs from bond-stretch distortions.BS No calculation of single enatom quantities yet exist for any material.
I.2 Motivation
The enatom concept will be particularly important in studying and understanding phonons and electron-phonon coupling, which requires only information arising from an infinitesimal displacement of atoms (thus, linear response). Current implementations of linear response theory calculate the first-order change in potential due to a given phonon, and uses periodicity and Bloch’s theorem to reduce the calculation to a unit cell (still time-consuming). This linear response problem must be solved separately for each phonon momentum . Using the enatom concept and linear superposition, it is necessary only to calculate the enatom density and potential once (for each inequivalent atom in the primitive cell) and perform elementary integrals necessitating only linearly superimposed, overlapping enatom potentials to calculate the phonon frequencies. (We are concerned here only with metals; Ball has shown that insulators with long-range potentials require extra considerations.Ball2 ) The electron-phonon matrix elements are even easier, as they can be reduced to calculating the matrix elements of the enatom potential of each inequivalent atom only. This might not be quite as easy as it sounds, because the enatom may in some cases have to be calculated out to a distance of several shells of neighbors to obtain convergence of the integrals. We postpone the phonon problem to future work.
| Li | 0 | 1.00 | 7.98 | 0.79 | 3.41 | 1.13 | 0.27 | 0.52 |
|---|---|---|---|---|---|---|---|---|
| 35a | 0.52 | 6.41 | 1.52 | 2.58 | 1.02 | 0.30 | 0.55 | |
| 50 | 0.44 | 6.05 | 1.81 | 2.39 | 0.98 | 0.29 | 0.54 | |
| Al | 0 | 1.00 | 7.50 | 2.85 | 2.61 | 0.91 | 0.83 | 0.91 |
| 35 | 0.77 | 6.89 | 3.67 | 1.96 | 0.87 | 0.97 | 0.98 | |
| 50 | 0.73 | 6.75 | 3.90 | 1.85 | 0.86 | 1.01 | 1.00 |
For a first detailed application of this enatom concept to enhance understanding of bonding and electron-phonon coupling, we choose the simple metals Li and Al. Lithium has attracted renewed interest due to the recent discovery that, in spite of being a simple free-electron-like metal that is not superconducting above 100 K at ambient pressure,lang99 it displays high T 15-17 K in the 30-40 GPa range,shimizu ; struzhkin ; schilling and Tc = 20 K has been reportedshimizu around 50 GPa. This discovery made Li the best superconducting elemental metal (now equaled by yttriumhamlin and apparently surpassed by calciumyabuuchi06 ). The evolution of the electronic structure and electron-ion scattering within the rigid muffin-tin approximation is well studied.shi ; christensen Application of microscopic superconductivity theory, with phonon frequencies and electron-phonon (EP) matrix elements calculated using linear response methods,profeta ; deepa ; deepa2 ; maheswari has established that this remarkable level of Tc results from strong increase of EP coupling under pressure. The one aspect of the electron-phonon behavior in Li that is not yet understooddeepa2 is the strong branch dependence of electron-phonon matrix elements. Application of enatom techniques promises to be an ideal way to approach the remaining questions.
Aluminum is the simplest trivalent metal, with Tc = 1.2 K at ambient pressure; superconductivity is suppressed with pressure, with T K at 6 GPa.Al:Tc:pressure Under pressure the electronic structure of Al remains that of a free electron-like metal, and a structural transition to a hcp phase takes place only at GPa.Al:structure:pressure Li, on the other hand, becomes more and more covalent and undergoes several phase transitions. Li:structure In the case of metals we use the term “covalency” in a loose sense to indicate the appearance of directional bonds. The vibrational and electronic properties of the two systems also display important differences. While the electronic structure, Fermi surface and vibrational spectrum of Al follow a completely normal trend (i.e., the band dispersion becomes steeper, the Fermi surface is virtually unchanged and the phonon spectrum is hardened), in fcc Li the FS evolves from a typical s-like shpere into a multiply-connected (Cu-like) shape, with necks extending through the L points, reflecting the increase in p character. In the phonon spectrum, structural instabilities appear around 35 GPa along the line, due to the strong e-ph coupling of some selected phonon modes, whose wave vector connects the necks on the Fermi surface (cf. Refs. profeta, , deepa, ). We therefore expect that also the enatom of the two systems will display different behaviors under pressure.
II Calculational approach
The enatom could be computed by evaluating the linear response of a system to the displacement of a single atom, that is, the dielectric response . While this may be a viable approach, it is demanding and tedious and we use another method that requires only minor additional codes. Our approach is to let the computer do the linear response for us, by choosing a supercell, displacing one atom (taken to be at the origin), and obtaining the linear changes and by finite differences. Using cubic symmetry, displacement in a single direction is sufficient to obtain the full vector changes. The enatom components (rigid and deformation) are then obtained using the Helmholtz decomposition of a vector field into its irrotational and divergenceless parts. wep
We obtained the enatom for fcc Li and fcc Al at atomic volumes corresponding to 0, 35, and 50 GPa pressure. We used a cube supercell of lattice constant =3 (lattice constants are listed in Table 1), which contained 433=108 atoms. The enatom is represented as a Fourier series in the supercell. For the jellium calculations we set a single Li or Al atom into cubic supercells whose lattice constants correspond to the P=35 GPa cases. The mean electronic density was made equal to the related crystalline systems and a homogeneous positive jellium background provided charge neutrality.
For the self consistent density functional calculations we employed the PWSCF code PWscf and Troullier-Martins Troullier-Martins norm conserving LDA pseudopotentials and a plane wave cutoff energy of 20 Ry for both Li and Al. For the k-space integration in the primitive fcc unit cell we used a Monkhorst-Pack grid, MPgrid with a cold-smearing parameter of 0.04 Ry.Coldsmearing With these parameters, we obtained a convergence of 0.2 mRy in the total energy and of 0.2 GPa for the pressure at 35 GPa for both systems. For the large cubic supercell, we used a Monkhorst-Pack mesh, yielding four points in the irreducible Brillouin zone, and the same cold-smearing parameter of 0.04 Ry. With this choice, the total energy (pressure) calculated in the supercell equals that of the original fcc lattice within 0.1 mRy and 0.1 GPa, respectively. The pressure was calculated from a Birch-Murnagham fit of the LDA vs curve. Al:syassen , 444To test the applicability of the pseudopotential method to high pressures, we calculated the energy vs. volume relation for the two systems and fitted it to a Birch-Murnaghan equation, to extract the equilibrium volume () and the bulk modulus at zero pressure () and its derivative at zero pressure (). For Lithium we obtained : V0 = 127.16 , B0 = 14.9 GPa, B = 3.33. For Al we obtained: V0 = 105.3 , B0 = 82.7 GPa, B = 4.2, in reasonable agreement with the experimental values (V0 = 111.2, B0 = 72.7 GPa, B = 4.3).Al:syassen
In Table 1 we summarize the most relevant properties of Al and Li as a function of pressure. Since the independent variable in our calculations is the volume of the unit cell, we also include a column showing the relative volume change. We notice that the lattice constant of Li decreases very rapidly with pressure, as signaled also by the very small bulk modulus. At GPa, the unit cell volume of Li is already one half of its value. For comparison, the volume of Al at 50 GPa is 73% of its zero pressure value.
III Analysis
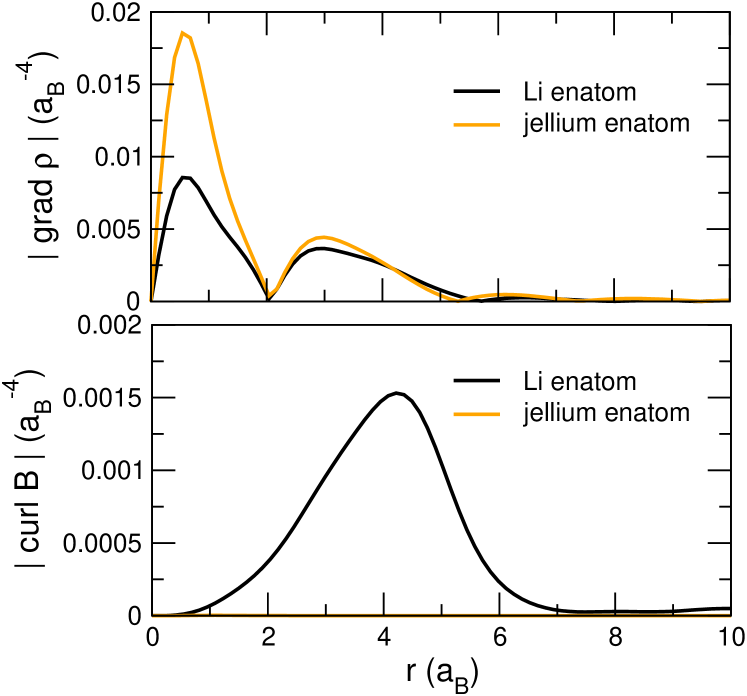
As a test of our numerical approach we checked that the sum rules of Eqs. (2) and (3) were almost perfectly fulfilled. For the jellium enatom the deformation part should be exactly zero, as discussed in Sec. I.1. The deformation is not identically zero for our jellium enatom due to supercell effects. These effects are however very minor, viz. the maximum of the jellium deformation density is 500 times smaller than the maximum of the Li crystal deformation density.
(
(
a)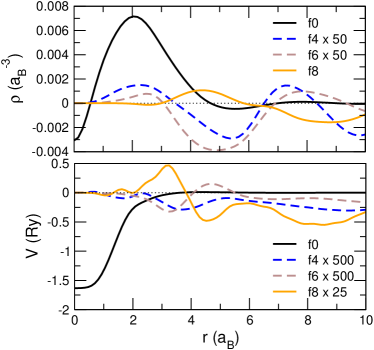 b)
b)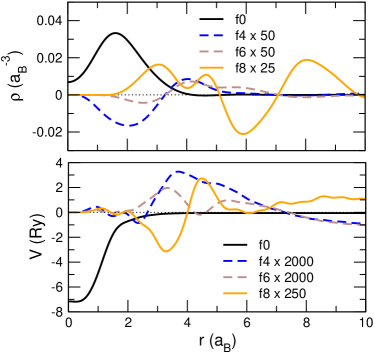
III.1 Deformation vs rigid part
In Fig. 1 we show the magnitudes of the vector fields and along a [110] direction. The rigid parts for fcc Li and the Li-in-jellium model have the same magnitude and overall shape, while the deformation parts are very different. For Li is approximately one order of magnitude smaller than . This behavior reflects a general trend expected in simple metals: the deformation part is much smaller than the rigid, nevertheless it is quite revealing, as we demonstrate below.
To quantify the strength of the fields we are considering in a more precise way, we define the magnitude of a scalar or vector field as the root mean square
| (9) |
where is the volume of the supercell. The relative importance of and in Eq. (I.1) can be quantified by defining a rigidity factor as
| (10) |
This ratio is one measure of how rigidly the enatom density (or potential, defined analogously) follows the nucleus. For the perfect jellium enatom and the rigidity factor would diverge. But because of the already mentioned supercell effects, we obtain (1400) for the density and (1500) for the potential of jellium Li (Al), which demonstrates again that the supercell effects are indeed small.
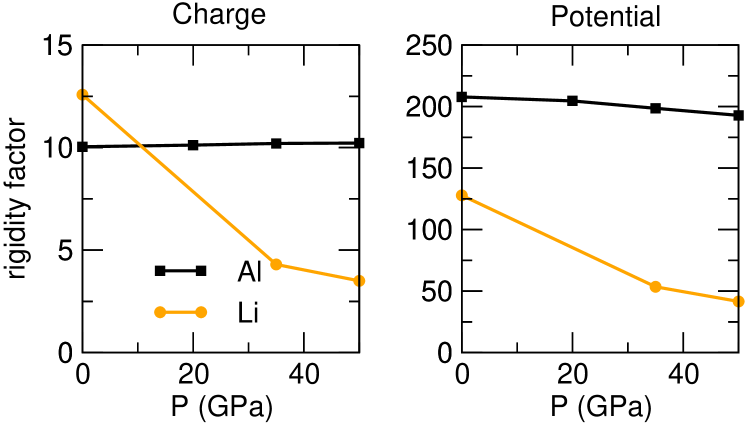
In the actual compounds, for the charge, has similar values at zero pressure but decreases by a factor of 3 between 0 and 50 GPa in Li, whereas it is unchanging in Al, as shown in Fig. 2. For the potential, is almost a factor of 2 smaller in Li than in Al at zero pressure, and again decreases with pressure while that for Al remains constant. This very different behavior in two simple metals is further corroboration that Li is increasing in covalency with pressure, while Al is not. The large values of for the potential reflects the fact that the change in potential (e.g. due to phonons) is dominated by a rigid part, which provides justification for a rigid screened ion or the rigid muffin tin potential approximation.gaspari
III.2 Rigid part
III.2.1 Lattice harmonic decomposition
(
(
a)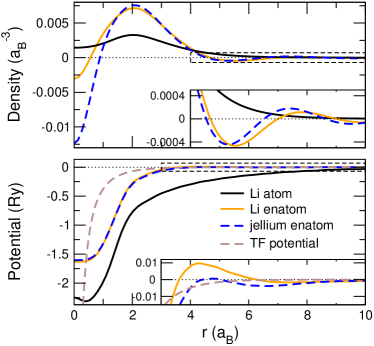 b)
b)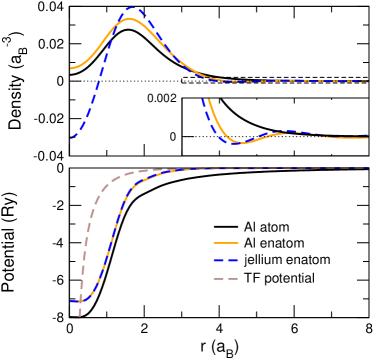
To define the degree of sphericity of the rigid density and potential these scalar functions can be expanded in lattice harmonics of full cubic symmetry, identified with angular variation =0, 4, 6, 8…:
| (11) |
where is the kubic harmonic vdlage built from spherical harmonics of angular momentum (see Ref. lehmann, ), are the radial expansion coefficients, and . In our case the functions are normalized according to , which ensures that the first radial expansion term is equivalent to the spherical average, i.e., .
In Fig. 3 we display the radial expansion coefficients at 35 GPa, relative to the (obviously much larger) spherical part. The ideal jellium enatom is perfectly spherical and thus contains only (see Sec. I.1). The decomposition of our supercell jellium model reveals small terms, due to small supercell effects. The magnitudes of for Li and Al are comparable to the supercell effects in the jellium enatoms, as the supercell boundary is approached. Therefore we conclude that the lattice harmonic coefficients , , are meaningful only within a radius of /3.
While the general characteristics and relative signs of the terms are quite different in Li and Al, in most cases their maximum is only 1% or less of the maximum of , for both density and potential. The only exception is the lattice harmonic in the density of Li, which is surprisingly large around the nearest neighbor distance 4.5 . This anisotropy reflects the ‘cooperative’ influence of neighboring atoms in determining the enatom character. The relative size of the peak grows from 8% to 16% of the maximum of from 0 to 50 GPa. With increasing covalency in Li under pressure not only but all non-spherical contributions to the rigid density increase; this effect cannot be seen in Al.
For the enatom potentials, the non-spherical terms are small enough in fcc Li and Al at all volumes studied that the enatom potentials can be considered effectively spherical, as is the common assumption in simple metals.Ole1
III.2.2 Screening effects
Figures 4 and 5 show the rigid parts of density and potential and their pressure evolution. From linear screening theory we know the spherical part of the induced change in charge density for a simple metal will have long-range (but rapidly decaying) Friedel oscillations. Our approach reproduces the long-range oscillations according to
| (12) |
with reasonable agreement (see insets in Figs. 4 and 5); they should be important primarily for describing long-range force constants. The corresponding oscillations of the enatom potential are not expected to be as important, and we confirm this expectation, as the oscillations visible in the inset in the lower panel of Fig. 4(a) are indeed very small.
In the lower panels of Fig. 4 we also see that the screening in the solid causes the enatom potentials to be significantly more short ranged than the atomic potentials. Furthermore, the enatom potential is less attractive by 0.7 to 0.9 Ry in these atoms. The gradients, which determine electron-phonon matrix elements, do not seem to differ greatly. Note that the pseudopotential we have used is non-local, and in the plots only the local () component is shown. The total potential will include the nonlocal parts, which are non-vanishing only within the core radius ( ) and move rigidly.
To understand this screening better we compare the rigid enatom potential with the Thomas-Fermi potential
| (13) |
where is the total charge of the valence electrons and is the Thomas-Fermi screening length calculated from the mean valence density 555Thomas-Fermi screening length: , it the mean electronic valence density in atomic units (see Table 1). (given in Table 1). For both systems and all pressures we find good agreement for the long range behavior, confirming that the system is still dominated by homogeneous electron-gas screening. The electronic density of Al is higher than the one of Li and therefore the screening is stronger. As a consequence the effective potential in Al is more localized than the one of Li. The agreement with linear screening is better for Al than for Li, further supporting the deviation of Li from the homogeneous electron density picture.
(
(
a)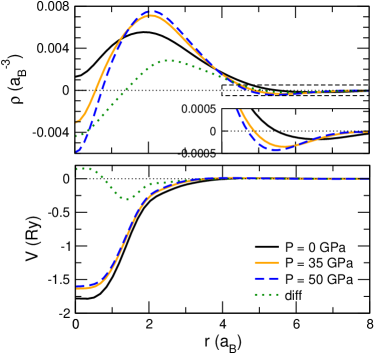 b)
b)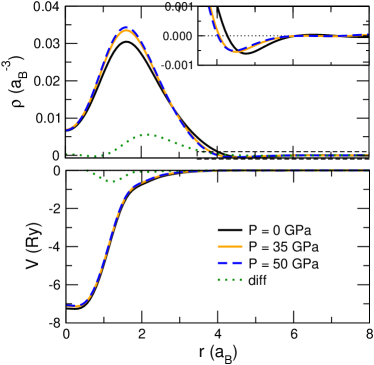
III.2.3 The rigid enatom density and potential
The spherical average of the rigid enatom density contains a charge equal to the valence, which is compared to a valence density for the isolated atom in Fig. 4, and also with the corresponding enatom in jellium of the appropriate density. Note first that, while in a pseudopotential calculation the density (potential) inside the core radius does not have much physical meaning, changes within the core radius will still be useful probes of the enatom character.
The enatom density and potential are both more localized
than in the isolated atom. This difference can be ascribed to two effects.
(i) The density in the tail region is screened in the
solid, making the effective potential more short ranged and causing charge to move inward.
As a result the peak value around 2 increases.
(ii) There is also charge that moves outwards from the core region, causing the peak value
to increase further but also to move outwards.
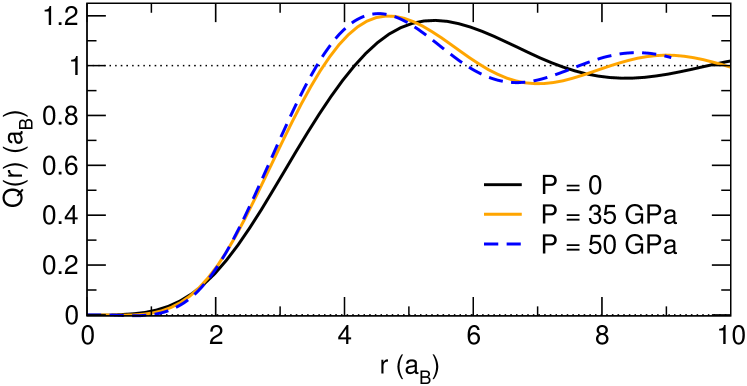
The tail is very similar in jellium and in the solid (a consequence of similar Thomas-Fermi screening), but in the core region and around the maximum the densities are different. The jellium enatom density becomes negative near the nucleus, with the amount of negative density in the core region being about 1% of the valence, for both the Li and Al jellium models. Thus this region does not contain a significant amount of negative density, but it still causes some charge to move away from the core. As a result the peak value of the jellium enatom is slightly higher and further out than the one of the crystal enatom. (Note: in actual supercell calculations there is never any negative density, as the negative dip is compensated by tails of neighboring atoms.)
III.2.4 Pressure evolution
The pressure evolution of the rigid enatom density and potential are compared on an absolute length scale in Fig. 5. Here we can identify aspects of the same two effects as described in the preceding section. Under pressure the enhanced electronic screening makes the effective potentials more short ranged, and results in the screened charge moving inward (effect (i)). For Al the increasing pressure causes first a decrease of the extent of rigid density around 4 (see inset) and second, an increase of the peak value around 2 of about 12% from 0 to 50 GPa. For Al the potential change with pressure is negligible.
Effect (i) (screening) has a stronger influence in Li than in Al because, first, the density is lower so screening is less, and second, the relative volume change is larger. The peak value increases by more than 1/3 from 0 to 50 GPa.
But here we also find effect (ii) which causes a small amount of charge to move away from the core and leads to an outward shift of the peak position in the rigid density from 1.9 (P=0) to 2.1 (50 GPa). The shift of charge is indicated more clearly in Fig. 6, where the integrated charge is shown for Li.
The pressure evolution of the enatom potential is characterized by a decrease in attraction at small , from -1.78 Ry (P=0) to -1.60 Ry (50 GPa) in Li. This decrease is fairly uniform over the region out to 3.2-3.5 beyond which it becomes negligible. In Al the decrease in attraction between P=0 and P=50 GPa is only 2%. For 35 and 50 GPa the rigid density of the Li enatom is negative inside 1 , but the amount of negative density contained within that region is less than 1% compared to the total valence charge, and does not even show up in the plot of the integrated charge in Fig. 6.
III.3 Deformation part
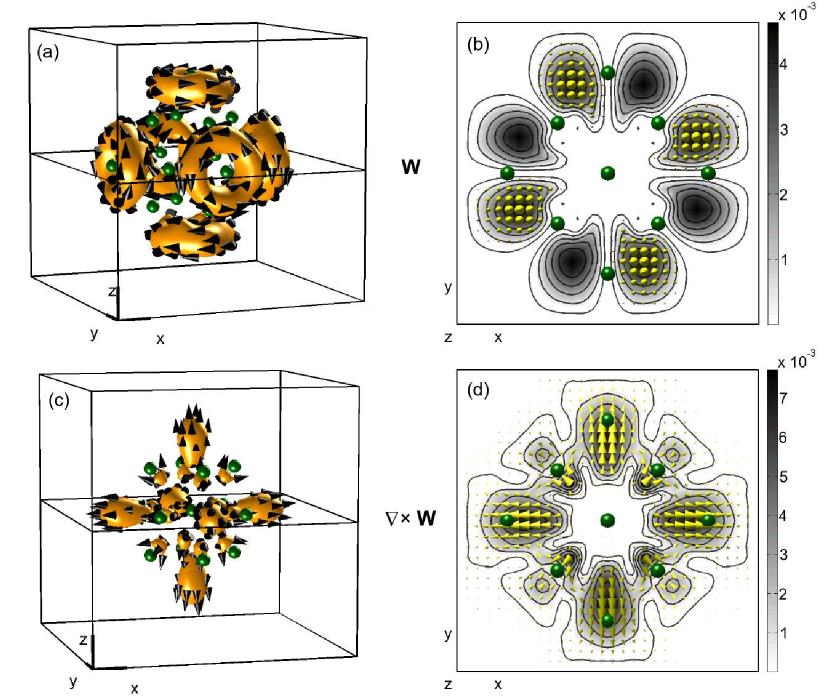
In general the vector fields and (Eqs. (I.1) and (I.1)) that describe the deformation parts of density and potential have similar morphologies that reflect the symmetry of the lattice. or form symmetry related “donut”swirls centered at different distances along lines connecting the central atom and first (1nn) and second (2nn) nearest neighbors, i.e., the crystal axes (see Fig. 7(a), where only swirls around the 2nn are visible). The swirls associated with the 1nn and 2nn have opposite rotational directions. The derived fields or are large at the centers of the swirls of or (see Fig. 7(c)), and they are primarily directed radially.
It is informative also to view these fields in planes as done in Fig. 7(b) or Fig. 7(d), where the precise position and spatial extent of their features can be judged. It can be seen, for example, that the donuts pictured in Fig. 7(a) are nearly centered on the 2nn Li sites and that is oriented perpendicular to the plane, pointing either towards the viewer (vectors visible) or in the opposite direction (vectors not visible). As only the fields or are involved in the calculation of physical properties (see Eqs. (I.1), (I.1), and (I.1)), we will focus our attention on them. A comparison of the deformation parts of density and potential for two different pressures, for both Li and Al, is given in Figs. 8 and 9.
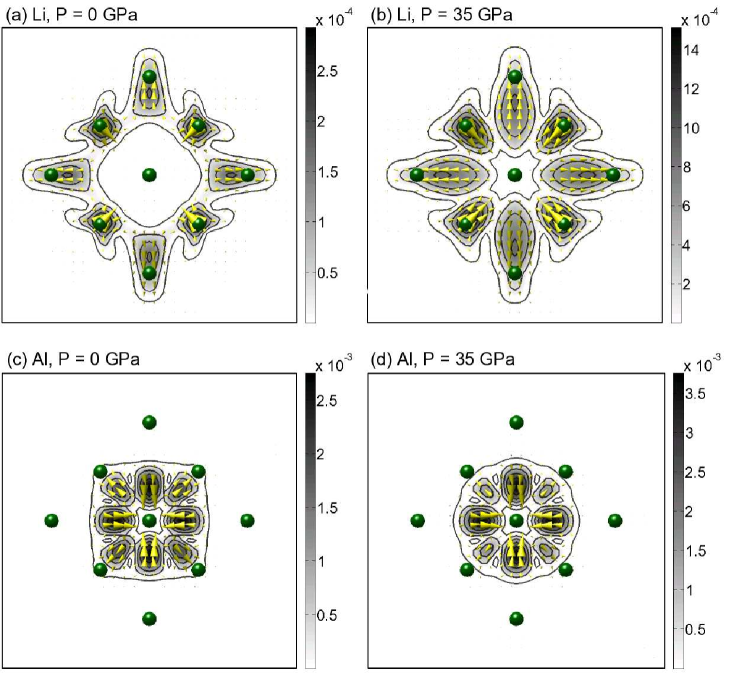
III.3.1 Density deformation
In Li at P=0 the maxima of the charge deformation , shown in Fig. 8, are strongly localized around the nearest neighbors. Under pressure these maxima are pulled inward. The direction of the field determines the sign of the charge deformation. For Li in Fig. 8 (see Eq. (I.1)) is positive for , so there is a ‘charge transfer’ from behind the displaced atom, to in front of it. Such charge distribution reflects a displacement-induced dipolar moment described by the deformation (and which will be screened locally in a metal). At 45∘ (at the 1nn sites, in fact) there is a depletion of charge, with a corresponding increase at 135∘ (on the 1nn behind the displaced atom). In Al the pattern is similar, but the sign is reversed and the maxima are nearer the nucleus. These differences will affect their dynamical properties differently; this influence may be significant in Li and is probably not in Al as it remains more free-electron-like.
Under pressure, the magnitude of in Li increases quite significantly, being at P=0 and increasing by an order of magnitude at 50 GPa. This change, consistent with increased covalency, is the cause of the large drop of the rigidity factor in Fig. 2. The pressure evolution in Al is marginal: is at P=0 and increase by only 30% at 50 GPa.
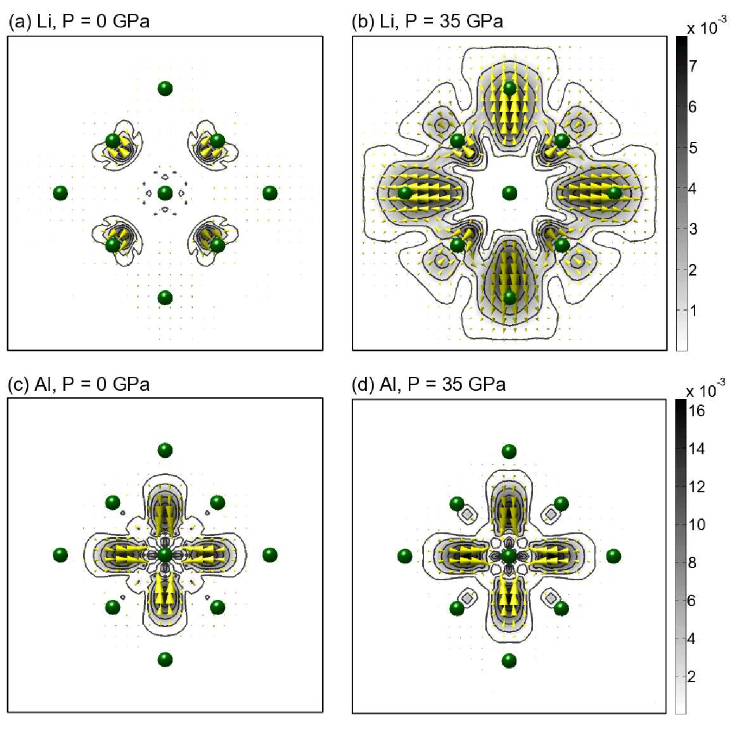
III.3.2 Potential deformation
The potential deformation in Li undergoes a surprisingly large pressure evolution, reflected in the shape, magnitude , and extent of . is at P=0 and increases by over a factor of 4 by 50 GPa. The contour plot of Fig. 9 shows the change from P = 0 to 35 GPa. Starting with a small deformation located on the 1nn, maxima in the deformation grow in substantial regions including the 2nn.
For Al, has its maxima along the cubic axes, and much closer to the nucleus. As for the charge deformation, has the opposite sign compared to Li, and its change with pressure is minor.
Given the simple shape of the deformation term , it is easy to understand its effect on the total change in the potential (Eq. (I.1)). gives an additional dipolar-type contribution, adding to the main change of potential which has a dipolar form arising from displacement of the (nearly spherical) rigid potential.
The pressure evolution of the rigidity factor for the potential in Li (see Fig. 2) shows that at 50 GPa the deformation part contributes about 2% to the total change in potential (for Al this contribution is negligible). For materials with lower rigidity the deformation part might give substantial contributions to , large enough to affect its scattering properties or the strength of electron-phonon coupling.
Additional to the figures shown in this paper we provide several color graphs, showing examples of enatom quantities for Li in 3D and 2D views, as supplementary material for download. SuppMat
IV Discussion and Summary
In this paper we have provided a numerical linear response approach, and the first explicit examples, of the enatom (the generalized pseudoatom introduced by BallBall1 ) density and potential for Li and Al, at pressures of 0, 35, and 50 GPa. This enatom consists of a rigid and a deformation density (and potential). The rigid part defines a unique decomposition of the equilibrium density (potential) into atomic-like but overlapping contributions that move rigidly, to first order, with the nuclear position. The deformation density (potential) describes (again to first order in the displacement) how this charge (potential) deforms, and can be viewed as a backflow, or (depending on its shape) as a mechanism that transfers charge from one side of the displaced atom to the other. The enatom quantities were obtained from supercell finite-difference calculations, demonstrating that this approach provides a feasible numerical treatment.
A rigidity factor was introduced to quantify the relative importance of the rigid and deformation parts of the enatom, i.e., characterize how rigidly the charge (or potential) moves upon displacement. The rigidity factor is expected to be smaller for covalent materials whose bonding is strongly direction-dependent, and larger for metals that lack such strong bonding.Ball1 It has been emphasized recently that Li becomes more covalentdeepa ; deepa2 under pressure; the various components of the Li enatom have substantiated this trend and provided specific ways in which this covalency arises. Aluminum, on the other hand, remains quite free-electron like up to 50 GPa. Both behaviors are clearly reflected in the pressure evolution of the rigidity factor of both density and potential: it decreases by a factor of 3-4 in Li but stays almost constant in Al. Moreover, the rigidity of the potential is approximately one order of magnitude bigger than for the density. This rigidity supports the picture of a rigid potential shift with displacement in both Li and Al. In general, the rigidity factor may become a useful tool for quantifying a “generalized covalency” of a system, even in the case of metals.
By kubic harmonic decomposition of the rigid enatom, we have shown that in Li and Al the potentials are effectively spherical, providing support for spherical approximations in rigid-atom models of electron-phonon coupling. Non-spherical contributions in the rigid density become larger as Li becomes more covalent under pressure, and non-rigid contributions to the potential increase somewhat in Li. Changes in aluminum are much smaller.
The basic features of the spherical part of the rigid density and potential can be understood by means of linear screening theory (and could be calculated in that way). First, the localization of the rigid enatom potential is a result of free electron-like (Thomas-Fermi) screening, showing that the mean radius of Al is smaller than the one of Li. Second, the tails of the rigid densities exhibit rapidly decaying Friedel oscillations.
Another finding is that the rigid enatom density is more localized than the density of an isolated atom. This is a result of two effects. (i) The density in the tail region is screened in the solid, making the effective potential more short ranged and causing charge to move inward. (ii) There is also charge that moves outwards from the core region induced by the potential being less deep than in the free atom. The second effect is small compared to the first. The same two effects also cause an increase of localization of the rigid enatom density when the pressure is increased.
These calculations reveal the manner in which the deformation part of the enatom reflects the symmetry of the lattice and undergoes a pressure evolution, which is quite significant in Li but small in Al. The basic morphological features of the deformation parts are the same in Al and in Li and also in the density and in the potential but their position, sign and relative magnitude is different. This behavior confirms the expectation that lattice symmetry is paramount in determining the character of the deformation of the enatom, at least in nearly free electron metals.
The enatom potential is exactly the quantity that determines electron-phonon matrix elements, and it is for the electron-phonon problem that we foresee the important applications of enatom quantities (see Sec. I.A and I.B). The numerical procedure presented here thereby provides a viable means to an improved understanding of electron-phonon coupling, based on a real space picture. Furthermore, the rigidity factor could be a useful tool to quantify a “generalized covalency” of a system, even in the case of metals. Applications to strongly coupled elemental metals and compounds will be presented elsewhere.
V Acknowledgments
The authors thank O. K. Andersen for ideas and encouragement. J.K. gratefully acknowledges support from the International Max Planck Research School for Advanced Materials (IMPRS-AM). W.E.P. was supported partially by National Science Foundation grant No. DMR-0421810, and is grateful for support from the Alexander von Humboldt Foundation.
References
- (1) Often ascribed to Democritus, ca. 430 B.C.
- (2) See, for example, C. Bailey, The Greek Atomists and Epicurus (Clarendon, Oxford, 1928).
- (3) J. M. Ziman, Adv. Phys. 13, 89 (1964).
- (4) L. Dagens, J. Phys. C 5, 2333 (1972).
- (5) P. Streitenberger, phys. stat. sol (b) 116, 179 (1983).
- (6) M. A. Ball, J. Phys. C 8, 3328 (1975).
- (7) M. A. Ball, J. Phys. C 10, 4921 (1977).
- (8) W. E. Pickett, J. Phys. C 12, 1491 (1979).
- (9) F. S. Khan and P. B. Allen, Phys. Rev. B 29, 3341 (1984).
- (10) J. E. Moussa and M. L. Cohen, Phys. Rev. B 74, 094520 (2006).
- (11) L. J. Sham, Phys. Rev. 188, 1431 (1969).
- (12) R. M. Martin, Phys. Rev. B 5, 1607 (1972).
- (13) C. Falter, W. Ludwig, A. A. Maradudin, M. Selmke, and W. Zierau, Phys. Rev. B 32, 6510 (1985); C. Falter, M. Selmke, W. Ludwig, and K. Kunc, Phys. Rev. B 32, 6518 (1985).
- (14) C. Falter, H. Rakel, M. Klenner, and W. Ludwig, Phys. Rev. B 40, 7727 (1989).
- (15) M. A. Ball and G. P. Srivastava, J. Phys.: Condens. Matt. 4, 1947 (1992); ibid. 5, 2511 (1993).
- (16) K. M. Lang, A. Mizel, J. Mortara, E. Hudson, J. Hone, M. L. Cohen, A. Zettl, and J. C. Davis, J. Low Temp. Phys. 114, 445 (1999).
- (17) K. Shimizu, H. Ishikawa, D. Takao, T. Yagi, and K. Amaya, Nature 419, 597 (2002).
- (18) V. V. Struzhkin, M. I. Eremets, W. Gan, H.-K. Mao, and R. J. Hemley, Science 298, 1213 (2002).
- (19) S. Deemyad and J. S. Schilling, Phys. Rev. Lett. 91, 167001 (2003).
- (20) J. J. Hamlin, V. G. Tissen, and J. S. Schilling, Phys. Rev. B 73, 094522 (2006).
- (21) T. Yabuuchi, T. Matsuoka, Y. Nakamoto, and K. Shimizu, J. Phys. Soc. Japan 75, 083703 (2006).
- (22) K. Syassen and W. B. Holzapfel, J. Appl. Phys. 49, 4427 (1978).
- (23) L. Shi and D. A. Papaconstantopoulos, Phys. Rev. B 73, 184516 (2006).
- (24) N. E. Christensen and D. L. Novikov, Phys. Rev. B 73, 224508 (2006).
- (25) G. Profeta, C. Franchini, N. N. Lathiotakis, A. Floris, A. Sanna, M. A. L. Marques, M. Luders, S. Massidda, E. K. U. Gross, and A. Continenza, Phys. Rev. Lett. 96, 047003 (2006).
- (26) D. Kasinathan, J. Kuneš, A. Lazicki, H. Rosner, C. S. Yoo, R. T. Scalettar, and W. E. Pickett, Phys. Rev. Lett. 96, 047004 (2006).
- (27) D. Kasinathan, K. Koepernik, J. Kunes, H. Rosner, and W.E. Pickett, cond-mat/0606537 (to be published).
- (28) S. U. Maheswari, H. Nagara, K. Kusakabe, and N. Suzuki, J. Phys. Soc. Japan 74, 3227 (2005).
- (29) D. U. Gubser and A. W. Webb, Phys. Rev. Lett. 35, 104 (1975).
- (30) Y. Akahama, M. Nishimura, K. Kinoshita, and H. Kawamura,Y. Ohishi Phys. Rev. Lett. 96, 045505 (2006).
- (31) M. Hanfland, K. Syassen, N. E. Christensen, and D. L. Novikov Nature 408, 174 (2000).
- (32) S. Baroni, A. Dal Corso, S. de Gironcoli, P. Giannozzi, C. Cavazzoni, G. Ballabio, S. Scandolo, G. Chiarotti, P. Focher, A. Pasquarello, et al. URL http://www.pwscf.org.
- (33) N. Troullier, J. L. Martins, Phys. Rev. B, 43, 1993, (1991).
- (34) H. J. Monkhorst, J. D. Pack, Phys. Rev. B, 13, 5188, (1976).
- (35) N. Marzari, D. Vanderbilt, A. De Vita, M. C. Payne, Phys. Rev. Lett., 82, 3296, (1999).
- (36) G. D. Gaspari and B. L. Gyorffy, Phys. Rev. Lett. 28, 801 (1972).
- (37) F. C. von der Lage and H. A. Bethe, Phys. Rev. 71, 612 (1947).
- (38) K. K. Lehmann and C. Callegan, J. Chem. Phys. 117, 1595 (2002).
- (39) O.K. Andersen, H.L. Skriver, H. Nohl, B. Johansson, Pure and Appl. Chemistry 52, 93 (1979).
- (40) See EPAPS Document No. E-PRBMDO-75-090703 for several color figures showing examples of enatom quantities for Li in 3D and 2D views. For more information on EPAPS, see http://www.aip.org/pubservs/epaps.html.