Percolation theory applied to measures of fragmentation in social networks
Abstract
We apply percolation theory to a recently proposed measure of fragmentation for social networks. The measure is defined as the ratio between the number of pairs of nodes that are not connected in the fragmented network after removing a fraction of nodes and the total number of pairs in the original fully connected network. We compare with the traditional measure used in percolation theory, , the fraction of nodes in the largest cluster relative to the total number of nodes. Using both analytical and numerical methods from percolation, we study Erdős-Rényi (ER) and scale-free (SF) networks under various types of node removal strategies. The removal strategies are: random removal, high degree removal and high betweenness centrality removal. We find that for a network obtained after removal (all strategies) of a fraction of nodes above percolation threshold, . For fixed and close to percolation threshold (), we show that better reflects the actual fragmentation. Close to , for a given , has a broad distribution and it is thus possible to improve the fragmentation of the network. We also study and compare the fragmentation measure and the percolation measure for a real social network of workplaces linked by the households of the employees and find similar results.
I Introduction
Many physical, sociological and biological systems are represented by complex networks paul ; pastor2 ; doro ; bocca ; albert ; cohen ; newman ; cohen2 ; paxon ; callaway ; valente ; gerry ; chung ; burda ; song ; freeman ; wasserman . One of the important problems in complex networks is the fragmentation of networks cohen ; callaway ; cohen2 ; valente ; gerry ; chung ; burda . In this problem one studies the statistical properties of the fragmented networks after removing nodes (or links) from the original fully connected network using a certain strategy. Many different removal strategies have been developed for various purposes, e.g., mimicking the real world network failures, improving the effectiveness of network disintegration, etc. Examples include random removal (RR) strategy, the high degree removal (HDR) strategy and the high betweenness centrality removal strategy (HBR) valente ; tanizawa ; pastor ; holme ; newman0 . Note that the best strategy for fragmentation (minimum nodes removal) is also the best for immunization since it represent the minimum number of nodes or links needed to be immunized so that epidemic cannot spread in the network.
Recently, a new measure of fragmentation has been developed in social network studies borgatti . Given a fully connected network of nodes which is fragmented into separate clusters footnote by removing nodes following a certain strategy. We define the concentration of nodes removed and the concentration of existing nodes. The degree of fragmentation of the network is defined as the ratio between the number of pairs of nodes that are not connected in the fragmented network and the total number of pairs in the original fully connected network. Suppose that after removal there are clusters in the fragmented network, since all members of a cluster are, by definition, mutually reachable, the measure can be written as follows borgatti
| (1) |
Here, is the number of nodes in cluster , is number of clusters in the fragmented network, and the number of nodes in the original fully connected network. For an undamaged network, . For a totally fragmented network, . The quantity defined in Eq. (1) can be regarded as the “connectivity” of the network. When the network is fully connected while for it is fully fragmented.
In this paper, we study the statistical behavior of using both analytical and numerical methods and relate it to the traditional measure of fragmentation, the relative size of the largest cluster, , used in percolation theory. In this way, we are able to obtain analytical results for the fragmentation of networks. We study three removal strategies: the random removal (RR) strategy which removes randomly selected nodes, the high degree removal (HDR) strategy which targets and removes nodes with highest degree and the high betweenness centrality removal (HBR) strategy which targets and removes nodes with highest betweenness centrality. The HDR (or HBR) strategies first removes the node with the highest degree (or the highest betweenness centrality), and then the second highest and so on. These three strategies are commonly used in models representing random and targeted attacks in real world networks albert ; callaway ; cohen ; cohen2 ; holme .
II Theory
Traditionally, in analogy to percolation, physicists describe the connectivity of a fragmented network by the ratio (called the incipient order parameter) between the largest cluster size (called the infinite cluster) and . Many properties have been derived for this measure dietrich ; cohen ; 11a . For example, in random networks, undergoes a second order phase transition at a threshold . Below , is zero for , while for , is finite. This occurs for both RR and HDR in random networks and lattice networks cohen ; callaway ; cohen2 ; 11a ; dietrich . The threshold parameter depends on the degree distribution, the network topology, and the removal strategy callaway ; cohen ; cohen2 ; dietrich ; 11a . The specific way that approaches zero at depends on the network topology and removal strategy but not on details such as . In scale free networks, where the degree distribution and , it has been found that for RR strategy cohen while is very high for HDR strategy callaway ; cohen2 and for HBR strategy holme . For and RR, is finite.
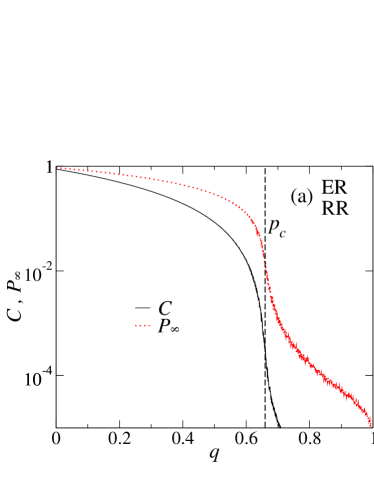
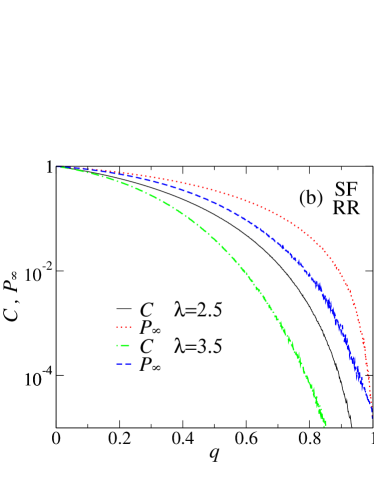
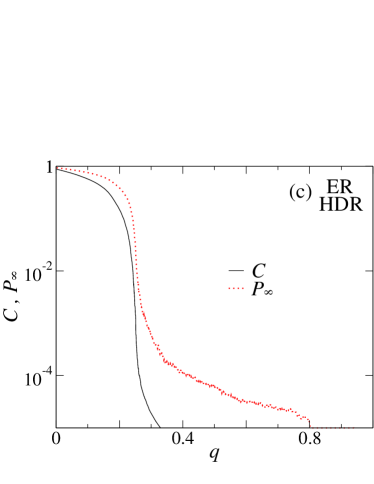
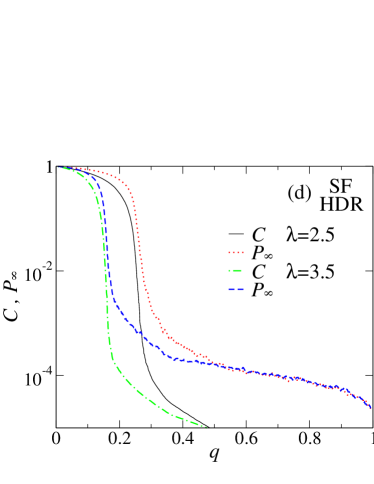
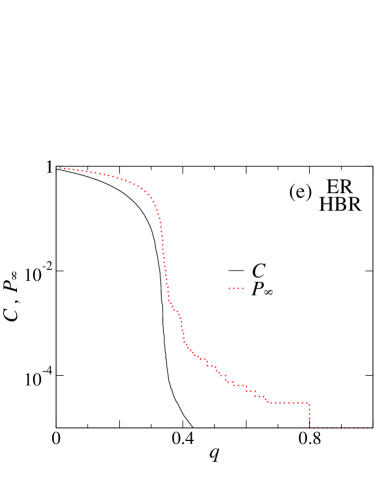
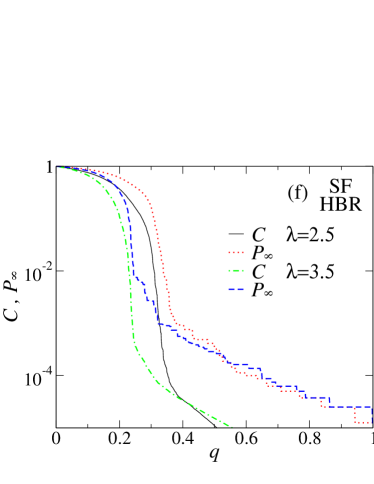
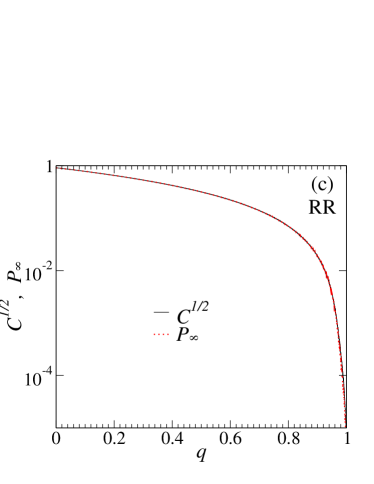
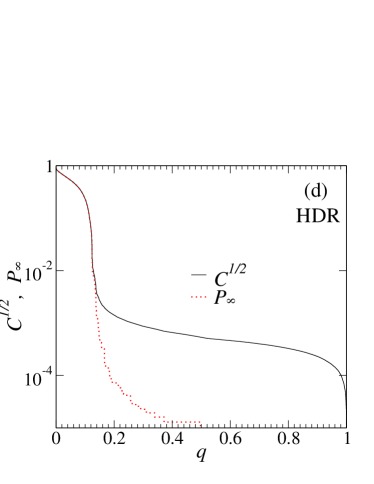
Next, we show simulation results of removing nodes in all strategies (RR, HDR and HBR) on ER and scale free networks. Fig. 1 shows the behavior of () and versus for Erdős-Rényi (ER) and scale-free (SF) networks with RR (Fig. 1(a),(b)), HDR (Fig. 1(c),(d)) and HBR (Fig. 1(e),(f)) strategies. As seen in Fig. 1(a), the network becomes more fragmented when increases and both measures drop sharply at . Note that shows a transition similar to at ; however, above , becomes more flat in contrast to , indicating the effect of connectivity in the small clusters which do not effect .
In contrast to Fig. 1(a), the transition in Fig. 1(b) is not as sharp and therefore and do not show a collapse together. The reason is that for there is no transition at cohen and for , falls much less sharply compared to ER cohen3 . For HDR shown in Figs. 1(c),(d), the transition is again sharp since after removing high degree nodes, the network becomes similar to ER networks, which do not have high degree nodes cohen2 . A similar behavior is seen for HBR shown in Figs. 1(e),(f) due to the known high correlation between high degree nodes and high betweenness centrality nodes holme .
When and not too close to , following percolation theory, the infinite cluster dominates the system and , i.e. most of unremoved nodes are connected. Thus, we assume that the small clusters will have a small effect on compared to the largest one. Using this assumption, Eq. (1) can be written as
| (2) |
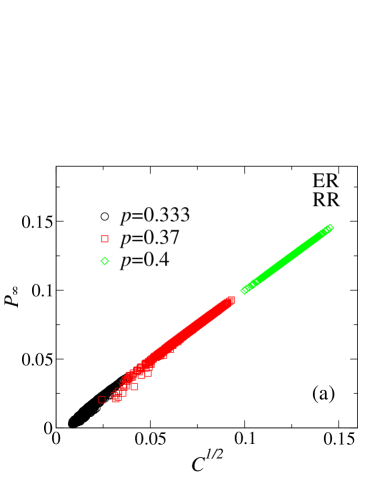
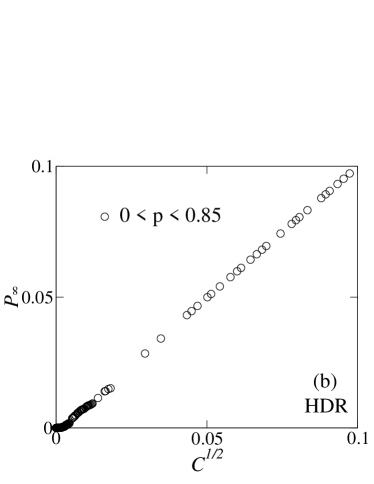
Therefore, we expect and have the relationship when (but not too close to ). When , the infinite cluster loses its dominance in the system and for large cohen2 . Here significant variations between and are expected, as indeed seen in Fig. 2.
III Simulations
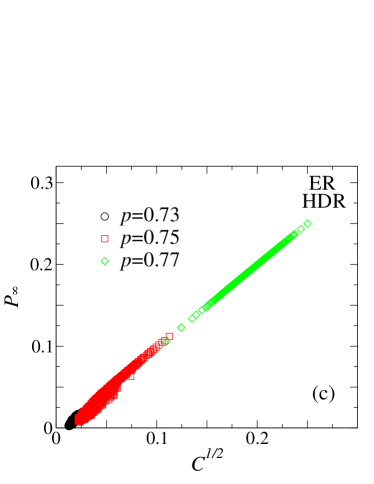
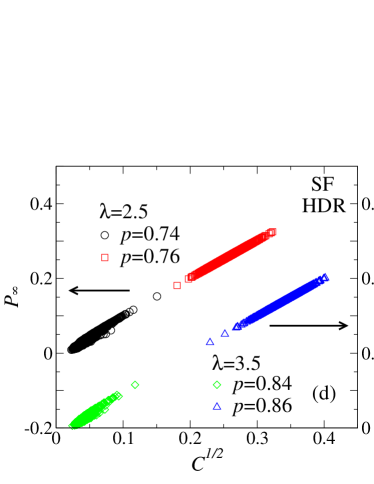
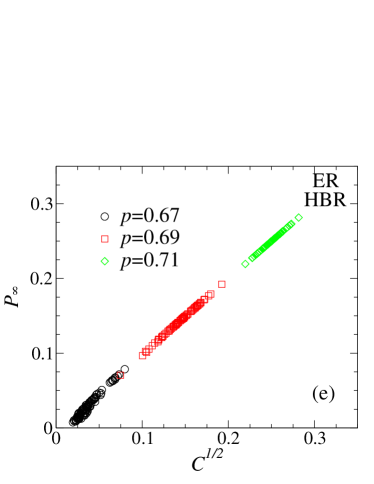
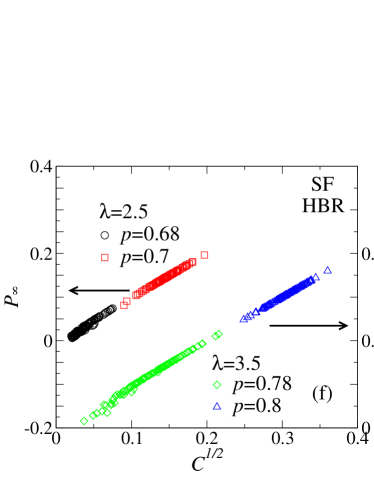
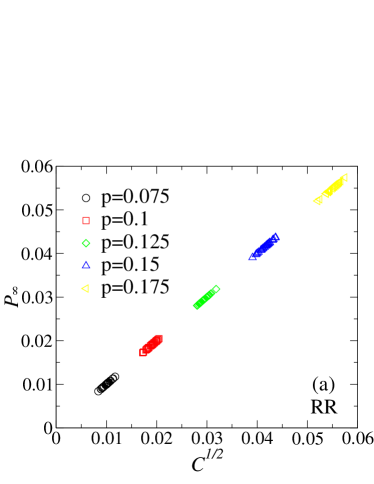
We test by simulations the relationship derived for in Eq. (2). In Fig. 2(a) we plot vs for RR strategy in ER networks and for several values of . As predicted by Eq. (2), the plot of vs yields a linear relationship with slope equal to when . The range of and for is due to the variation of for a given and the same variation appears for showing that the infinite cluster dominates and Eq. (2) is valid. However, when drops close to , the system approaches criticality and the one-to-one correspondence between and is not as strong. This variation is attributed to the presence of clusters other than the infinite one, which influence but not .
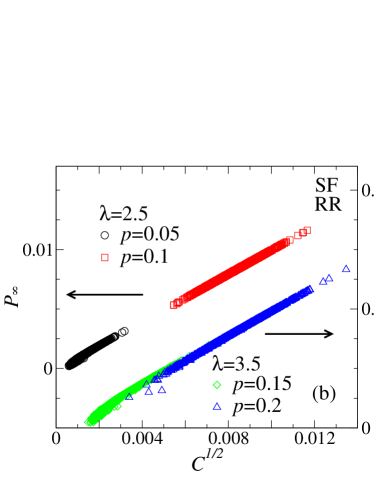
Similar behavior is observed for RR strategy in SF networks with shown in Fig. 2(b). For , the variation in emerge close to . However, for , percolation theory suggests that approaches for large systems. As a result, no significant variation is observed even when is as small as . This observation supports that the SF networks with are quite robust in sustaining its infinite cluster against random removal cohen . Figs. 2(c), 2(d),2(e) and 2(f) show the results for HDR and HBR strategies in ER and SF networks. For these targeted strategies, the variation of and shows up at significantly higher compared to the random case, indicating that the infinite cluster breaks down easier under HDR and HBR attacks for both ER and SF networks, as seen also in Fig. 1. At this point, the SF network with becomes no longer as robust as in the random case, as can be clearly observed in the large variation at .
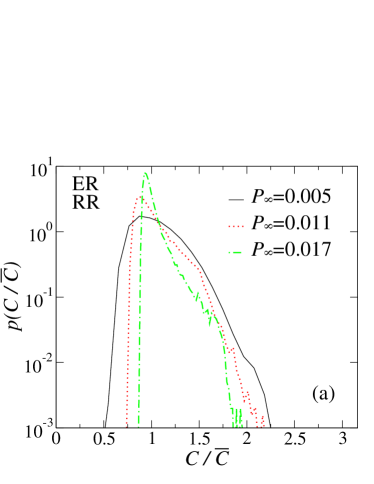
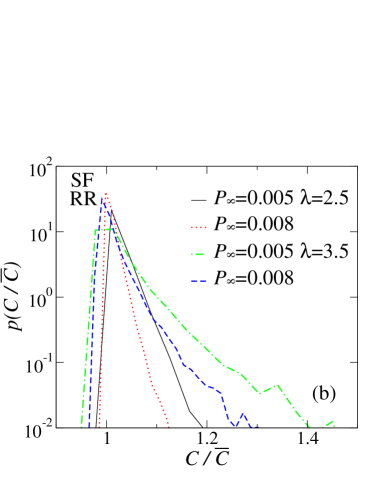
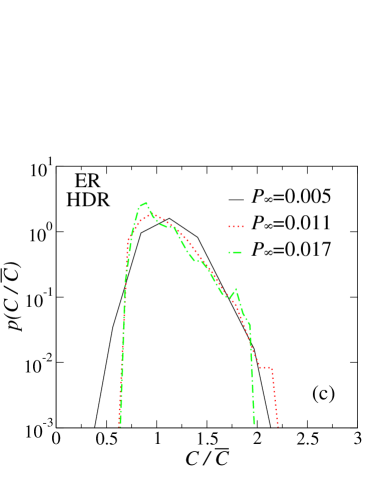
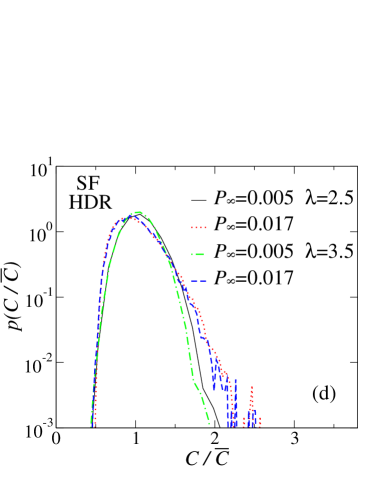
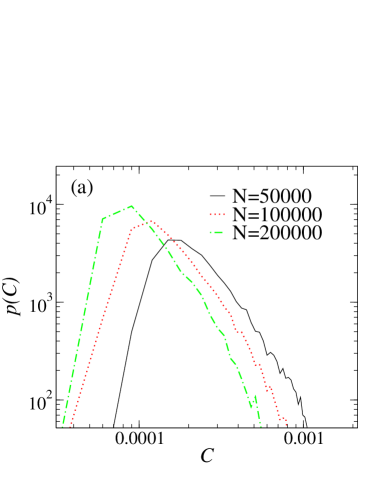
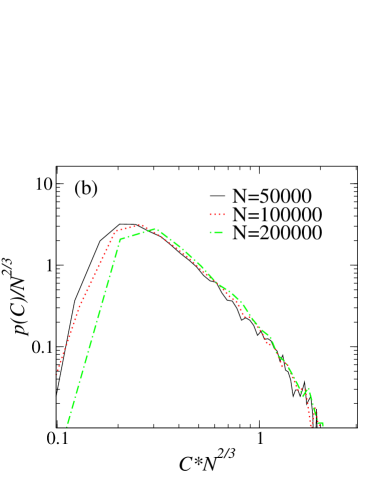
To further investigate the characteristics of the variation of for a given , we calculate the probability distributions versus for a given where is the average value of and the results are plotted in Fig. 3. In this case, , the most probable value of , is determined by the fixed infinite cluster size with , and the broadness of comes from presence of clusters other than the infinite one. Because the largest cluster size is fixed, the upper cutoff of emerges due to the limitation on the sizes of other clusters that by definition must be smaller than the largest cluster. For the RR strategy, the broadness of for ER network is bigger than that of SF networks at the same , especially for where the system is always high above criticality and the variation is relatively small. On the contrary, for the HDR and HBR strategies, the broadness of for ER and SF networks are of the same order due to the fact that for HDR and HBR, is also finite for . This observation is consistent with the results shown in Fig. 2.
Now we focus on the dependence of on the system size at (Fig. 4). From percolation theory and for ER under RR strategy, the infinite cluster size at criticality behaves as erdos ; cohen4
| (3) |
Since follows similar behavior as at criticality, we expect for to behave as,
| (4) |
Thus, we expect the probability distribution with to scale as
| (5) |
where is a scaling function.
IV Real networks
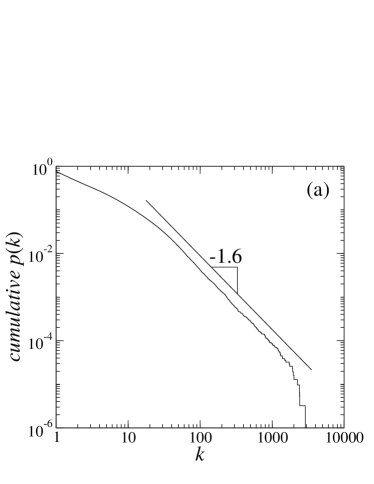
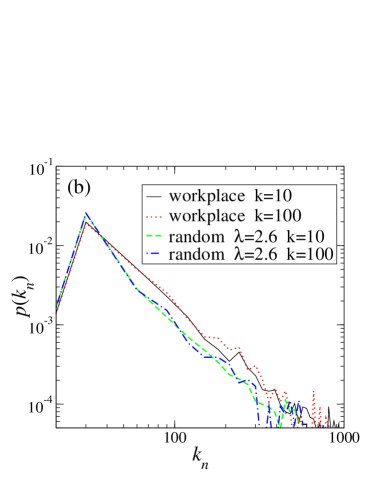
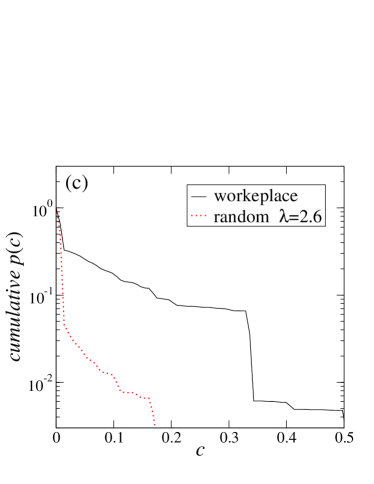
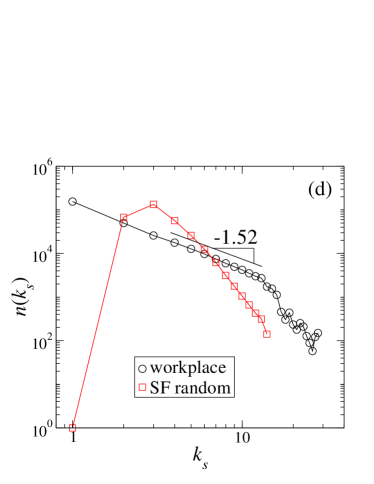
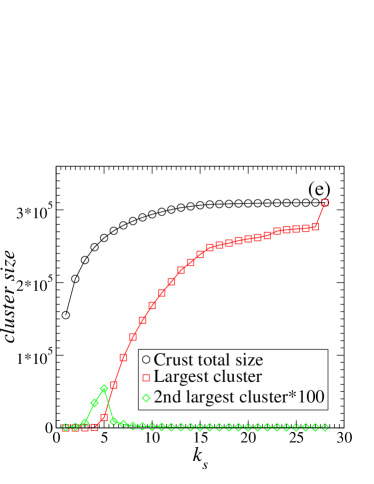
The ER networks and the SF networks that we have been studying are random ensemble of networks which are only determined by their degree distribution. It is known that many real networks often exhibit important structural properties relevant for percolation properties such as high level of clustering, assortativity and fractality that random networks do not exhibit song ; newman2 . We therefore test our results about the relation between and on an example of a large real social network. The network we use is extracted from a data set obtained from Statistics Sweden scb and consists of all geographical workplaces in Sweden that can be linked with each other by having at least one employee from each workplace sharing the same household. Household is defined as a married couple or a couple having kids together that are living in the same flat or house. Unmarried couples without kids and other individuals sharing household are not registered in the dataset as households. This kind of network have been shown to be of importance for the spreading of Influenza viboud and are also likely to be important for spreading of information and rumors in society. The network consists of nodes (workplaces) and links (employees sharing the same households) and, as shown in Fig. 5(a), is approximately a SF network with and an exponential cut off. The network shows almost no degree-degree correlation (assortativity) (Fig. 5(b)). However, the workplace network clustering coefficient is significantly higher than that of a random SF network with same and (Fig. 5(c)). The average of is for the workplace network versus for the random SF networks, which is consistent with the earlier social network studies gabor ; konstantin . Fig. 5(d) shows the node distribution of k-shell () in the network compared to that of a random SF network with same and shai . It is seen that in the workplace network there exist significantly more shells and the large shells are more occupied compared to random SF. The distribution shows a power-law behavior with slope . This indicates the structure of this real network. Fig. 5(e) shows the crust total size, the largest cluster size and the second largest cluster size as a function of shell . It is seen that the largest cluster has two transitions. One around and the other at . At , the largest cluster increase from zero to a finite fraction of the network. This transition is related to the HDR seen in Fig. 6(d) (see also cohen2 ). The second transition at defines the nucleus of the workplace network which include about 100 nodes (see Fig. 5(d), ) which are well connected to each other. The jump of the largest cluster from to from nodes to nodes (i.e. nodes) is due to nodes which are connected only to the nucleus. These nodes are called dendrites. Fig. 5(e) is very similar to the Medusa model shai suggested for the AS topology of the Internet. Figs. 6(a) and 6(b) show simulation results for several values of for vs . The curves are linear, similar to Fig. 2 for our model networks. Moreover, Figs. 6(c) and (d) show that and are almost identical above the criticality threshold for a typical configuration after both RR and HDR. For below criticality, differences appear which are especially obvious for HDR strategy where is relatively small. While rapidly decreases to a very small value (below ), a plateau shows up in the curve of due to the influence of the small clusters.
V Summary
In summary, we study the measure for fragmentation proposed in social sciences and relate it to the traditional used in physics in percolation theory. For above criticality, and are highly correlated and . Close to criticality, for and below , variations between and emerge due to the presence of the small clusters. For systems close or below criticality, gives better measure for fragmentation of the whole system compared to . We study the probability distribution for a given and find that at obeys the scaling relationship for both RR strategy on ER network, and for HDR on scale free networks.
We thank ONR, European NEST project DYSONET, and Israel Science Foundation for financial support.
The study was approved by the Regional Ethical Review board in Stockholm (record 2004/2:9).
References
- (1) R. Albert, H. Jeong, and A.-L. Barabási, Nature London 406, 378 (2000).
- (2) R. Pastor-Satorras and A. Vespignani, Evolution and Structure of the Internet: A Statistical Physics Approach (Cambridge University Press, Cambridge, England, 2004).
- (3) S.N. Dorogovtsev and J.F.F. Mendes, Evolution of Networks: From Biological Nets to the Internet and WWW (Oxford University Press, Oxford, 2003).
- (4) S. Boccaletti, V. Latora, Y. Moreno, M. Chavez, D.-U. Hwang, Physics Reports 424, 175 (2006).
- (5) V. Paxon, IEEE/ACM Trans. Networking 5, 601 (1997).
- (6) R. Cohen, K. Erez, D.ben-Avraham, and S. Havlin, Phys. Rev. Lett. 85, 4626 (2000).
- (7) D.S. Callaway, M.E.J. Newman, S.H. Strogatz, and D.J. Watts, Phys. Rev. Lett. 85, 5468 (2000).
- (8) R. Cohen, et al., Phys. Rev. Lett. 86, 3682 (2001).
- (9) A.X.C.N. Valente, A. Sarkar, and H.A. Stone, Phys. Rev. Lett. 92, 118702 (2004).
- (10) G. Paul, T. Tanizawa, S. Havlin, and H.E. Stanley, Eur. Phys. J. B 38, 187 (2004).
- (11) F. Chung and L. Lu, Ann. Combinatorics 6, 125 (2002).
- (12) Z. Burda and A. Krzywicki, Phys. Rev. E 67, 046118 (2003).
- (13) C. Song et al. Nature 433, 392 (2005).
- (14) L.C. Freeman, The Development of Social Network Analysis: A Study in the Sociology of Science (Empirical, 2004).
- (15) S. Wasserman, K. Faust, D. Iacobucci, M. Granovetter, Social Network Analysis: Methods and Applications (Cambridge, 1994).
- (16) G. Paul, S. Sreenivasan and H.E. Stanley, Phys. Rev. E 72, 056130 (2005).
- (17) M.E.J. Newman, Phys. Rev. Lett. 89, 208701 (2002).
- (18) T. Tanizawa, G. Paul, R. Cohen, S. Havlin, and H.E. Stanley, Phys. Rev. E 71, 047101 (2005).
- (19) R. Pastor-Satorras and A. Vespignani, Phys. Rev. E 65, 036104 (2002).
- (20) P. Holme, B.J. Kim, C.N. Yoon, and S.K. Han, Phys. Rev. E 65, 056109 (2002).
- (21) M.E.J. Newman and M. Girvan, Phys. Rev. E 69, 026113 (2004).
- (22) S.P. Borgatti, Comp. & Math. Org. Theory 12, 21 (2006).
- (23) Group of connected nodes known as “component” in the language of sociology.
- (24) A. Bunde and S. Havlin, Fractals and Disordered Systems (Springer, 1995).
- (25) D. Stauffer and A. Aharony, Introduction to Percolation Theory (Taylor & Francis, London, 1994).
- (26) R. Cohen, et al., Phys. Rev. E 66, 036113 (2002).
- (27) P. Erdős and A. Rényi, Publ. Math. (Debrecen) 6, 290 (1959).
- (28) R. Cohen, S. Havlin, and D. ben-Avraham, ”Structural properties of scale free networks”, Chap. 4 in Handbook of graphs and networks, Eds. S. Bornholdt and H. G. Schuster (Wiley-VCH, 2002).
- (29) M.E.J. Newman, SIAM Rev. 45, 167 (2003).
- (30) WWW.SCB.SE
- (31) C. Viboud, O.N. Bjørnstad, D.L. Smith, L. Simonsen, M.A. Miller, and B.T. Grenfell, Science 312, 447 (2006).
- (32) G. Csányi and B. Szendrői, Phys. Rev. E 69, 036131 (2004).
- (33) K. Klemm and V.M. Eguíluz, Phys. Rev. E 65, 057102 (2002).
- (34) S. Carmi, S. Havlin, S. Kirkpatrick, Y. Shavitt and E. Shir, cond-mat/0601240 (2006).