Current Address: ]Department of Physics, University of Illinois at Chicago, IL 60607
Evidence for two fluids in the ground state of cuprates
Abstract
We report charge density measurements, using NMR, in the superconducting compound (CaxLa1-x)(Ba1.75-xLa0.25+x)Cu3Oy, which has two independent variables (family) and (oxygen). For underdoped samples we find the rate at which holes are introduced into the plane upon oxygenation to be family-independent. In contrast, not all carriers contribute to either antiferromagnetic or superconducting order parameters. This result is consistent with a two fluid phenomenology or intrinsic mesoscopic inhomogeneities in the bulk. We also discuss the impact of weak-chemical-disorder on .
Proper counting of holes in the cuprates is essential for understanding their properties. Since they have a small ratio of coherence length to mean free path, they are considered clean superconductors where the carrier density is the same as the superconducting carrier density in the zero temperature limit Tallon . In contrast, modern experiments in the superconducting part of the phase diagram consistently find strong inhomogeneities in these materials InhomExp ; KerenSSC03 . Moreover, several theories of cuprate superconductivity are based on two fluids comprised of: hole-poor and hole-rich regions EmeryPhysicaC , bosons and fermions Boson , hot and cooled electrons Pines , etc.. This contradiction leads to the question: do all holes participate in the superconducting order parameter? Addressing this question requires a simultaneous measurement of and . The in-plane 63Cu(2) nuclear quadrupole resonance (NQR) parameter is a direct measure of . can be extracted from the penetration depth. In this work we compare the two numbers for different superconducting families. We find that is not a universal fraction of , and provide a simple relation between and , from parent to overdoped samples. The data support two fluids-based theories for the entire phase diagram, but constrain the possible division between the fluids.
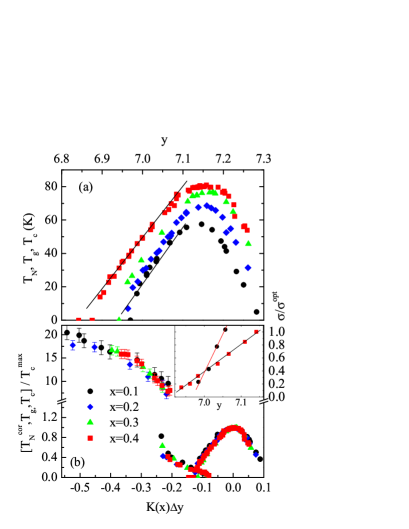
Our study is done on the (CaxLa1-x)(Ba1.75-xLa0.25+x)Cu3Oy (CLBLCO) compound where each value of is a superconducting family with its own maximum () ranging between and K, as shown in Fig. 1(a) OferToBe . By choosing a sample with a particular and oxygen level one can control and independently. This allows determination of the rates at which oxygenation produces carriers and carriers turn superconducting. We evaluate the average form 63Cu(2) nuclear magnetic resonance (NMR) measurements. In passing, we estimate the chemical disorder from the width, , of the distribution. is obtained from previous muon spin rotation (SR) measurements KerenSSC03 ; OferToBe .
The ability of NMR to determine carrier density is based on the fact that 63Cu, with its spin nuclei, is directly coupled to charge degrees of freedom via the electric field gradient (EFG), and is a measure of this coupling. , in turn, depends linearly on the hole density Asayama according to
| (1) |
where and are doping-independent, but, in principle, could be family-dependent. This linear dependence was demonstrated for various compounds such as Y123 Yasuoka , La2-xSrxCuO4 (La) Zheng , and HaBa2CuO4+δ (Ha124) Gippius . Therefore, Eq. 1 and the ability of NMR to detect the in-plane copper [Cu(2)] selectively will allow us to determine the evolution of the in-plane carrier concentration and the width of its distribution.
The measurements were done on powder samples fully enriched with 63Cu. Their preparation is described in Ref. clblco . The oxygen content was measured by double iodometric titration. The accuracy of this method in the enriched CLBLCO is about 0.01. We measured between five and seven different samples for each in the normal state at 100 K. The most overdoped sample is a non superconducting compound. The NMR measurements were done by sweeping the field in a constant applied frequency MHz, using a - echo sequence. The echo signal was averaged times and its area evaluated as a function of field. The full spectrum of the optimally doped sample () is shown in the inset of Fig. 2.
The Cu spin Hamiltonian can be written as Slichter :
| (2) |
where , is a unit vector in the direction of the field, is the shift tensor, and is the asymmetry parameter of the EFG. In the absence of magnetic field, there is only one transition frequency given by , so cannot be separated from , and the use of the magnetic field is essential. This field, applied in the direction and with respect to the principal axis of the EFG, lifts this degeneracy, and three transition frequencies are expected: a center line which corresponds to the transition (), and two satellites which correspond to the () and () transitions. Expressions for up to second order perturbation theory in for completely asymmetric EFG and shift tensors are given in Ref. Taylor . In a powder spectrum, where and are integrated out, each one of the and transitions contributes one peak, and the transition generates two peaks provided that Taylor ; KerenPRB98 . In principle, the bigger is, the further the peaks are away from each other. Similarly, the wider the peaks are, the broader the distribution of . In CLBLCO as in YBCO, the middle peak is from the Cu(1) which has . This peak is labeled in the inset of Fig. 2. The other four peaks are associated with the plane Cu(2) and are labeled .
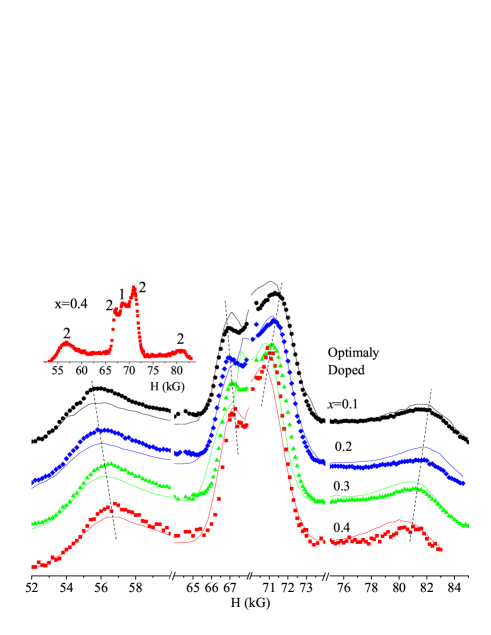
A zoom on the main features of the Cu(2) signal of all four optimally doped samples is depicted in Fig. 2 (note the three axis breakers). The evolution of the main peaks as increases is highlighted by the dotted lines. It is clear that as decreases the peaks move away from each other. This means that at optimal doping is a decreasing function of . A more interesting observation is the fact that there is no change in the width of the peaks, at least not one that can easily be spotted by the naked eye. This means that the distribution of is -independent and that there is no difference in the weak-chemical-disorder (WCD) between the optimally doped samples of the different families. By WCD we mean disorder that is not strong enough to “wipe out” the contribution of the Cu(2) in its vicinity from the spectrum. Thus, WCD is not relevant to the variation of between the different families. As we shall see, this conclusion is supported by more rigorous analysis.
Although we limit our conclusion to WCD, it is important to place a few limitations on the possible existence of strong chemical disorder. The difference in ionic size between La and Ba in the Ba layer creates local lattice distortions. These impact the apical oxygen O(4) position, which contributes to . However a simple calculation based on Eqs. 4 and 5 in Ref. Chmaissem shown that the probability of finding an O(4) out of its ideal place increases with . Therefore, if the O(4) displacement were important for chemical disorder we would have expected the family to have a lower than the , in contrast to observation. In addition, magic angle spinning (MAS) Ca NMR found only one line. This ensures the existence of only one Ca site. Also, since Ca and Ba have the same valance, and the total amount of La is fixed, doping is done only by the chain layer oxygen, which is relatively remote from the CuO2 layer. Therefore, chemical disorder is expected to be minimal. Overall, we cannot find evidence for the existence or importance of strong chemical disorder.
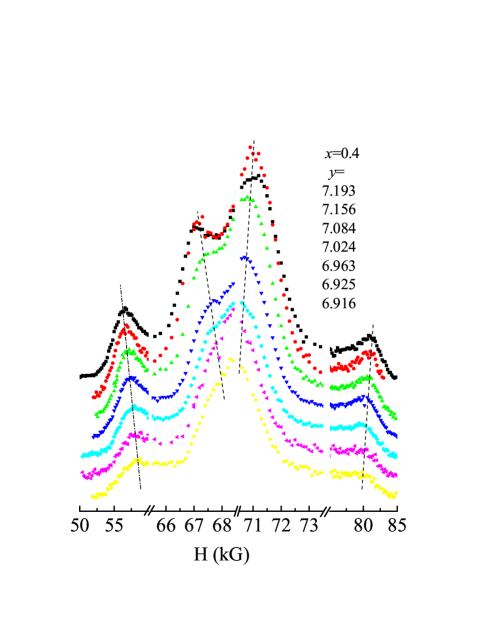
The evolution of the main peaks for as a function of is shown in Fig. 3. Here, as increases the peaks moves away from each other, i.e., increases as a function of doping as expected from Eq. 1. Similar data for the family can be found in Ref. KanigelToBe .
In order to analyze these data more precisely we must fit them to a field-swept powder spectrum which is given by
| (3) |
where is a matrix element. Usually one can extract all the averaged Hamiltonian parameters from the position of the peaks in the spectra KerenPRB98 . However, we are interested in both the parameters and their distribution. Therefore, we must account for the entire line shape. For this purpose we simulate the line by using a grid in the space, calculate the frequency for every , field, and point on the grid, and add 1 to a histogram of when one of the frequencies equals . The matrix elements are taken as unity. This numerical simulation approximates in Eq. 3. To account for the peak widths we assume that the main contribution to this width, of the order of a few MHz, is from a distribution in , since the quadrupole interaction is the only interaction of such magnitude in the system. Consequently, we added to the numerical evaluation of Eq. 3 a loop over values of drawn from a normal distribution with a width . We also added the contribution of the chain site, with . We searched for the best fit to the data by minimization using a simplex code NumericalRec . The result for the optimal doped samples is shown as the solid line in Fig. 2.
The fit is not perfect, mostly because the spectrum is not symmetric. Such an asymmetric spectrum is a result of correlations between different a priory random parameters in the Hamiltonian HasseJS00 . For example, if the shift tensor is also non uniform in the sample but its values are correlated with the values of , the spectrum could be non symmetric. Attempts to take this kind of effect into account failed due to the enormous increase in computing time. We continue the discussion based on the best fit we could practically achieve. For a discussion on the error bars evaluation see Ref. KanigelToBe . We could not determine, , and very accurately, and found very small for all the samples, ranging from 0 to 0.1, in agreement with various estimates for Y123 eta .
The results for fitted and are shown in Fig. 4 (a) and (b), respectively. From Fig. 4(a) it is clear that grows linearly with doping in the underdoped side of the phase diagram, in agreement with other compounds Yasuoka ; Zheng ; Gippius , and Eq. 1. It is also clear that in this equation is -dependent, but this could be attributed to NQR base line properties. In contrast, the behavior in the overdoped side of the is surprising since saturates. As pointed out before in Ref. KanigelToBe , the added holes on the overdoped side no longer go into the planes.
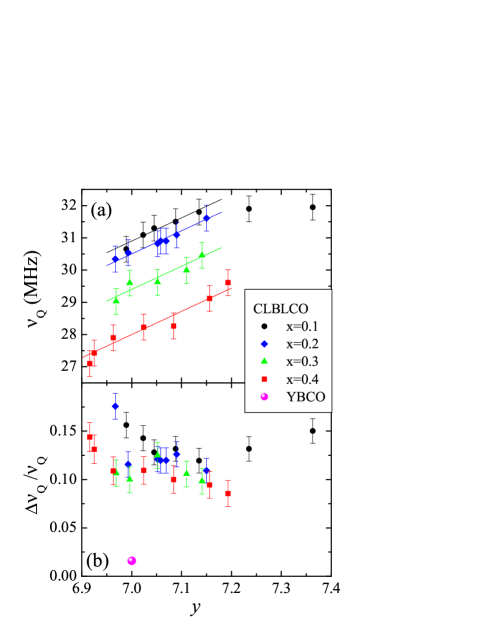
The most interesting finding is that within the experimental error, the slope of in the underdoped side is -independent, as demonstrated by the parallel solid lines, and MHz/Oxygen. This means that the rate at which holes are introduced into the CuO2 planes, , is a constant independent of or in the underdoped region. Using further the ubiquitous assumption that the optimal hole density, , at optimal oxygenation, , is universal, we conclude that is a function only of . This result was predicted previously Chmaissem based on bond valance calculations.
An implication of this conclusion is that the Presland et al. formula PreslanPhysicaC91 could not be correct for CLBLCO. For example, the and samples with have different , and according to our experiment different . However, the Presland formula predicts the same .
If the conversion from oxygen to holes is universal, but different families begin to superconduct at different values (see Fig. 1), it means that the rate at which holes turn into superconducting carriers is family-dependent. To demonstrate this concept further we focus on the region of the CLBLCO phase diagram where grows linearly with doping, as emphasized by the solid lines in Fig. 1(a). This behavior is unique to CLBLCO, which does not show a dip or plateau in . We determine from SR measurement at . The SR relaxation rate is a measure of the density of superconducting carriers, and . In the inset of Fig. 1(b) we depict , taken from Ref. KerenSSC03 , as a function of for two extreme families with and . In this particular region is a constant, which is family-dependent and denoted hereafter by . Using the universality of we find that , which varies between families. This, again, rules out the possibility that in all CLBLCO samples.
In light of previous work a stronger conclusion could in fact be extended to the entire phase diagram of CLBLCO. In Fig. 1(b), taken from Ref. OferToBe , we depict and , normalized by of each family. is the Néel temperature after the contribution from anisotropies have been divided out. The scaled variable , with , , , for the to respectively, collapsed the entire phase diagram into a single function. However, no interpretation was given for . The present experiment suggests that over the entire phase diagram, and that should be considered as carriers participating in both superconducting and antiferromagnetic order parameters.
As for the line width, examination of Fig. 4(b) reassures us of our previous intuition that is not changing between the different families, especially for the optimally doped samples. This becomes obvious when considering of YBCO7 at K, which also has MHz, but MHz OferPRB06 . The changes in between and are minute compared to the changes between and YBCO7. Yet has a very similar to YBCO7. Thus, if YBCO is considered disorder free, the difference in WCD between and either does not exist or is not relevant. The same conclusion was reached by MAS Ca NMR MarchandThesis .
In summary, we find that the rate at which holes are doped into the planes when oxygen is added, , is identical in all families in the superconducting underdoped region. In part of this region, the rate at which holes contribute to the condensate is a family-dependent constant. Based on this and previous findings, we conclude that in CLBLCO not all oxygens contribute holes to the superconducting and antiferromagnetic order parameters. We also show that weak-chemical-disorder, as determined from , is not playing a role in the variations. This reinforces previous conclusions that the changes in between different CLBLCO families is caused only by variation in the in-plane coupling constant OferToBe ; KanigelPRL02 . Finally, since is not changing in the overdoped side as the oxygen level increases, in this side holes are not added to the planes. The open question in this study is which physical or chemical property of CLBLCO sets .
This work was funded by the Israeli Science Foundation. We are grateful to Arkady Knizhnik for his help with the Iodometric titration and to Assa Auerbach for helpful discussions.
References
- (1) J. L. Tallon, J. R. Cooper, S. H. Naqib, and J. W. Loram, Phys. Rev. B 73, 180504(R) (2006).
- (2) A. Keren, A. Kanigel, J. S. Lord, A. Amato, Solid State Commun. 126, 39 (2003). A. Kanigel, A. Keren, A. Knizhnik, O. Shafir, Phys. Rev. B 71, 224511 (2005).
- (3) J. M. Tranquada et al, Nature 375, 561 (1995); Ch. Niedermayer, C. Bernhard, T. Blasius, A. Golnik, A. Moodenbaugh, and J. I. Budnick, Phys. Rev. Lett. 80, 3843 (1998); C. Howald, P. Fournier, and A. Kapitulnik, Phys. Rev. B 64, 100504(R) (2001); S. H. Pan et al., Nature 413, 282 (2001); M. Vershinin et al., Science 303, 1995 (2004).
- (4) V. J. Emery and S. A. Kivelson, Physica C 209, 597 (1993);
- (5) E. Altman and A. Auerbach Phys. Rev. B 65, 104508 (2002); J. Ranninger, J.M. Robin, and M. Eschrig, Phys. Rev. Lett. 74, 4027 (1995); R. Friedberg and T.D. Lee, Phys. Rev. B 40, 6745 (1989).
- (6) D. Pines, cond-mat/0404151.
- (7) R. Ofer et al., cond-mat/0606695.
- (8) K. Asayama et al., Prog. Nuc. Mag. Reso. Spec. 28, 221 (1996).
- (9) H.Yasuoka, in Spectroscopy of Mott Insulator and Correlated Metals, edited by A. Fujimori and Y. Tokura, Solid State Sciences, Vol. 119 (Springer-Verlag, Berlin, 1995), p. 213.
- (10) G.-q. Zheng et al., J. Phys. Soc. Jpn. 64, 2524 (1995).
- (11) A. A. Gippius et al., Physica C 276, 57 (1997).
- (12) D. Goldschmidt, A. Knizhnik, Y. Direktovitch, G. M. Reisner, and Y. Eckstein, Phys. Rev. B 49, 15928 (1994).
- (13) C. P. Slichter, Principles of Magnetic Resonance, Harper and Row, New York, (1963).
- (14) J. F. Baugher, P.C. Taylor, T. Oja and P.J. Bray, J. of Chem. Phys. 50, 4914 (1969).
- (15) A. Keren et al., Phys. Rev. B 57, 10745 (1998).
- (16) S. Marchand, Ph. D. thesis, Universite Paris 6.
- (17) A. Kanigel and A. Keren., cond-mat/0606475.
- (18) O. Chmaissem, Y. Eckstein, C. G. Kuper, Phys. Rev. B 63, 174510 (2001).
- (19) M. R. Preslan et al., Physica C 176, 95 (1991).
- (20) W. H. Press et al. numerical Recipes in C, Cambridge University Press (1988).
- (21) J. Haase, C. P. Slichter, R. Stern, C. T. Milling and D. G. Hinks, J. Supercond. 13, 723 (2000).
- (22) C. H. Pennington, D. J. Durand, D. B. Zax, C. P. Slichter, J. P. Rice, and D. M. Ginsberg, Phys. Rev. B 37, R7944 (1988); T. Shimizu et al., Journal of the Physical Society of Japan, 57, 2494 (1988).
- (23) A. Kanigel et al., Phys. Rev. Lett. 88, 137003 (2002).
- (24) R. Ofer, S. Levy, A. Kanigel, and A. Keren, Phys. Rev. B 73, 012503, (2006).
- (25) E. P. Stoll and P. F. Meier, Private Communication.