Anomalous lattice response at the Mott Transition in a Quasi-2D Organic Conductor
Abstract
Discontinuous changes of the lattice parameters at the Mott metal-insulator transition are detected by high-resolution dilatometry on deuterated crystals of the layered organic conductor -(BEDT-TTF)2Cu[N(CN)2]Br. The uniaxial expansivities uncover a striking and unexpected anisotropy, notably a zero-effect along the in-plane -axis along which the electronic interactions are relatively strong. A huge thermal expansion anomaly is observed near the end-point of the first-order transition line enabling to explore the critical behavior with very high sensitivity. The analysis yields critical fluctuations with an exponent 0.8 0.15 at odds with the novel criticality recently proposed for these materials [Kagawa et al., Nature 436, 534 (2005)]. Our data suggest an intricate role of the lattice degrees of freedom in the Mott transition for the present materials.
pacs:
72.15.Eb, 72.80.-r, 72.80.Le, 74.70.KnThe Mott metal-insulator (MI) transition has been the subject of intensive research for many years, see e.g. Imada 98 for a review. Materials intensively discussed in this context include transition metal oxides, notably Cr-doped V2O3, and, recently, organic -(BEDT-TTF)2X charge-transfer salts Lefebvre 00 ; Limelette 03 ; Fournier 03 ; Kagawa 04 . Here BEDT-TTF (or simply ET) denotes bis(ethylenedithio)tetrathiafulvalene and X a monovalent anion. For the latter substances, pressure studies revealed a first-order metal-insulator transition line Ito 96 ; Lefebvre 00 ; Limelette 03 ; Fournier 03 ; Kagawa 04 , indicative of a bandwidth-controlled Mott transition Kanoda 97a ; Kino 95 , and suggest a second-order critical endpoint Lefebvre 00 ; Limelette 03 ; Fournier 03 ; Kagawa 04 with remarkable properties. Particularly striking was the observation of a pronounced softening of the elastic mode Fournier 03 . Although acoustic and lattice anomalies are expected Hassan 05 ; Merino 00 at the Mott transition in response to the softening of the electronic degrees of freedom, the actual role of the lattice for the Mott transition in real materials remains illusive. In addition, an unconventional Mott criticality was proposed for the present organic salts Kagawa 05 and attributed to their quasi-twodimensional (quasi-2D) electronic character.
In this Letter we report, for the first time, the direct observation of lattice anomalies at the Mott transition in a -(ET)2X organic conductor and explore, via a sensitive thermodynamic probe, the criticality near .
For the thermal expansion measurements, a high-resolution capacitive dilatometer (built after Pott 83 ) was used, enabling the detection of length changes 10-2 Å. Owing to the experimental difficulties posed by accomplishing high-resolution dilatometric measurements under variable pressure, use was made of the possibility of applying chemical pressure. To this end, single crystals of -(d8-ET)2Cu[N(CN)2]Br were synthesized with deuterium atoms replacing the protons in the terminal ethylene groups. These fully deuterated salts, referred to as d8-Br in the following, are known to be situated very close to the MI transition Kawamoto 97 . First, deuterated (98%) ET molecules were prepared according to Hartke 80 ; Mizuno 78 using multiple recrystallization for the intermediate steps. Next, single crystals were synthesized along an alternative preparation route described recently for the protonated variant h8-Br Strack 05 . The grade of deuteration was checked by infrared reflection spectroscopy both on the deuterated ET material Gaertner 91 as well as on the d8-Br single crystals Griesshaber 00 , and found to be at least 98%. For the present study, crystals of two independently prepared batches were used: crystal #1 (batch A2907) and #3 (A2995). The crystals have the shape of flat distorted hexagons with dimensions of about 1 1 0.4 mm3. The pressure exerted on the crystal by the dilatometer ranges from 1 to 6 bar. A preliminary account on a second crystal from batch A2907 was given in Lang 06 . The resistivity was studied by employing a standard four-terminal ac-technique. All measurements, unless stated otherwise, were carried out after cooling through the glass transition at 77 K with a very low rate of -3 K/h (thermal expansion) and -6 K/h (resistivity) to rule out cooling-rate dependent effects, see Mueller 02 .
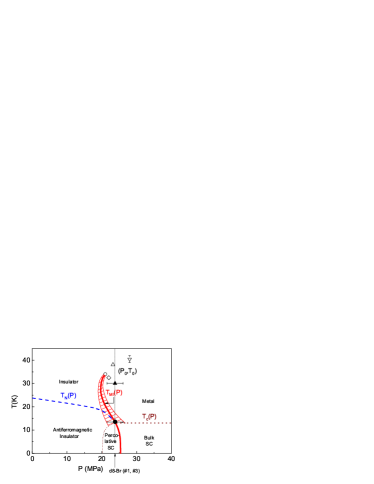
The interlayer resistivity for crystal #1 is shown in the lower part of Fig. 1. Upon cooling, passes over a maximum around 45 K, then rapidly drops and flattens around 30 K. The resistivity remains metallic down to about 20 K, below which the slope sharply increases (cf. upper inset in Fig. 1) indicating the transition into an insulating state. A similar was found for crystal #3 and the crystal studied in Lang 06 including the vanishing of below about 11.5 K. A zero resistivity accompanied by a tiny signature in the data is consistent with percolative superconductivity in a minor metallic phase coexisting with an antiferromagnetic/insulating ground state for d8-Br Miyagawa 02 , cf. the phase diagram in Fig. 3.
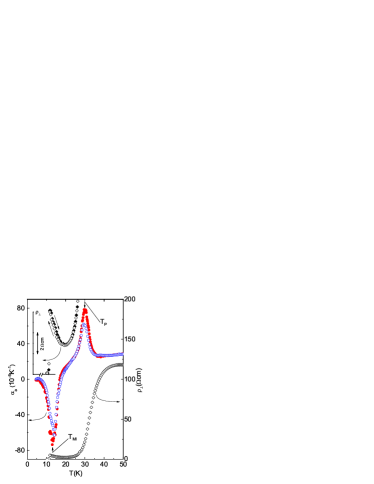
The main features in the resistivity have their clear correspondence in the coefficient of thermal expansion, , also shown in Fig. 1 along the -axis of crystal #1. The flattening of is accompanied by a huge peak in centered at a temperature referred to as in the following around 30 K. As will be discussed below, this effect can be assigned to a second-order phase transition. Upon further cooling, reveals an even bigger negative peak indicating yet another phase transition. The accompanying change in from metallic to insulating behavior suggests this peak to be due to the MI transition. This is consistent with measurements under magnetic fields up to 10 T (not shown) leaving the peak position unaffected. A very similar behavior is observed for #3, although with slightly reduced () peak anomalies and minor shifts in and , cf. Fig. 1. More insight into the character of the transitions can be gained by looking at the relative length changes = - , () shown in Fig. 2 for crystal #1. The dominant effects occur along the in-plane -axis, i.e. parallel to the anion chains. Here a pronounced s-shaped anomaly is revealed at which lacks any sign of hysteresis upon cooling and warming – generic features of a second-order phase transition with strong fluctuations. On further cooling through , the -axis shows a rapid increase of about within a narrow temperature range, indicative of a slightly broadened first-order transition. The observation of a small but significant hysteresis of about 0.4 K (cf. lower inset Fig. 2), which complies with the hysteresis in (upper inset Fig. 1), confirms the first-order character. The corresponding anomalies along the -axis are less strongly pronounced. Surprisingly, for the second in-plane -axis, anomalous behavior in can be discerned neither at nor at . The same anisotropy was found for the second crystal of batch A2907 studied in Lang 06 (not shown), on which all three uniaxial expansion coefficients had been determined.
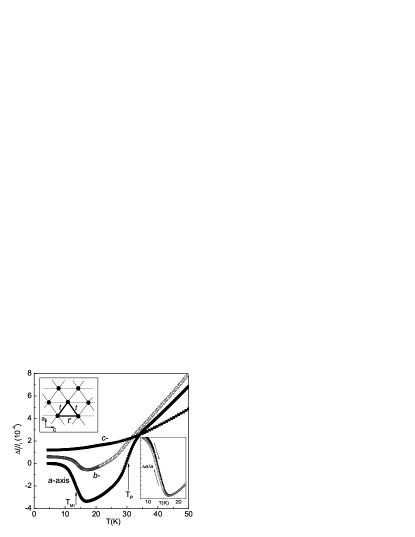
Figure 2 reveals that the anomalies at and are correlated in size, albeit with reversed sign, suggesting that they are intimately related to each other. In addition, the data disclose a striking in-plane anisotropy. Given the quasi-2D electronic structure as shown in the upper inset of Fig. 2, characterized by dimers on an anisotropic triangular lattice Kino 95 , the latter is a very remarkable and unexpected result: The dominant response in the -axis, along which no direct dimer-dimer overlap exists, means that the diagonal electronic interactions along the directions, , have to be involved in this process. Since these interactions have a strong component also along the -axis, which is likely to be even softer than the anion-chain -axis Cu(NCS) , a significant -axis response would be expected at . A zero-effect along the -axis is even more amazing as there is a relatively strong direct dimer-dimer interaction along this axis, cf. upper inset of Fig. 2. Thus, to account for a zero -axis response within a 2D electronic model would imply an accidental cancellation of counteracting effects associated with and , which seems very unlikely. Furthermore, it is not obvious how these in-plane interactions may cause the comparatively strong effect in the interlayer -axis, along which the lattice is expected to be even more stiff Cu(NCS) . These observations suggest that a coupling of the -electrons to other degrees of freedom has to be taken into account to understand the MI transition here.
Before discussing further implications of our observations, the MI-transition temperature is determined. As Fig. 2 demonstrates, the transition is not very sharp but rather spans a range of several Kelvin – an effect which is very similar for both crystals studied here and the one explored in Lang 06 . A broadening of signatures in -dependent measurements, as opposed to isothermal pressure sweeps, would be naturally expected given the steepness of , cf. Fig. 3. However, the width of about 5.6 K of the jump (10-90%), which transforms into a pressure interval of about 2 MPa employing a slope K/MPa around 14 K (cf. Fig. 3), is even smaller than the transition range seen in acoustic measurements as a function of pressure Fournier 03 (cf. hatched area in Fig. 3), but is comparable with a width of about 1.4 MPa as read off the resistivity data in Kagawa 04 . These smearing effects have been attributed to a region of coexistence between insulating and metallic phases Limelette 03 , as indeed observed via real-space imaging Sasaki 05 . For lack of a well-founded procedure to treat the broadened transitions, the position of the minimum is chosen as the thermodynamic transition temperature. Employing literature results on Note1 , the so-derived values of = K, (#1) and K, (#3) can be used to pinpoint the position of the present d8-Br crystals on the pressure axis in Fig. 3. Within the uncertainties implied in this procedure, the crystals are located very close to the critical pressure as determined by the various pressure studies Lefebvre 00 ; Limelette 03 ; Fournier 03 ; Kagawa 04 . The significance of this finding is twofold. First, it demonstrates that the anomaly at reflects the lattice response at . Second, as this point is part of the line, it provides a natural explanation for the intimate interrelation of the anomalies at and inferred from Fig. 2.
The huge anomaly at , exceeding the background by a factor 3-4, enables us to explore the criticality at with extraordinarily high sensitivity. To this end, the phase transition anomaly in , shown for the crystals #1 and #3 in Fig. 4 on expanded scales, is analyzed in terms of a power-law behavior in the variable . This approach is based on the proportionality of to the specific heat, , implying that the same scaling laws apply at , as verified by various groups, see, e.g. Pasler 98 ; Souza 05 .
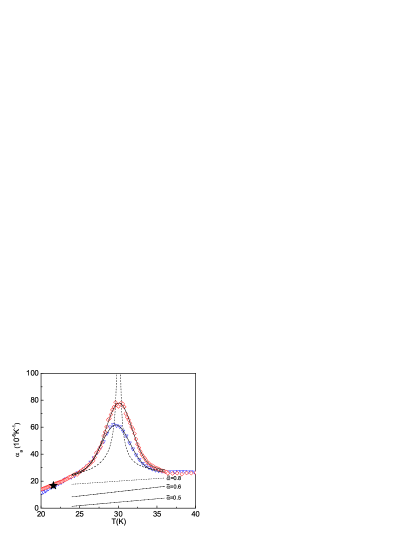
The data sets in Fig. 4 reveal a steep increase in the slope of on the outer flanks of the maximum. Closer to the center of the peak, however, the slope is reduced giving rise to a rounded maximum. Such broadening effects are generally encountered in the immediate vicinity of the transition and attributed to sample inhomogeneities. The rounding over a considerable temperature range here demands particular attention. For the description of the data in the range 24 - 36 K, the function was used. This function contains the singular contribution with the amplitudes and for and , respectively, and a linear term. The latter comes primarily from the phonons but can also include a small non-singular electronic contribution. The smearing of the transition is accounted for by a Gaussian distribution for , , centered at with a width . Applying the function , the data sets of crystal #1 and #3 were fitted simultaneously using the same exponent , the same ratio , and an identical background for both crystals. A constraint for the background contribution can be derived by comparing the data in Fig. 4, with those of the d8-Br in Lang 06 and h8-Br in Mueller 02 . All data sets intersect at a single point 21 K, 16 10-6K-1, irrespective of the presence and size of the critical contribution at , indicating that this point reflects the pure background. Thus a meaningful background should extrapolate to this universal point. A good fit to both data sets, also satisfying this background constraint, is obtained for = 0.8, = 0.79, and = 30.1 K, = 1.59 K for #1 and = 29.6 K, = 1.74 K for #3, cf. Fig. 4. We stress that values in the range 0.65 - 0.95, with small changes in the other parameters accordingly, result in fits of similar quality and still comply with the background constraint. In contrast, the residual of the fit increases substantially upon decreasing to well below 0.65. This is accompanied by a suppression of the background to even negative values for 0.5, clearly incompatible with the background constraint, see, e.g., the background implied in the fits for = 0.6 and 0.5 in Fig. 4. As clearly indicated by these simultaneous fits, and confirmed by independent fits to the individual data sets for crystals #1 and #3, a large positive value is the only possible, physically meaningful description of the expansivity data.
The critical exponent derived here of 0.8 0.15 is much larger than those of known universality classes with -0.12 0.14 and the mean-field value = 0 observed at the Mott critical endpoint of Cr-doped V2O3 Limelette 03a . In particular, it greatly conflicts with the criticality reported in Kagawa 05 for pressurized X = Cu[N(CN)2]Cl. Employing the exponent identity Kadanoff 67 the exponents found there of give = -1. The reason for this discrepancy is unclear but might be related to the significant broadening effects Note2 , which have not been included in the analysis in Kagawa 05 . The exponent found here, however, is rather close to = 0.5 expected for a tricritical point Huang 87 . Such a scenario would imply a symmetry breaking associated with for which no evidence has yet been supplied. Interestingly, an even larger exponent = 0.93 was reported for La0.7Ca0.3MnO3 Souza 05 , also characterized by a strong electron-phonon coupling, showing a similar anomaly as the one observed here.
In summary, high-resolution dilatometry on deuterated -(ET)2Cu[N(CN)2]Br crystals reveals discontinuous changes of the lattice parameters at the Mott transition. The data disclose a striking anisotropy unlikely to be captured by a 2D purely electronic model. An analysis of the huge thermal expansion anomaly at the end-point of the first-order line yields a critical exponent 0.8 0.15, markedly different from the criticality derived from transport measurements Kagawa 05 . The unusually large value together with the anomalous anisotropy of the lattice effects at suggest an intricate role of the lattice in the Mott transition for the present materials.
Acknowledgements.
M. de Souza acknowledges financial support from the Brazilian Research Foundation CAPES and the DAAD.References
- (1) M. Imada et al., Rev. Mod. Phys. , 1039 (1998).
- (2) S. Lefebvre et al., Phys. Rev. Lett. , 5420 (2000).
- (3) P. Limelette et al., Phys. Rev. Lett. , 016401 (2003).
- (4) D. Fournier et al., Phys. Rev. Lett. , 127002 (2003).
- (5) F. Kagawa, et al., Phys. Rev. B , 064511 (2004).
- (6) H. Ito et al., J. Phys. Soc. Jpn. , 2987 (1996).
- (7) K. Kanoda, Hyperfine Interact. , 235 (1997).
- (8) H. Kino et al., J. Phys. Soc. Jpn. , 2726 (1995).
- (9) S.R. Hassan et al., Phys. Rev. Lett. , 036402 (2005).
- (10) J. Merino et al., Phys. Rev. B , 16442 (2000).
- (11) F. Kagawa et al., Nature , 534 (2005).
- (12) R. Pott et al., J. Phys. E , 444 (1983).
- (13) A. Kawamoto et al., Phys. Rev. B , 14140 (1997).
- (14) K. Hartke et al., Chem. Ber. , 1898 (1980).
- (15) M. Mizuno et al., J. Chem. Sci. Commun. , 18 (1978).
- (16) Ch. Strack et al., Phys. Rev. B , 054511 (2005).
- (17) S. Gärtner et al., Synth. Met. , 227 (1991).
- (18) E. Grießhaber, Dissertation, University Stuttgart (2000), unpublished.
- (19) M. Lang et al., Proceedings of the 8th Intern. Conf. on Materials and Mechanisms of Superconductivity - High Temperature Superconductors, Physica C, in press.
- (20) J. Müller et al., Phys. Rev. B , 144521 (2002).
- (21) K. Miyagawa et al., Phys. Rev. Lett. 89, 017003 (2002).
- (22) For the related X = Cu(NCS)2 salt, the uniaxial compressibilities are strongly anisotropic Chasseau 91 with , and = 1 and 2 the in-plane axis perpendicular and parallel to the anion chains, respectively, and = 3 along the long axis of the ET molecules.
- (23) D. Chasseau et al., Synth. Met. , 2039 (1991).
- (24) T. Sasaki et al., Phys. Rev. Lett. , 227001 (2005).
- (25) Due to the finite range of phase coexistence around , the comparison of the thermodynamically determined values here with those derived from transport experiment Lefebvre 00 ; Limelette 03 may cause some ambiguity. We therefore refer to as the mean value (thick solid line in Fig. 3) of acoustic anomalies Fournier 03 .
- (26) V. Pasler et al., Phys. Rev. Lett. 81, 1094 (1998).
- (27) J.A. Souza et al., Phys. Rev. Lett. 94, 207209 (2005).
- (28) P. Limelette et al., Science , 89 (2003).
- (29) L.P. Kadanoff et al., Rev. Mod. Phys. 39, 395 (1967).
- (30) In view of the huge / of approximately 2-3K/MPa, cf. Fig. 3, weak strain fields due to minor sample inhomogeneities can give rise to a broad distribution of values as observed here.
- (31) K. Huang, Statistical Mechanics (Wiley, New York, 1987) 2nd ed., Chap. 17.6.