Self-organized criticality in the intermediate phase of rigidity percolation
Abstract
Experimental results for covalent glasses have highlighted the existence of a new self-organized phase due to the tendency of glass networks to minimize internal stress. Recently, we have shown that an equilibrated self-organized two-dimensional lattice-based model also possesses an intermediate phase in which a percolating rigid cluster exists with a probability between zero and one, depending on the average coordination of the network. In this paper, we study the properties of this intermediate phase in more detail. We find that microscopic perturbations, such as the addition or removal of a single bond, can affect the rigidity of macroscopic regions of the network, in particular, creating or destroying percolation. This, together with a power-law distribution of rigid cluster sizes, suggests that the system is maintained in a critical state on the rigid/floppy boundary throughout the intermediate phase, a behavior similar to self-organized criticality, but, remarkably, in a thermodynamically equilibrated state. The distinction between percolating and non-percolating networks appears physically meaningless, even though the percolating cluster, when it exists, takes up a finite fraction of the network. We point out both similarities and differences between the intermediate phase and the critical point of ordinary percolation models without self-organization. Our results are consistent with an interpretation of recent experiments on the pressure dependence of Raman frequencies in chalcogenide glasses in terms of network homogeneity.
pacs:
05.65.+b, 61.43.Fs, 61.43.Bn, 64.70.PfI Introduction
The concept of rigidity percolation, first introduced about 25 years ago by Thorpe Thorpe (1983) based on work by Phillips Phillips (1979), describes how an elastic network goes from floppy to rigid as constraints are added to it. This theory has been applied with success to many systems, including covalent glasses Thorpe et al. (2000); Boolchand et al. (1999); Thorpe et al. (1999) and proteins Jacobs et al. (2001). In the last decade, however, experimental studies have shown that the rigidity phase diagram could be more complex than initially thought, uncovering the presence of an intermediate phase between the floppy phase and the stressed-rigid phase, with the system in the intermediate phase being rigid but unstressed Boolchand et al. (1999); Selvanathan et al. (2000); Boolchand et al. (2001a, b, 2002a, 2002b); Georgiev et al. (2003); Qu et al. (2003); Vempati and Boolchand (2004); Chakravarty et al. (2005); Černošková et al. (2005); Qu and Boolchand (2005); Wang et al. (2005); Vaills et al. (2005); Lucovsky and Phillips (2004).
A basic explanation for this new phase was first proposed by Thorpe et al. Thorpe et al. (2000). It was shown that when the network self-organizes in order to minimize the stress, the rigid but unstressed intermediate phase can indeed arise.
In the original work by Thorpe and collaborators Thorpe et al. (2000); Thorpe and Chubynsky (2001), as well as subsequent simplified models of chalcogenide glasses by Micoulaut and Phillips Micoulaut (2002); Micoulaut and Phillips (2003), networks were constructed using an “aggregation” process, in which bonds or simple network units were added to the network without subsequent equilibration. More recently, Barré et al. Barré et al. (2005) have considered a thermodynamically proper model with an energy cost associated with stress and showed that in the canonical ensemble, the intermediate phase still exists. In a recent paper, we have confirmed this result for the version of the model of Barré et al., but on a more realistic regular lattice, and also have shown that the intermediate phase is entropically feasible in actual physical systems. In both the model by Barré et al. and our model, the intermediate phase has an unusual property: both percolating and non-percolating networks coexist in the ensemble at all mean coordination numbers within the intermediate phase.
While providing a general support for self-organization, these previous studies did not look in detail at the properties of networks in the intermediate phase. Here we provide a first glimpse at some of these properties. First, we show that in both percolating and non-percolating networks, the sizes of non-percolating clusters have a power-law distribution. In effect, the system remains in a critical state over an extended range of mean coordinations, corresponding to a self-organized critical phase Bak et al. (1988), but in an equilibrium system. Second, we find that adding or removing a single bond affects the rigidity of macroscopic parts of the network in the intermediate phase and in particular, can turn a non-percolating network into a percolating one and vice versa. This property supports the interpretation by Wang and co-workers Wang et al. (2005) of the puzzling response of vibrational frequencies to applied pressure that was observed in their experiments. Using our results, we address some intriguing questions that have to do with the unusual coexistence of percolating and non-percolating networks in the intermediate phase. In particular, we show that percolating and non-percolating networks can be considered identical in the intermediate phase, as both stay on the edge of percolation.
This paper is structured as follows. In the next section, we briefly review the intermediate phase. We then present our methodology. In the fourth section, we present our results on the properties of rigid clusters (both percolating and non-percolating) in our model. In Section V, we look at the response of the network to local perturbations. In Section VI, we discuss how our results can help understand the experiments by Wang et al. Wang et al. (2005). We finish with conclusions.
II The intermediate phase
Using the mean-field approach first introduced by Maxwell Maxwell (1864) and known as Maxwell counting, we can define the rigidity of a network in terms of its number of zero-frequency motions, or floppy modes, . In a -dimensional network, each atom has degrees of freedom. In an unconstrained network of atoms, each degree of freedom corresponds to a floppy mode and thus . Assuming that each added constraint takes away one floppy mode, we can write
| (1) |
where is the number of constraints in the network. As increases, decreases, until is reached, and then there are no floppy modes left and the network undergoes a rigidity transition from floppy to rigid where a percolating rigid cluster emerges in the network (rigid clusters are sets of mutually rigid atoms) Disordered networks can be conveniently characterized by the mean coordination , which is the average number of bonds connecting a site. In the mean-field approximation, the location of the rigidity transition only depends on and not on other details, such as fractions of sites with a particular coordination. The transition occurs at for the triangular lattice of elastic springs and in chalcogenide glasses; in the latter case, it is assumed that both bond-stretching and bond-bending constraints are taken into account.
To go beyond the mean-field theory, corrections must be made. For example, adding a constraint to an already rigid region does not remove a floppy mode. Such type of constraint is called redundant. Redundant constraints introduce stress into the network. Such constraints do not change the number of floppy modes (and thus violate the assumption of the Maxwell counting); taking this into account, Eq. (1) becomes
| (2) |
where is the number of redundant constraints. Another type of correction is due to the fact that even above the rigidity transition there can still be some floppy inclusions and thus at the transition.
To find , Jacobs and co-workers have introduced a topological algorithm, the pebble game Jacobs and Thorpe (1995); Jacobs and Hendrickson (1997). This algorithm is based on a theorem by Laman Laman (1970) which states that in two dimensions a generic network with sites and bonds does not have a redundant bond if and only if no subset of the network containing sites and bonds violates . A similar approach works in 3D, but in general only for bond-bending networks like those used to model chalcogenide glasses.
The pebble game, described in more detail in Ref. Jacobs and Hendrickson (1997), characterizes the global rigidity of a network, provides its complete decomposition into rigid clusters and finds stressed regions. The approach uses only the topology of the network and not its exact geometry. Using the pebble game, it was possible to show that the rigidity transition occurs at 0.001 Jacobs and Thorpe (1995) for the central-force triangular lattice and at Thorpe et al. (2000) for an amorphous bond-bending 3D network.
While early measurements also identified a rigidity transition in these glasses near , recent experiments have shown that there is not one but two transitions Boolchand et al. (1999); Selvanathan et al. (2000); Boolchand et al. (2001a, b, 2002a, 2002b); Georgiev et al. (2003); Qu et al. (2003); Vempati and Boolchand (2004); Chakravarty et al. (2005); Černošková et al. (2005); Qu and Boolchand (2005); Wang et al. (2005); Vaills et al. (2005). Starting at low mean coordination, the first transition seems to go from a floppy to a rigid but unstressed phase, and the second one on to a rigid and stressed phase. This new rigid but unstressed phase is known as the intermediate phase and is believed to be related to the self-organization of the system in order to minimize the stress in the network.
This interpretation is supported by a number of theoretical works. In their pioneering work, Thorpe and collaborators demonstrated that a network constructed by adding bonds with no stress allowed until it becomes inevitable would go through three phases: a floppy, a rigid-unstressed and a rigid-stressed phases Thorpe et al. (2000). The first transition, between the floppy and the rigid-unstressed phases, is the rigidity transition; the second one, between the rigid-unstressed and rigid-stressed phases, is the stress transition and happens immediately when avoiding stress is no longer possible, The intermediate phase survives when the rigid but stress-free networks are fully equilibrated as was demonstrated by Barré and co-workers on Bethe lattices Barré et al. (2005) and Chubynsky et al. Chubynsky et al. (2006) on two-dimensional triangular lattices. This is not the only approach to self-organization, however, and Micoulaut and collaborators Micoulaut (2002); Micoulaut and Phillips (2003) have shown that it is possible to recover an intermediate phase in a stressed network if this stress is localized.
III Methodology
The model we study here is the same as the one used in our previous paper Chubynsky et al. (2006). In our simulations, we use the pebble game algorithm described in the previous section; our computer code is based on the original program by D.J. Jacobs and M.F. Thorpe.
We consider 2D triangular bond-diluted central-force networks. While we cannot make a direct comparison with experiment, previous work has shown that the triangular lattice presents an intermediate phase similar to that of covalent glasses with angular constraints; our results should therefore be applicable, at least qualitatively, to experiments.
In the original model of Thorpe and collaborators Thorpe et al. (2000), bonds were added one by one and each checked for redundancy; redundant (stress-causing) bonds were rejected. Each new added bond was frozen in the network and was never moved nor removed. This procedure does not guarantee that stress-free networks are equiprobable, making some networks more likely than others. To eliminate this bias, we introduced a bond-equilibration scheme, allowing the system to rearrange itself by moving bonds around. Each time a new bond is added, bonds are reshuffled throughout the lattice: a bond is picked at random, removed, and then a new bond is inserted in a random place choosing among those where it would not create stress. This bond-shuffling procedure is repeated until the system is equilibrated. We find that an equilibration of 10 iterations per added bond below =3.5 and 100 iterations above =3.5 is enough for convergence (for more details, see Chubynsky et al. Chubynsky et al. (2006)) and it is the equilibration scheme we use throughout this paper, unless stated otherwise. In equilibrium, all stress-free networks with a given number of bonds (or mean coordination) are equiprobable. This corresponds to the thermodynamic equilibrium at for any model in which all stress-free networks have equal energy, but the energies of stressed networks are higher.
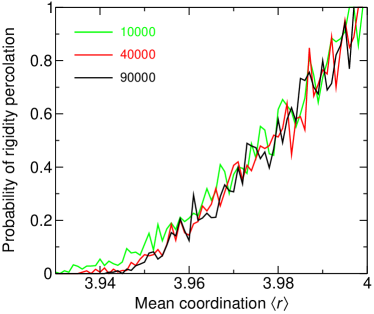
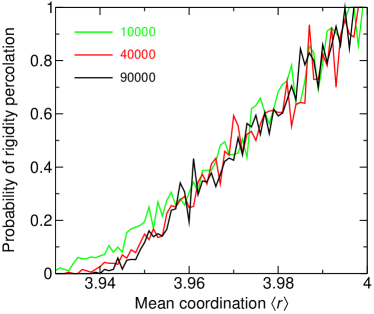
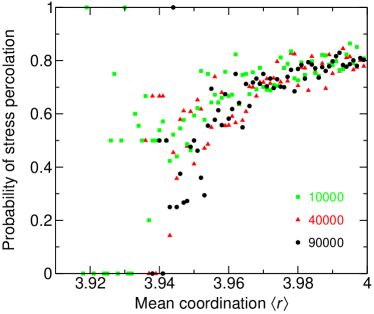
As discussed in our previous paper Chubynsky et al. (2006), the intermediate phase in the model described above is associated with a non-trivial probability of finding a percolating network in this equilibrated model: this probability rises linearly from zero at the rigidity transition () to one at the stress transition (), a result similar to that obtained by Barré et al. on the Bethe lattice Barré et al. (2005). Thus there are both percolating and non-percolating networks and these two classes need to be studied separately.
All results presented in this paper (with the exception of the cluster size distributions given in Fig. 3) are obtained by running 200 independent simulations and obtaining the quantities of interest at different . When overall averages are presented, these are obtained by averaging over all these simulations. When, e.g., an average for percolating networks is presented, then the averaging is done over only those of these networks that are percolating at the given . Obviously, close to the rigidity transition, very few of the 200 networks are percolating, and so the corresponding quantity will be an average over a very small number of realizations and may contain a bigger error. When we report the results of insertion or removal of a single bond, only one attempt of insertion/removal per network is made, unless stated otherwise.
IV Properties of rigid clusters
In this section, we look at properties of rigid clusters (both percolating and non-percolating) that exist in self-organized networks in the intermediate phase. Some properties of rigid clusters that distinguish them from, e.g., clusters in usual connectivity percolation, need to be kept in mind. First, unlike in the connectivity case, a site can belong to more than one cluster (it then serves as a pivot joint between the clusters sharing this site). On the other hand, a bond in 2D always belongs to just one cluster (not so in 3D, when it can serve as a hinge around which several clusters can rotate). For this reason, cluster decomposition in 2D is best expressed in terms of bonds and not sites. While this is not generally so, in the case of self-organized networks in the floppy or intermediate phase, the conversion between cluster sizes expressed in terms of bonds or sites is easy: since there is no stress, there is also no redundancy, and every rigid cluster of sites contains exactly bonds.
We start with properties of the percolating cluster.
IV.1 Definition of a percolating cluster
Normally, when the probability of percolation is either zero or one in the thermodynamic limit, the exact definition of percolation does not matter. In our case, since the probability of finding a percolating cluster increases linearly with average coordination in the intermediate phase, it is not clear that we can be so cavalier.
For example, the probability that a cluster that percolates in only one direction (no matter which one) seems to be non-zero in the intermediate phase, although it is very low, around 0.1 or less. This means that the results will differ slightly if we define percolation using only one direction or both. To avoid confusion, we choose here to call percolating those networks in which percolation occurs in both directions, and non-percolating those networks in which there is no percolation in either direction. Networks with percolation in just one direction are ignored whenever we separate our results into those for percolating networks and those for non-percolating ones, but such networks are taken into account when this separation is not done.
IV.2 Size of the percolating cluster
While we have already studied the probability that a percolating cluster occurs in the intermediate phase, its size had not been characterized. Figure 1 shows the average number of bonds in the percolating cluster as a fraction of bonds actually present in the network. The averaging is done over all networks in which percolation occurs. A remarkable feature is that even at the lowest at which percolation is still (rarely) observed, the size of the percolating cluster is well above zero. The smallest cluster size observed at the onset of the intermediate phase is around 40%. This behavior is different from that for both connectivity and rigidity percolation on regular lattices in the random (non-self-organized) case, where the size of the percolating cluster, considered a good order parameter, grows from zero at the transition, as expected in a second-order transition. This result in the self-organized case is reminiscent of the first-order rigidity transition, such as that observed on Bethe lattices. Moukarzel et al. (1997); Duxbury et al. (1999); Thorpe et al. (1999). However, our other results, as discussed below, do not support this analogy.
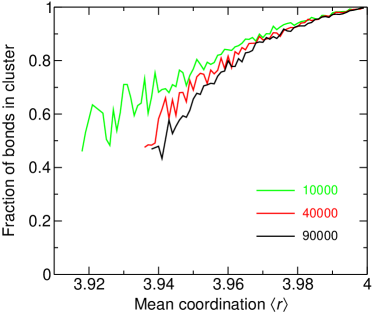
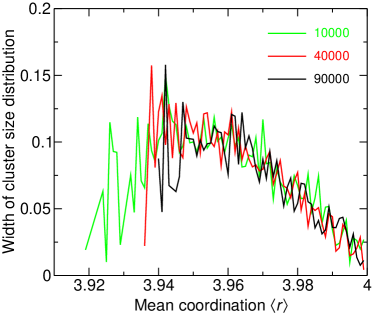
Figure 1 presents average sizes of percolating clusters. Given that the very existence of the percolating cluster is uncertain in the intermediate phase (since only some networks are percolating), it is reasonable to ask about the variation of the percolating cluster size. The quantity we look at is the standard deviation, or width, of the fraction of bonds in the percolating cluster calculated as , where is the fraction of bonds in the percolating cluster, denotes the average over percolating networks and is the number of percolating networks. In ordinary percolation, this width, of course, tends to zero as the network size grows; the percolating cluster size is a self-averaging quantity. Figure 2 shows that this is not so in our case. The width is above zero and is essentially size-independent. This is yet another difference from non-self-organized percolation (including that on Bethe lattices). Note at the same time that the width of the distribution of percolating cluster sizes is much smaller than the average size. In other words, an overwhelming majority of networks have either a big percolating cluster or no percolating cluster at all — there are few (if any) “intermediate cases” with small percolating clusters.
IV.3 Sizes of non-percolating rigid clusters
To further characterize the intermediate phase, it is useful to look at the distribution of rigid cluster sizes. In case of a second-order phase transition, the correlation radius is finite away from the transition. As a result, at a certain cluster size there is a crossover from a power-law behavior to an exponential behavior. The correlation radius diverges as the transition is approached from either side, and so the crossover moves towards bigger sizes as the transition is approached, and exactly at the transition, the power law persists indefinitely. Since the divergence of the correlation radius (or the crossover point) is governed by the same critical exponent on both sides of the transition, it is expected that for two values of at the same distance from the transition but on opposite sides, the crossover points will be the same by order of magnitude, if the transition is second-order. In case of a first-order transition, the correlation radius does not diverge at the transition and there is always a crossover to the exponential behavior.
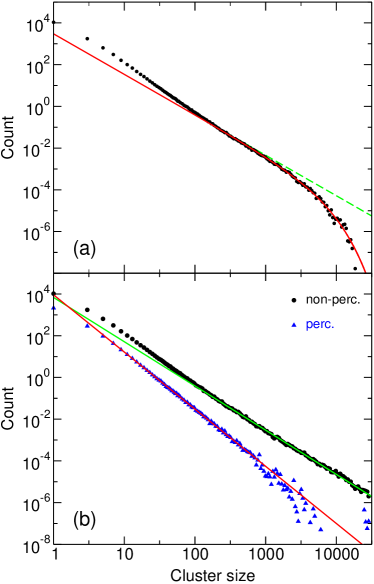
Figure 3 shows the distribution of rigid cluster sizes at the coordinations of (below the transition) and (above the transition). The points are chosen at about the same distance from the rigidity transition, far enough from it to make sure that the correlation radius is not too big (if the transition is second-order) yet not too far to ensure that the points are still within the critical region. All results are obtained by running 200 independent simulations on networks of 40000 sites, each starting from an already equilibrated network and continuing for 1000 additional equilibration steps. After each equilibration step, the distribution of non-percolating cluster sizes is obtained. While networks one equilibration step apart cannot be considered truly independent, inserting or removing a single bond often changes the rigidity of the network very significantly, justifying inclusion of the data obtained at every step. For , the distributions for percolating and non-percolating networks are plotted separately (at , obviously, there are very few percolating networks and we plot the result for non-percolating networks only). To decrease the noise in the tail, all clusters of a given class (i.e., percolating and non-percolating) are binned using a logarithmic scale.
Below the rigidity transition, in the floppy phase [; Fig. 3,(a)], there is a clear crossover between the power-law and exponential behaviors. The data are fitted using the product of a power law and an exponential:
| (3) |
We use the data between and , i.e., dropping just a few data points at the tail, where noise and finite-size effects are significant, and omitting a region at the low end, as there are big deviations from the behavior described by Eq. 3, probably due to discretization effects from the lattice. The best fit is obtained with , and . The dashed line is a power law with the same and , but without the exponential factor.
Above the transition [; Fig. 3,(b)], however, the power-law behavior persists at least for non-percolating networks, with no hint of the exponential tail, even for the largest sizes for which the data are available (around 30000, well above the crossover observed for around ). For percolating nets, there is some deviation from the power law near the end, but it is likely due to finite-size effects (there is a percolating cluster taking up most of the network, so only relatively small non-percolating clusters are possible). To fit the data, we use pure power-law functions:
| (4) |
where subscripts refer to non-percolating and percolating networks, respectively. We use data above in the non-percolating case and from to in the percolating case. The values of the parameters providing the best fits are: , , , . While the difference between and is probably due to finite size and sampling effects, the difference between and suggests that these two quantities are different, an unusual behavior.
Our results indicate that the power-law distribution of cluster sizes is observed in the whole intermediate phase, rather than at a single point (as would be the case without self-organization). In effect, the self-organization, which minimizes the stress in the network, maintains the system in a critical state throughout the intermediate phase. Similarly, unlike in the case of the critical point of random percolation, the cluster size critical exponent appears to be different in the non-percolating and percolating cases.
Based on the results of this section, we see that the rigidity phase transition in our model of self-organized percolation is very different from both first- and second-order phase transitions. The minimization of the stress appears to act similarly to an external driving force, leading to a self-organized critical phase in a thermodynamically equilibrated system.
V Response to a local perturbation
Given that both percolating and non-percolating networks coexist in the intermediate phase, it is interesting to investigate the relation between the two classes. As we show in this section, a local perturbation involving the addition or removal of even a single bond is enough to affect rigidity of huge regions of the network and often converts a non-percolating network into a percolating one and vice versa.
This behavior is not observed in regular random networks: since the probability of percolation in these systems is always either zero or one in the thermodynamic limit, a single bond can only change the percolation property right at the transition. Since a percolating network at that point is fractal and involves only an infinitesimal fraction of bonds, if an infinite cluster is created or destroyed, this can only involve an infinitesimal fraction of bonds and sites; away from the transition, the size of the affected region is always finite and then the fraction is obviously infinitesimally small.
A few general comments about the consequences of addition or removal of a single bond are in order. First of all, the removal of a single bond can only break up the cluster to which this bond belongs; other clusters are not affected. This is because in 2D, all rigid clusters are always rigid by themselves, i.e., they remain rigid when taken in isolation from the rest of the network. Conversely, the addition of a bond can merge several rigid clusters into one, but will not affect the clusters outside the resulting cluster. Note that even though the self-organized networks are by definition stress-free, a newly inserted bond can be redundant and introduce stress (always confined to the cluster in which it is inserted); in this case the configuration of rigid clusters is not affected, but the created stressed region may still be macroscopic and percolate. While we will briefly consider this situation at the end of this section, we mostly concentrate on the case when the inserted bond is non-redundant and thus affects the rigidity of the network but does not create stress. For brevity, we will call the places where insertion of a bond does not create stress, as well as a bond inserted in such a place, allowed. Note that if we add an allowed bond creating a certain rigid cluster and then remove this bond and insert another allowed bond both ends of which are in the region coinciding with the cluster created by the first bond, exactly the same cluster will be created: indeed, the count of constraints within the region will be the same ( for a region of sites), regardless of where in this region the bond is inserted.
V.1 Conversion between percolating and non-percolating networks
We first look at the conversion between non-percolating and percolating networks as a result of bond addition and removal. There are several related questions here.
V.1.1 Addition of a bond in an allowed position
In Fig. 4, we plot the probability that inserting a bond at a randomly chosen allowed place makes a non-percolating network percolating. In the floppy phase (below ), this probability tends to zero in the thermodynamics limit; however, it is non-zero everywhere in the intermediate phase. This probability is close to zero just above the rigidity transition and approaches one close to the upper boundary of the intermediate phase at .
We can also ask about the frequency of networks in which conversion from non-percolating to percolating upon a single bond addition is possible. Note that because of the above-mentioned property that insertion of a bond into a region made rigid by another bond rigidifies exactly the same region, we do not need to try each and every allowed bond, which speeds up the simulation enormously. Fig. 5 plots the fraction of non-percolating networks that can become percolating with a bond placed judiciously in an allowed position. Note that this is different from the previous figure: instead of choosing a place to insert a bond at random, we now make the best effort to cause percolation with a single bond addition, if at all possible. As is expected, this quantity is higher than that plotted in Fig. 4, but the difference is small; over most of the intermediate phase, whenever there are any allowed positions where bond insertion creates a percolating cluster, most allowed positions will do.
It is also interesting to note that the quantity in Fig. 5 is very close to linear in the intermediate phase, and is probably exactly linear, just like the probability of percolation without any bond insertions. In the Appendix, we explain why these two quantities are equal.
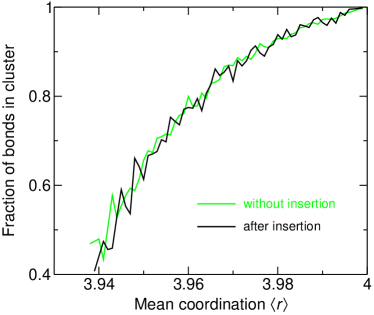
Finally, in Fig. 6, the average size of the percolating cluster arising after bond insertion is compared to the average size of the percolating cluster in those cases when it exists even without bond insertion (i.e., the quantity in Fig. 1). These values are identical: the size of the percolating cluster emerging after inserting a bond in a non-percolating network is the same as in originally percolating networks. This suggests that a percolating network that arises after bond insertion is a typical percolating network, just like those networks that percolate without insertion. In the next subsection, we present more evidence in favor of this. Also see a more detailed discussion of this and a possible caveat in the Appendix to this paper.
Given the significant probability of conversion of non-percolating networks to percolating ones (see Fig. 5), we can hypothesize that all non-percolating networks can become percolating after a finite number of bond insertions; moreover, the average size of the percolating cluster after the minimal number of insertions needed to create it is again the same as the average size of the percolating cluster in networks that are percolating without bond insertions. An even stronger hypothesis is that after each new bond addition, the fraction of so far non-percolating networks becoming percolating is still the same linear function of as in Fig. 5. These hypotheses need to be tested in the future.
V.1.2 Removing a bond from the network
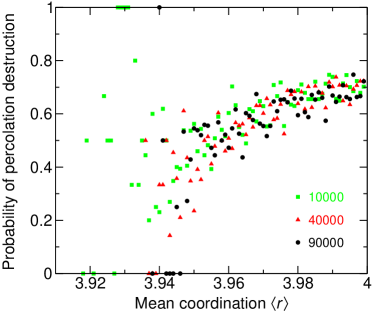
Likewise, we can consider the probability that removing a randomly chosen bond from a percolating network breaks the percolating cluster. This quantity is shown in Fig. 7. Just like for bond removal, this probability is non-zero everywhere in the intermediate phase. Interestingly, even at the upper boundary (), where almost all networks are percolating, it is still very easy to break percolation and thus create a non-percolating network. In fact, the probability is the highest in this limit. Of course, this can be attributed to the fact that the percolating cluster is itself the biggest at this point (taking up the whole network), so there is a greater chance than elsewhere to select a bond that belongs to it (which is, of course, a necessary condition of its destruction). This effect can be factored out by dividing the quantity in Fig. 7 by the average fraction of bonds in the percolating cluster. This will then give the probability of the destruction of the percolating cluster, given that the removed bond belongs to this cluster. This is plotted in Fig. 8. It is seen that across the whole intermediate phase, this quantity is nearly constant at around 70%. In other words, everywhere in the intermediate phase, the percolating cluster on average contains about 70% of bonds such that removal of any one of them will destroy percolation. This is true even close to . This is, of course, just the average; one could ask if for some networks this quantity is zero (similar to how in the case of bond insertion, not all non-percolating networks can be made percolating by a single bond addition, as shown in Fig. 5). To check if this is the case, we remove (and then reinsert) up to 10 bonds one by one (all chosen within the percolating cluster) and see if the percolating cluster ever gets destroyed. This happened for 5398 out of 5429 90000-site networks, or about 99.4%, including 198 out of 200 networks (99%) at (the highest mean coordination in our simulations). Since these fractions are so close to 100%, we can hypothesize that, unlike in the case of bond insertion, in fact, all percolating networks have some bonds whose removal destroys percolation.
To conclude this subsection, our results for the change in the percolation state of the network upon single bond addition or removal again confirm that the system remains critical in the whole intermediate phase.
V.2 Change of rigidity: “rigid” and “floppy” bonds
In the previous subsection, we have found that in many cases insertion or removal of a single bond can change the percolation status of the network and affect the rigidity of its significant part. Since we were dealing with percolating clusters only, we could not study the effect of bond insertion or removal in those cases when the percolation status does not change. To do this, we introduce the concept of “rigid” and “floppy” bonds.
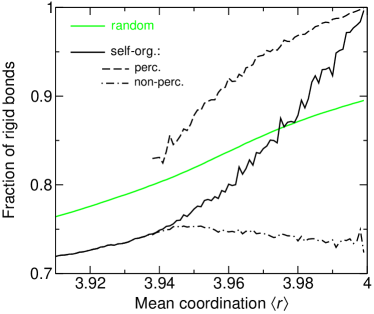
Below the rigidity transition, only small rigid clusters are present in the network. Interestingly, a significant fraction of them consist of just a single bond. The number of bonds belonging to these single-bond clusters decreases as the rigidity transition is approached and eventually crossed, although they are still encountered well above the transition in floppy pockets of the network. Since these bonds are associated with the floppy phase and floppy regions of the network in the rigid phase, we call such bonds floppy. All other bonds (i.e., those belonging to clusters consisting of more than one bond, or, in other words, rigid with respect to some other bonds) are called rigid. The fraction of rigid bonds as a function of is plotted in Fig. 9 for both random and self-organized networks. As expected, it grows in both cases with increasing , but in the self-organized case it reaches 1 at (when the network becomes fully rigid), which in the random case does not happen until the full coordination at . For the self-organized case, the averages over just percolating networks and over just non-percolating networks are also shown in Fig. 9. Interestingly, the average for non-percolating networks remains nearly constant over the whole intermediate phase at about 75%, even as . In this limit, the number of floppy modes per site tends to zero in all networks; yet, as these results show, in those few networks that still do not percolate, many bonds (about 25%) are still in single-bond clusters.
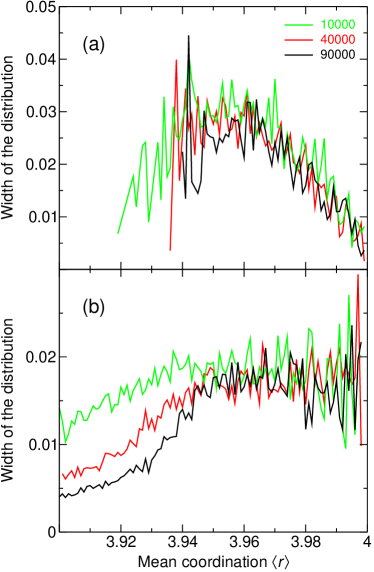
Just as in the previous section we considered the width of the distribution of percolating cluster sizes, it is interesting to look at the width of the distribution of fractions of rigid bonds. Of course, since the averages are very different for percolating and non-percolating networks, it makes sense to separate these two classes. The results are shown in Fig. 10. Note that in the intermediate phase, the width is size-independent and so likely remains finite in the thermodynamic limit, for both percolating and non-percolating networks, just as we have seen for the percolating cluster size (see Fig. 2). But in the floppy phase (where, of course, only non-percolating networks are present), the width clearly decreases fast with size (it is roughly inversely proportional to the square root of the network size). Thus the number of rigid bonds is a self-averaging quantity in the floppy phase but not in the intermediate phase, even when percolating and non-percolating networks are considered separately. At the same time, the widths for both percolating and non-percolating cases are much smaller that the difference between these two cases, so based on the count of rigid bonds, these two classes are clearly distinct.
We now look at the influence of insertion or removal of a bond on the number of rigid bonds and their spatial distribution.
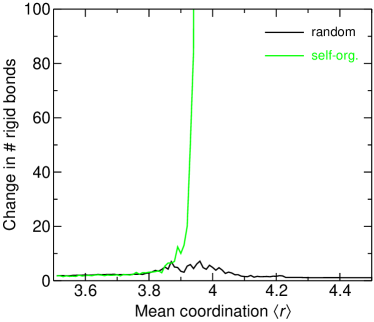
In Fig. 11, we show the average change in the number of rigid bonds upon insertion of a single bond, in both the random and the self-organized cases. Note that in the random case, this change is very small on average, around 10 bonds or less. On the other hand, in the self-organized case this quantity diverges very fast when the rigidity transition is approached. This is not surprising: we have seen that infinite percolating clusters can easily form and break in this case. For this reason, it makes sense to look at the fraction of bonds that undergo the change.
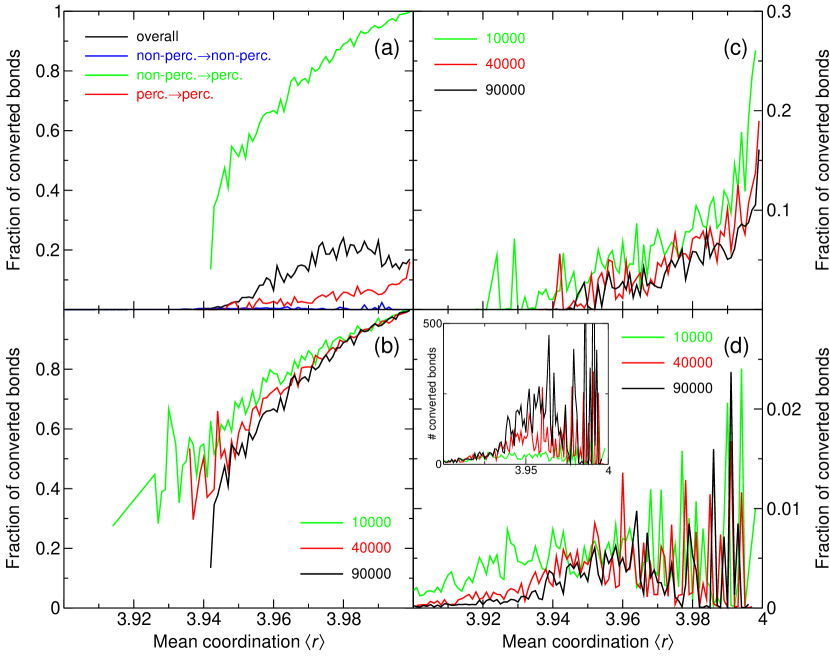
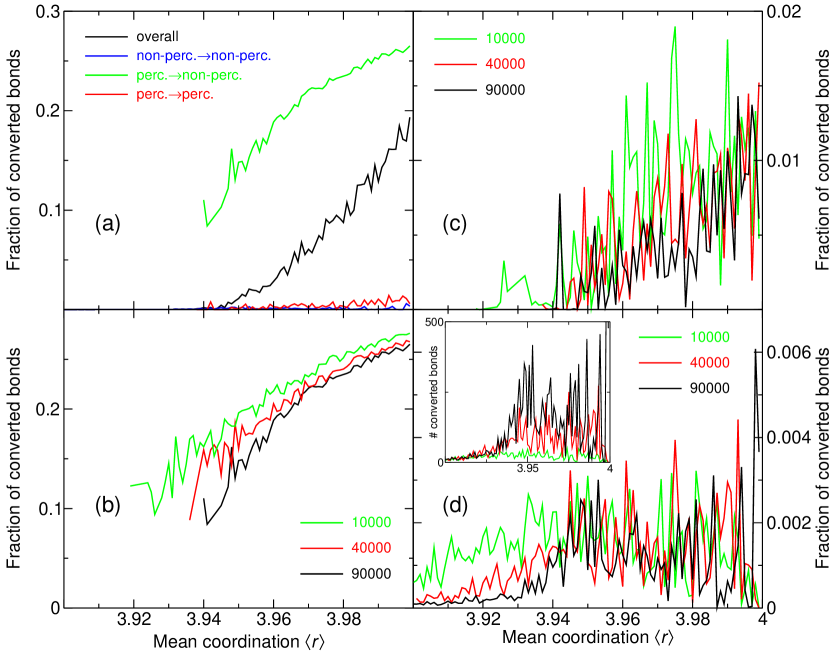
In Fig. 12, we show the fraction of bonds converted from floppy to rigid when a bond is added to the network at a randomly-chosen allowed position, among all floppy bonds in the network. In panel (a), we plot the overall average, as well as partial averages restricted to those cases when the network goes from non-percolating to percolating, remains percolating and remains non-percolating (the curve for the latter case is barely above the baseline). In panels (b), (c), and (d), we show these partial averages for several different sizes. Based on what we have already learned for networks switching from non-percolating to percolating, it is quite natural that in this case a significant fraction of floppy bonds become rigid; this fraction approaches 1 when , which is again expected, since in this limit the percolating cluster takes up the whole network (see Fig. 6). The other two cases are more interesting. In the floppy phase, only the non-percolating non-percolating situation is possible, and as we see from panel (d), in this region of the phase diagram the average fraction of bonds converted from floppy to rigid decreases fast with size. In the inset, we plot the average number (rather than fraction) of converted bonds, and we see that this number is size-independent. So in the floppy phase, a finite number of bonds gets converted. In the intermediate phase, the situation is different. Looking first at the percolating percolating situation [panel (c)], the fraction of converted bonds depends only weakly on the network size, and it is possible that this quantity goes to a constant in the thermodynamic limit. Even if, in fact, this fraction decreases to zero as the size goes to infinity, it is clear that the decrease is much slower than , and thus the mean number of converted bonds diverges when . In the non-percolating non-percolating case, the quality of the data is lower (there is very much noise due to a very large variation in the number of converted bonds), but still it is clear that the decrease with (if present) is certainly much slower than .
The fact that for the percolating percolating and non-percolating non-percolating cases the average number of converted bonds diverges in the thermodynamic limit in the intermediate phase means that even when the percolation status does not change, the region of the network whose rigidity is affected are macroscopic at least in some cases. This is again consistent with the criticality of the intermediate phase. The distribution of the sizes of affected regions (or numbers of converted bonds) is likely power-law, which needs to be tested in the future.
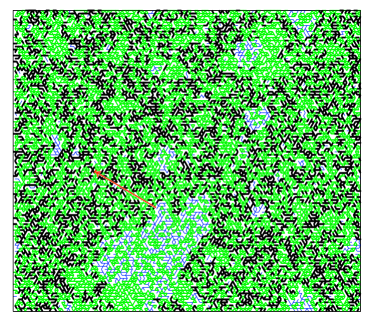
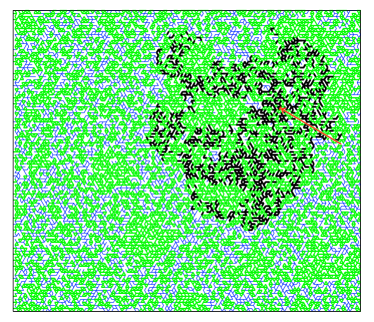
As an illustration of effects of bond insertions we show two examples in Fig. 13. The upper panel shows an example for the case when the network switches from non-percolating to percolating after a bond is added. The lower panel shows an event where the network remains non-percolating, but large-scale rigidification still occurs without percolation. In both cases, the added bond is red and pointed with an arrow, thick green bonds are those that are originally rigid (and, of course, remain rigid after bond addition), thin blue bonds are originally floppy and remain floppy, finally, thick black bonds are of most interest: these are the ones that switch from floppy to rigid. In the first (non-percolating percolating) case, converted bonds are spread throughout the network. Many bigger rigid clusters separated by floppy “interfaces” merge into one percolating rigid cluster; in essence, the figure illustrates the rigidification of these interfaces. In the second (non-percolating non-percolating) example, the affected region is still large, but non-percolating. This example is larger than average, as can be deduced from Fig. 12, panel (d), but it is not a rare event.
We find overall similar behavior upon removal of a bond. The results for the fraction of rigid bonds converting to floppy are in Fig. 14. Similarly to Fig. 12, in panel (a) we have the overall average and partial averages for percolating non-percolating, percolating percolating and non-percolating non-percolating cases, for a single network size (90000 sites). In panels (b), (c), and (d), we have the same partial averages, but for three different sizes. Again, the conclusions are similar to the case of bond insertion: in the percolating non-percolating case, when the percolation status of the network changes [panel (b)], the fraction of bonds that switch from rigid to floppy is expectedly high. It is much lower in the other two cases, when the percolation status does not change, but still, just as for bond addition, while in the floppy phase the fraction of converting bonds falls rapidly with increasing size and, as the inset of panel (d) shows, the average number of converting bonds remains constant, in the intermediate phase, again, the dependence of the fraction of converting bonds on the size is very slow and the number of converting bonds diverges in the thermodynamic limit — thus again, macroscopic regions of the network can be involved.
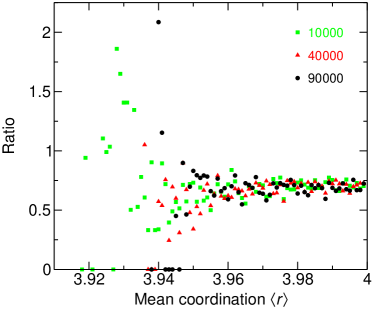
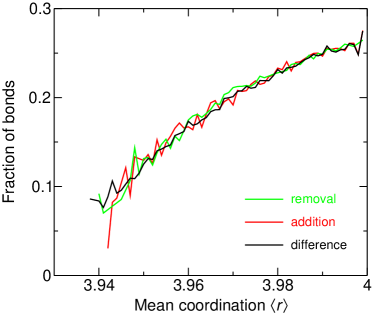
We finish this subsection with an observation: there exists a symmetry in bond conversions upon addition and upon removal. Namely, the average number of bonds converting upon bond addition in the case when the network transforms from non-percolating to percolating is the same as the average number of bonds converting upon bond removal when the network transforms from percolating to non-percolating. This is illustrated in Fig. 15. In this figure, we plot the ratios of the above-mentioned numbers and the total number of bonds in the network. We find that these two quantities coincide. Note that these quantities are different from those plotted in Figs. 12 and 14: in these figures, the numbers of converted bonds were divided by the number of floppy bonds and the number of rigid bonds, respectively, and not by the total number of bonds. The equality is easy to understand, if we recall that we have already seen some evidence (see Fig. 6) that networks that become percolating after bond insertion are, in fact, typical percolating networks, just like those that are originally percolating. By extension, we can assume that networks that become non-percolating after bond removal are also typical non-percolating networks. If so, then the average change in the number of rigid bonds should in both cases be the same as the difference in the average number of rigid bonds between percolating and non-percolating networks. Indeed, in Fig. 15 we also plot the difference between the average fractions of rigid bonds in the non-percolating and percolating cases (i.e., between the dashed and the dot-dashed lines in Fig. 9); it is seen that this quantity coincides with the other two.
V.3 Stress propagation
In the previous subsections, we have looked at cases when an “allowed” bond insertion is done; in other words, the bond is inserted in one of those places where it does not create stress. We now look at the opposite situation, i.e., we analyze the results of inserting a bond in one of “disallowed” places. In this case, the inserted bond is redundant, which means that its insertion does not change the configuration of rigid clusters, but some bonds (including the inserted one) become stressed. We are interested in the emerging stressed region and in particular, whether it percolates or not.
Similarly to the case of allowed bond insertion, we first look at the probability that the stressed region percolates. Note that the stressed region emerging upon bond insertion is always restricted to the rigid cluster containing the new bond. For this reason, the stressed region can only percolate if the original network is percolating (i.e., contains a percolating rigid cluster), and we only need to look at percolating networks. In Fig. 16, we show the probability that in a network in which rigidity percolates, a percolating stressed region emerges after insertion of a bond at a randomly chosen disallowed place (not necessarily within the percolating cluster). We note that apparently, this probability remains finite (does not go to zero) in the thermodynamic limit.
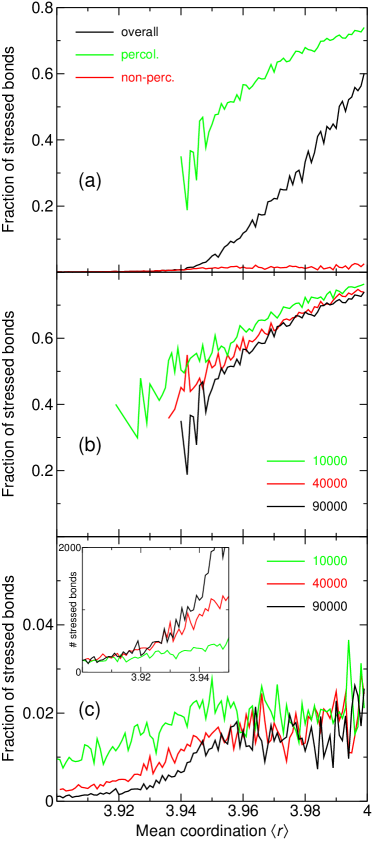
We also look at the sizes of stressed regions arising upon disallowed bond insertion. The results are in Fig. 17. Panel (a) shows the overall average fraction of stressed bonds and the partial averages for cases when stress does and does not percolate, for networks of 90000 sites; panel (b) gives the partial average for the case when stress percolates; and panel (c) gives the partial average for the case when stress does not percolate. We do not make distinctions based on the rigidity percolation status of the network. Again, we see that the size of the stressed region as a finite fraction of the total number of bonds is only weakly size-independent and thus the affected region can be macroscopic in the intermediate phase even when there is no percolation. In the floppy phase, on the other hand, the fraction of stressed bonds decays fast with increasing network size and as the inset (where the number of conversions, rather than the fraction, is plotted) shows, the average number of conversions is size-independent and the affected region remains finite.
VI Experimental evidence for the self-organized critical behavior
An atypical response to an external perturbation seen in the intermediate phase has been observed experimentally Wang et al. (2005). Raman pressure experiments show that applying external pressure to a network blueshifts the frequency of corner-sharing (CS) tetrahedral units only once a certain pressure threshold () value is reached. is found to be zero within the intermediate phase and non-zero outside the intermediate phase. These experimental results, published in Ref. Wang et al. (2005), are reproduced in Fig. 18.
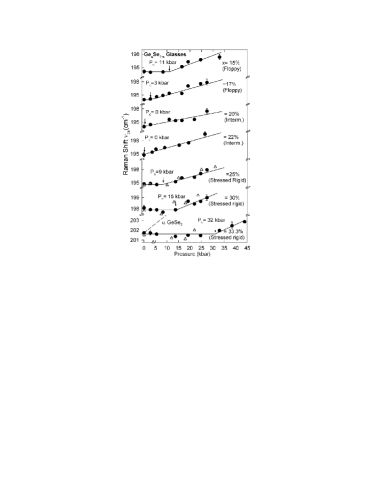
Outside the intermediate phase, the presence of a non-zero threshold for the shift in the frequency suggests that inhomogeneities cancel the effect, leaving only a broadening of the peak Wang et al. (2005). On the other hand, we have seen that in the intermediate phase, a finite fraction of the network is either in a percolating cluster or in a region that becomes percolating after a few bond insertions. This region is also stress-free. This can only be achieved by a precise balancing between constraints and degrees of freedom not just on average, but on all length scales, in other words, by the network being homogeneous because of self-organized criticality. We note that the way rigidity and stress propagate through a macroscopic fraction of the network in our simulations is analogous to how stress propagates uniformly when external pressure is applied in experiments. While the relation between and inhomogeneity still needs to be fully established, self-organized criticality in the intermediate phase is consistent with the observations.
VII Conclusion
We have studied the structural and response properties of the intermediate phase in the phase diagram of rigidity percolation using a model of self-organization on a 2D triangular network.
We had shown previously that the probability of rigidity percolation in the intermediate phase increases linearly from zero to one as a function of the mean coordination . At any , there are both percolating and non-percolating networks in the ensemble. In this paper, we have looked at the properties of both percolating and non-percolating clusters, the latter separately for percolating and non-percolating networks. It turns out that at the point at which the percolating networks first emerge (the rigidity transition), the percolating cluster takes up about 40% of the network, unlike the case of the usual second-order phase transition, where the emerging cluster is fractal and thus the fraction of bonds belonging to it is zero in the thermodynamic limit. The size of the percolating cluster and some other characteristics are not self-averaging, but the distributions are rather narrow, if percolating and non-percolating networks are considered separately. The distribution of sizes of non-percolating clusters is exponential at large sizes in the floppy phase, but power-law for arbitrarily big cluster sizes in the whole intermediate phase and not just at the transition. The power-law exponents are different for non-percolating and percolating networks.
We have also looked at the changes in the rigidity of the network due to a microscopic perturbation in the form of insertion or removal of a single bond. It turns out that one bond is often enough to convert a non-percolating network into a percolating one and vice versa; moreover, when a non-percolating network is turned into a percolating one, the average size of the resulting percolating cluster is the same as that for the initially percolating networks. In a sense, the percolating cluster is “hidden” in the non-percolating network and is revealed upon addition of a single bond. It appears, further, that all non-percolating networks can be converted into percolating ones with a finite number of bond additions, with the same size of the resulting cluster as in networks that percolate without bond addition. This implies that in the thermodynamic limit, there is no difference between percolating and non-percolating networks. The intermediate phase then can be thought of as being the region of the phase diagram where all networks possess a percolating region that is nearly isostatic. That is, this region can technically be floppy or stressed, but the number of floppy modes or redundant constraints causing stress is negligible in the thermodynamic limit. The lower boundary of the intermediate phase is then, strictly speaking, not the rigidity percolation transition, but rather the “near-isostaticity” percolation transition.
These unusual properties indicate that the intermediate phase is a self-organised critical phase, with the system staying at the rigidity percolation threshold for the whole range of mean coordinations. The existence of such a self-organized nearly isostatic critical phase explains recent pressure experiments Wang et al. (2005). Since rigidity percolation occurs on a finite fraction of the network under any microscropic perturbation, the strain associated with the external pressure is immediately transferred to a macroscopic fraction of the sample, leading to a shift in the Raman spectrum.
We can certainly expect other surprises associated with this intermediate phase in the rigidity phase diagram. But for that, we will likely need to create more realistic models of the experimental systems.
Acknowledgments
The authors are supported in part by the Fonds québécois de la recherche sur la nature et les technologies (FQRNT), the Natural Sciences and Engineering Research Council of Canada (NSERC) and the Canada Research Chair program. We thank the Réseau québécois de calcul de haute performance (RQCHP) for generous allocation of computational resources.
Appendix: Relation between the probability of percolation in the intermediate phase and the probability of inducing percolation by single bond insertion
Numerically, the probability that there exists a place in a non-percolating network such that insertion of a bond at that place causes percolation is the same linear function in the intermediate phase as the probability of rigidity percolation (see Fig. 5). Here we show that this equality is a necessary consequence of the latter quantity being finite (between zero and one) and continuous throughout the intermediate phase.
Given the probability of percolation among networks with bonds, we can calculate this probability for networks with bonds. The method is similar to that used to calculate the bond-configurational entropy of self-organized networks in our previous paper Chubynsky et al. (2006). Suppose there are networks (or bond configurations) with bonds that are stress-free. If the probability of percolation is , then of these are percolating and the rest, , non-percolating. Also suppose there are on average allowed places to insert a bond in percolating networks and in non-percolating networks and the probability that a non-percolating network becomes percolating upon a random bond insertion is . Since all percolating networks will remain percolating upon bond insertion, then an average percolating network with bonds will produce different percolating networks. On the other hand, only a fraction of non-percolating networks will become percolating, so an average non-percolating network will produce percolating networks and non-percolating networks. If we simply multiply these numbers by the number of networks with bonds of each kind, this will not produce the correct count of percolating and non-percolating networks with bonds, because each such network can be obtained in many different ways. Specifically, each network with bonds can be produced by bond insertion from as many different networks with bonds as there are the latter that can be obtained by bond removal from the former. This number is always , since removal of every bond will produce a distinct network and all of them are stress-free. So the count has to be divided by , and we get for the number of percolating networks with bonds,
| (5) | |||||
and for the number of non-percolating networks with bonds,
| (6) |
Then the probability of percolation for a network with bonds is
Note that since the probability of percolation changes continuously, the difference between and is , where is the network size. Neglecting terms that are , we should equate and then, omitting the argument for brevity and using ,
| (8) |
or
| (9) |
Now, as we have seen, networks that become percolating after bond insertion are typical, generic percolating self-organized networks. So we can expect that on average, when a bond is inserted into a non-percolating network and it becomes percolating, the change in the number of allowed bonds is . But bonds that become disallowed are exactly those that are within the percolating cluster, and, according to our arguments at the beginning of Section V, these and only these bonds will create the percolating cluster and cause percolation (indeed, if insertion of any bond creates a percolating cluster, then insertion of any bond outside the region that turns into the percolating cluster will not cause percolation because the cluster that will form cannot overlap with this region, other than over a single pre-existing cluster, and thus cannot percolate). So, if for a given network making it percolating after one bond insertion is at all possible, then the probability that percolation will occur after random insertion is equal to the fraction of allowed bonds within the percolating cluster, or , and then the right-hand side of Eq. (9) is exactly the probability that percolation after one bond insertion is possible, and the proof is complete.
There are some caveats in this proof, related to the fact that, as we have seen, many quantities in the intermediate phase are not self-averaging. Because of this, for instance, if fractions of allowed bonds are not strictly deterministic, there can be correlations between the number of allowed bonds in a network and this number in the percolating network created after bond insertion. For instance, the latter may tend to be above average when the former is below average. Then the average change in the number of allowed bonds may differ somewhat from , which is the difference of averages. In fact, the very statement that networks obtained by bond insertion can be considered typical needs to be treated with caution. Indeed, if all quantities associated with self-organized networks were self-averaging, then, in order to change the values of these quantities by inserting a bond, one would need to upset the balance so badly as to create a finite chance of seeing networks with properties that at equilibrium have probability zero. Such bias after inserting just a single bond cannot happen, except in very special cases. But the situation changes when there is no self-averaging: if the distribution of values of a certain quantity has a finite width, then any bias can change the average. For this reason, it is possible that both the equality proved above and the statement that any quantities obtained for networks that become percolating after inserting a bond are the same on average as for originally percolating networks (as demonstrated in Figs. 6 and 15) are, in fact, only approximate. In any case, deviations (if any) are very small.
References
- Thorpe (1983) M. F. Thorpe, J. Non-Cryst. Solids 57, 355 (1983).
- Phillips (1979) J. C. Phillips, J. Non-Cryst. Solids 34, 153 (1979).
- Thorpe et al. (2000) M. F. Thorpe, D. J. Jacobs, M. V. Chubynsky, and J. C. Phillips, J. Non-Cryst. Solids 266-269, 859 (2000).
- Boolchand et al. (1999) P. Boolchand, X. Feng, D. Selvanathan, and W. J. Bresser, in Rigidity Theory and Applications, edited by M. F. Thorpe and P. M. Duxbury (Kluwer Academic/Plenum Publishers, New York, 1999), p. 279.
- Thorpe et al. (1999) M. F. Thorpe, D. J. Jacobs, N. V. Chubynsky, and A. J. Rader, in Rigidity Theory and Applications, edited by M. F. Thorpe and P. M. Duxbury (Kluwer Academic/Plenum Publishers, New York, 1999), p. 239.
- Jacobs et al. (2001) D. J. Jacobs, A. J. Rader, L. A. Kuhn, and M. F. Thorpe, Proteins 44, 150 (2001).
- Selvanathan et al. (2000) D. Selvanathan, W. J. Bresser, and P. Boolchand, Phys. Rev. B 61, 15061 (2000).
- Boolchand et al. (2001a) P. Boolchand, D. G. Georgiev, and B. Goodman, J. Optoelectron. Adv. Mater. 3, 703 (2001a).
- Boolchand et al. (2001b) P. Boolchand, X. Feng, and W. J. Bresser, J. Non-Cryst. Solids 293, 348 (2001b).
- Boolchand et al. (2002a) P. Boolchand, D. G. Georgiev, and M. Micoulaut, J. Optoelectron. Adv. Mater. 4, 823 (2002a).
- Boolchand et al. (2002b) P. Boolchand, D. G. Georgiev, T. Qu, F. Wang, L. Cai, and S. Chakravarty, C.R. Chimie 5, 713 (2002b).
- Georgiev et al. (2003) D. G. Georgiev, P. Boolchand, H. Eckert, M. Micoulaut, and K. Jackson, Europhys. Lett. 62, 49 (2003).
- Qu et al. (2003) T. Qu, D. G. Georgiev, P. Boolchand, and M. Micoulaut, in Mat. Res. Soc. Symp. Proc. Vol. 754, edited by T. Egami, A. L. Greer, A. Inoue, and S. Ranganathan (2003), p. CC8.1.
- Vempati and Boolchand (2004) U. Vempati and P. Boolchand, J. Phys.: Condens. Mat. 16, S5121 (2004).
- Chakravarty et al. (2005) S. Chakravarty, D. G. Georgiev, P. Boolchand, and M. Micoulaut, J. Phys.: Condens. Mat. 17, L1 (2005).
- Černošková et al. (2005) E. Černošková, T. Qu, S. Mamedov, Z. Černošek, J. Holubová, and P. Boolchand, J. Phys. Chem. Solids 66, 185 (2005).
- Qu and Boolchand (2005) T. Qu and P. Boolchand, Phil. Mag. 66, 875 (2005).
- Wang et al. (2005) F. Wang, S. Mamedov, P. Boolchand, B. Goodman, and M. Chandrasekhar, Phys. Rev. B 71, 174201 (2005).
- Vaills et al. (2005) Y. Vaills, T. Qu, M. Micoulaut, F. Chaimbault, and P. Boolchand, J. Phys.: Condens. Mat. 17, 4889 (2005).
- Lucovsky and Phillips (2004) G. Lucovsky and J. C. Phillips, Appl. Phys. A 78, 453 (2004).
- Thorpe and Chubynsky (2001) M. F. Thorpe and M. V. Chubynsky, in Properties and Applications of Amorphous Materials, edited by M. F. Thorpe and L. Tichý (Kluwer Academic, Dordrecht, 2001), NATO Science Series, II. Mathematics, Physics and Chemistry, vol. 9, p. 61.
- Micoulaut (2002) M. Micoulaut, Europhys. Lett. 58, 830 (2002).
- Micoulaut and Phillips (2003) M. Micoulaut and J. C. Phillips, Phys. Rev. B 67, 104204 (2003).
- Barré et al. (2005) J. Barré, A. R. Bishop, T. Lookman, and A. Saxena, Phys. Rev. Lett. 94, 208701 (2005).
- Bak et al. (1988) P. Bak, C. Tang, and K. Wiesenfeld, Phys. Rev. A 38, 364 (1988).
- Maxwell (1864) J. C. Maxwell, Philos. Mag. 27, 294 (1864).
- Jacobs and Thorpe (1995) D. J. Jacobs and M. F. Thorpe, Phys. Rev. Lett. 75, 4051 (1995).
- Jacobs and Hendrickson (1997) D. J. Jacobs and B. Hendrickson, J. Comput. Phys. 137, 346 (1997).
- Laman (1970) G. Laman, J. Engrg. Math. 4, 331 (1970).
- Chubynsky et al. (2006) M. V. Chubynsky, M.-A. Brière, and N. Mousseau, Phys. Rev. E 74, 016116 (2006).
- Moukarzel et al. (1997) C. Moukarzel, P. M. Duxbury, and P. L. Leath, Phys. Rev. E 55, 5800 (1997).
- Duxbury et al. (1999) P. M. Duxbury, D. J. Jacobs, M. F. Thorpe, and C. Moukarzel, Phys. Rev. E 59, 2084 (1999).
- Murase and Fukunaga (1984) K. Murase and T. Fukunaga, in Optical Effects in Amorphous Semiconductors, edited by P. C. Taylor and S. G. Bishop (American Institute of Physics, 1984), p. 449.