Present address: ]Laboratoire de Physique Statistique, Ecole Normale Supérieure, 24, rue Lhomond, 75231 Paris Cedex 05, France
Universal Anisotropy in Force Networks under Shear
Abstract
Scaling properties of patterns formed by large contact forces are studied as a function of the applied shear stress, in two-dimensional static packings generated from the force network ensemble. An anisotropic finite-size-scaling analysis shows that the applied shear does not affect the universal scaling properties of these patterns, but simply induces different length scales in the principal directions of the macroscopic stress tensor. The ratio of these length scales quantifies the anisotropy of the force networks, and is found not to depend on the details of the underlying contact network, in contrast with other properties such as the yield stress.
pacs:
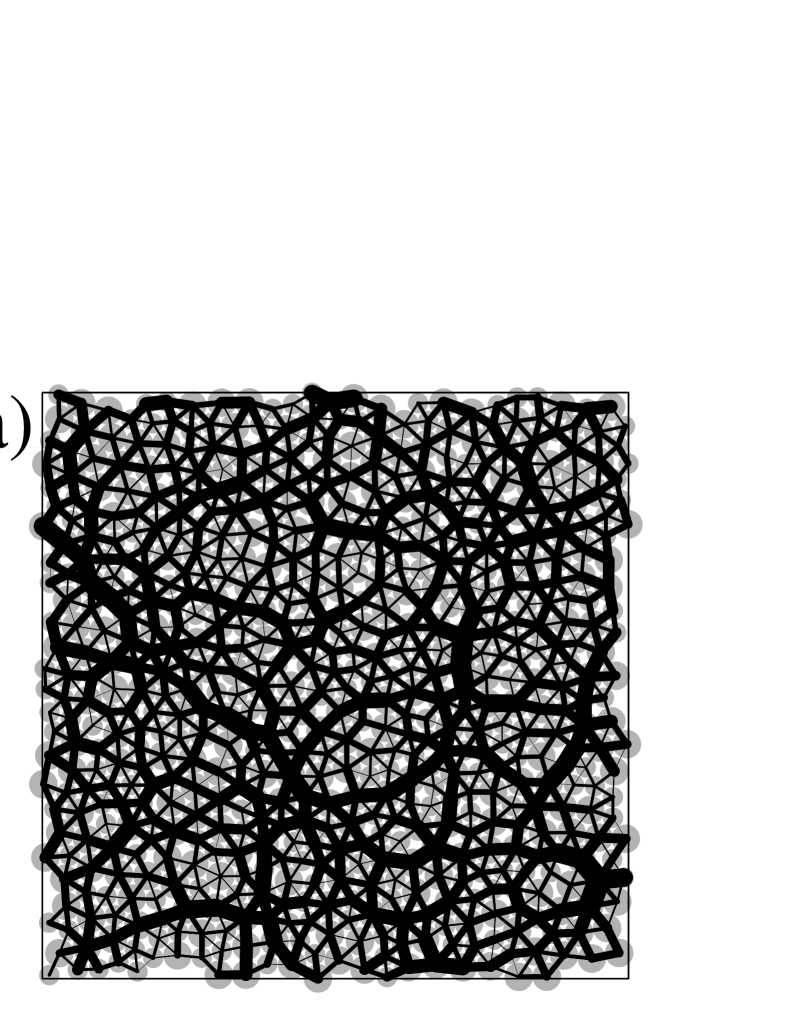
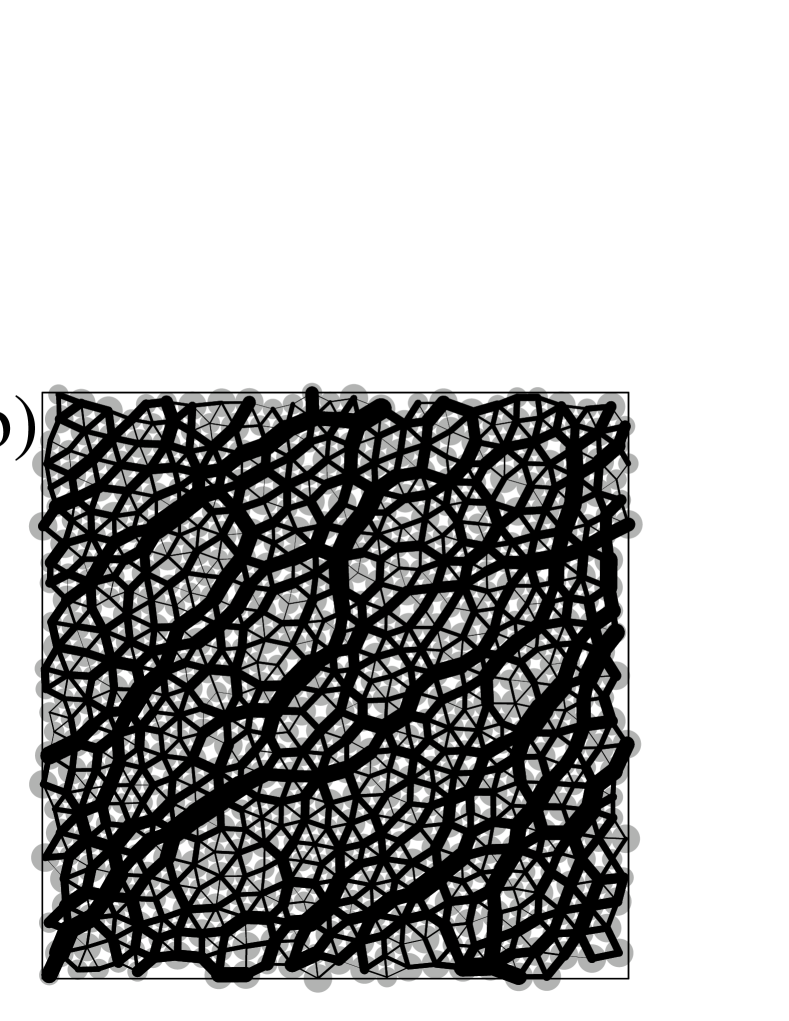
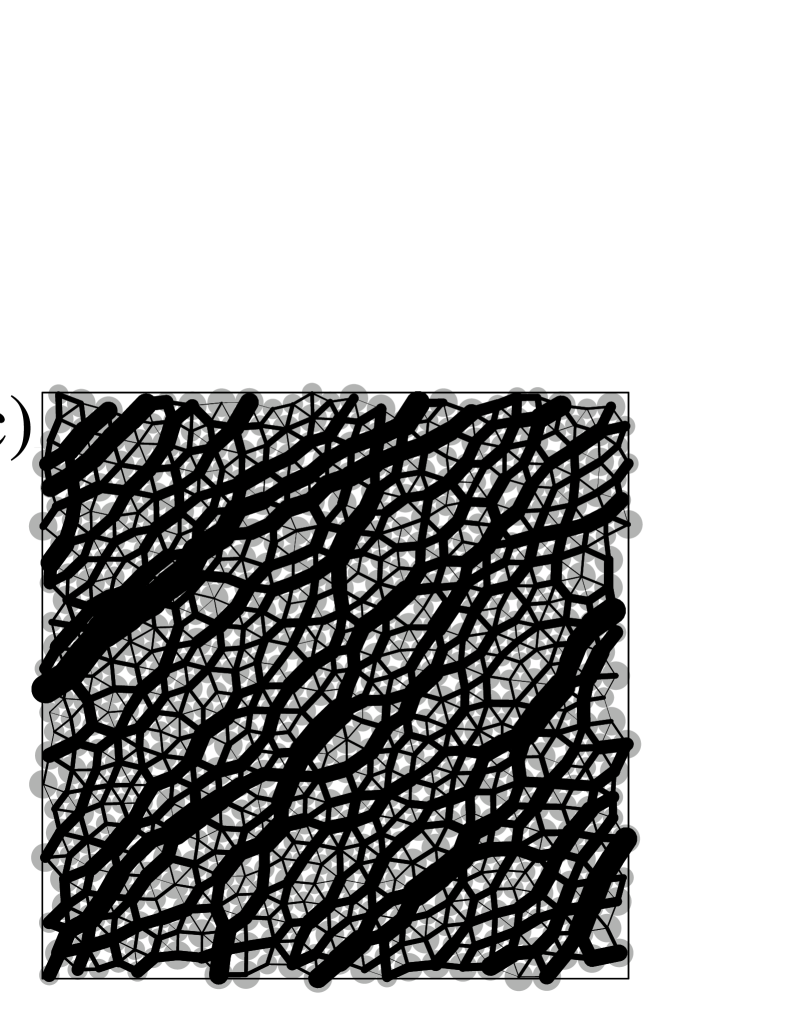
45.70.-n, 45.70.Cc, 46.65.+gAggregates of macroscopic particles such as granular materials, foams and emulsions are often found in a disordered, solid-like state whose mechanical properties have attracted much attention in recent years Jaeger et al. (1996); de Gennes (1999); Bouchaud (2003); Liu and Nagel (1998, 2001); Radjai et al. (1998); Geng et al. (2003); Majmudar and Behringer (2005); Atman and et al. (2005); Snoeijer et al. (2004, 2006); Tighe and et al. (2005); Ostojic et al. (2006). Under external stresses, these systems present a non-zero yield threshold which is solely due to the intricate network formed by contact forces between particles. One of the most remarked features of these highly disordered force networks is the tendency for large forces to align and form branching force chains. When these appear in response to an external stress, such as a global shear, their spatial inhomogeneity is most striking Radjai et al. (1998); Geng et al. (2003); Majmudar and Behringer (2005). As the applied shear stress is increased, the large forces orient in a preferred direction, and the force network becomes more and more anisotropic (c.f. Fig. 1), up to the point where the applied stress can no longer be sustained, and the packing yields. While this qualitative picture has been long established, due to a lack of appropriate analytic and numerical tools, quantitative studies of packings under static shear have been few Radjai et al. (1998); Geng et al. (2003); Majmudar and Behringer (2005); Atman and et al. (2005); Snoeijer et al. (2006).
Recently, a novel characterization has been introduced for the geometrical patterns formed by large forces in isotropically compressed force networks Ostojic et al. (2006)). The patterns, displayed by molecular dynamics (MD) simulations of granular packings, turned out to have scaling properties which are independent of the pressure, polydispersity and friction. An intriguing question is whether an analysis of scaling properties can provide insight into the organization of force networks in packings under shear. This is a much more difficult problem.
Creating static packings under shear with MD is seriously hindered by local rearrangements that seem to prevent the system from reaching a clear mechanical equilibrium. To allow for systematic examinations of the effects of shear, it has been proposed Snoeijer et al. (2004, 2006) to ignore the microscopic rearrangements of the grains, and study the ensembles of force networks allowed on a given contact network, as function of macroscopic stresses. This purely statistical approach was found to account well for the properties of packings under shear such as the existence of a yield threshold Snoeijer et al. (2006), as well as for the scaling properties of clusters of large forces in packings without shear Ostojic et al. (2006). It also describes remarkably well the distribution of force magnitudes Snoeijer et al. (2004); Tighe and et al. (2005); Snoeijer et al. (2006) and the response to an external overload Ostojic and Panja .


In this Letter, we study the geometry of patterns of large forces in two-dimensional, static packings under shear generated from the force network ensemble. We find that applying shear stress leaves unchanged the universal scaling properties of the patterns, but introduces two different length scales in the two directions of principal stress axes. We characterize the anisotropy of the force networks by the ratio of these length scales. An anisotropic finite-size scaling analysis allows us to determine as function of the applied shear stress and the coordination number of the packing. In contrast with other properties such as the yield stress, turns out to be independent of the underlying contact geometry, and thus provides a universal characterization of shear-induced anisotropy.
Force networks— To study systematically the influence of the shear stress on the geometry of large forces we examined force networks generated from the force network ensemble pertaining to packings of frictionless, non-attracting particles. This approach relies on the fact that in a typical packing, the number of unknown contact forces is larger than the number of equations for mechanical balance Snoeijer et al. (2004). For a given, fixed, contact geometry, the force network ensemble consists of all force networks with repulsive contact forces in mechanical balance on each grain, and consistent with the tensor of applied macroscopic stress. The considered contact networks are isotropic, and the coordinates are such that the pressure is isotropic, i.e. , while the dimensionless shear stress is varied.
The ensemble is sampled numerically using two different methods : (i) the wheel-move algorithm Tighe and et al. (2005) for ordered, hexagonal packings (); (ii) the procedure outlined in Snoeijer et al. (2006) for disordered packings of various coordination numbers . Both methods efficiently generate very large packings ( and particles respectively), from which smaller sub-systems were extracted and analyzed. Note that the ensemble is non-empty only for smaller than a maximal value , which has been identified as the yield stress Snoeijer et al. (2006).
Force chains— To study the geometry of patterns formed by large forces, we follow the method introduced in Ostojic et al. (2006), which we here briefly recall and then extend to packings under shear. The force network in a packing of frictionless particles can be represented as a set of bonds connecting grains in contact, where each bond carries the magnitude of the corresponding contact force (c.f. Fig. 1 (a-c)). A natural way to isolate the force chains in such a network is to choose a threshold , and consider only the subgraph formed by bonds carrying forces larger than (c.f. Fig. 1 (d-f)). Varying this threshold allows to study patterns of large forces at different scales: for small values, most of the grains remain connected, but as the threshold is increased, the extracted subgraph breaks into disconnected clusters. The extent of each chain of forces larger than the threshold can be characterized by the size of the corresponding cluster, quantified by the number of mutually connected bonds.
In an ensemble of packings, a statistical description of the fluctuating patterns of large forces is given by the statistics of the clusters obtained at different thresholds. Following the methods of percolation theory Stauffer and Aharony (1991), the geometry of an ensemble of packings can be characterized by , the number (per bond) of clusters of size at the threshold . For packings under isotropic pressure, it is moreover natural to describe the clusters by a single characteristic length, the cluster correlation length , which corresponds to the typical linear size of the clusters at a given threshold (not considering clusters percolating through the whole system).
Scaling analysis—Analogously to percolation and other lattice models of critical phenomena, the system is critical around the value of the threshold above which no infinite cluster is found. At this value, diverges as , and becomes a power-law, its moments diverging as powers of : . For systems of finite size, the correlation length is naturally bounded by the linear size of system, , and for comparable to , the behavior of is given by a scaling function of Privman (1990); Binder and Wang (1989):
| (1) |
where and are universal critical exponents, and universal scaling functions. For force networks under isotropic pressure, , , and is independent of pressure, polydispersity, friction and force law Ostojic et al. (2006). From now on, we will only consider the case , and omit the indices in the right-hand-side. Note that the scaling function varies smoothly and displays a single maximum close to zero.
Equation (1) assumes that the size of the examined domains is isotropic. In the following, we will need to consider rectangular domains of size , in which case the scaling function also depends on the aspect ratio . Considering only the maximum of with respect to , which is equivalent to looking only at the behavior at the effective critical point, Eq. (1) reduces to
| (2) |
The scaling function simply expresses the fact that if , the effective correlation length is set by , so that , and correspondingly if , . We therefore have (with )
| (3) |
For , there is a crossover between the two asymptotic trends, and the precise behavior is determined by the scaling function.
Shear-induced anisotropy— The analysis presented so far pertains to the case of isotropic pressure. In packings under shear, the force networks become increasingly anisotropic as the shear stress is increased, the large forces aligning preferentially in the direction of the maximal stress axis (cf. Fig. 1). In consequence, close to the percolation threshold the clusters can no longer be described by a single length scale. Instead two correlation lengths and must be distinguished, in the direction of maximal and minimal stress axes respectively. In principle, at criticality these two length scales could diverge with two different exponents and . A finite-size scaling analysis as in Ostojic et al. (2006), but now varying independently the system sizes and in the directions of principal stresses, shows that , the exponents and being equal to those of isotropically compressed packings.
Although they diverge with the same exponent, the values of the correlation lengths and clearly differ. This implies that, to leading order,
| (4) |
where the length scales and depend on the shear stress but not on the threshold . In the language of critical phenomena, this situation is called weakly anisotropic scaling, as opposed to the case where the two correlation-length exponents differ Binder and Wang (1989).
To quantify the anisotropy of force networks as function of shear stress, from Eq. (4), it appears natural to use the anisotropy ratio defined as
| (5) |
Clearly, for , , and as is increased, decreases below one.
The anisotropy ratio as function of can be determined using an anisotropic scaling analysis. The central observation is that, in the context of conventional critical phenomena, a weakly anisotropic system can be made isotropic simply by rescaling the lengths in the two directions of principal axes. In the present setting, this property suggests that if the actual lengths and are replaced by properly rescaled effective lengths and , the scaling properties of the sheared force networks should be identical to those of isotropically compressed networks. This property allows us to determine the ratio of length scales and .
More specifically, the scaling of the maximum of is described by Eq. (2) with an additional dependence on the shear stress in the right hand side. Our hypothesis is that the scaling function does not depend explicitly on , and that the anisotropy can be eliminated simply by replacing and by rescaled lengths and given by
with and , and therefore . Substituting into Eq. (2), the scaling relation becomes
| (6) |
where the dependence on occurs only through the scale factors and .
The validity of the scaling relation (6) can be checked directly from the numerical data. Fig. 2 illustrates the behavior of as function of , for three different values of , and in each case three different values of . For fixed and , as increases, at first a clear power-law can be observed. For larger values of , a crossover occurs and reaches a plateau. As is increased, the behavior in the scaling regime is unchanged, but the crossover occurs at larger , and the value of the plateau increases. According to Eq. (2), the value of the crossover should scale as , and the value of the plateau as . Rescaling both axes appropriately, the data for different indeed collapse on the same curves as shown in Fig. 2 (b).
For different values of the shear stress, the exponents in the scaling regimes appear to be identical, however the prefactors of the power laws clearly depend on . From Eq. (6), these prefactors correspond to and , which can thus be determined respectively from the value reached at the plateau and the intercept of the power law. Replacing and by rescaled lengths and defined in Eq. (Universal Anisotropy in Force Networks under Shear), if the scaling function is independent of , all the data must collapse on a single curve. Note that as is increased, the cross over occurs at smaller , and the domain of power-law scaling shrinks, so that can be extracted only for sufficiently smaller than the yield stress (beyond which the force network ensemble is empty).
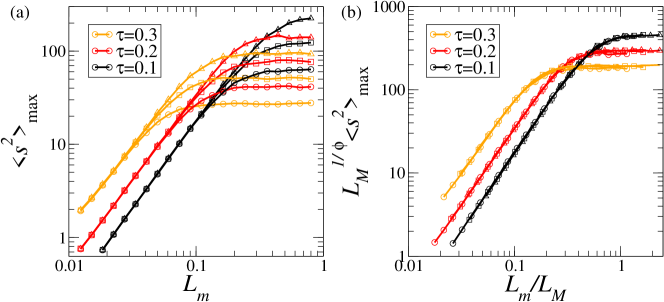
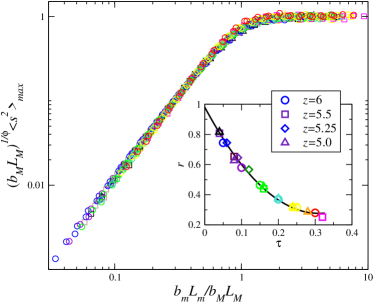
Fig. 3 displays the results obtained for all considered values of shear stress , on several packing geometries of different coordination number ( corresponds to the ordered hexagonal case, while the other packings are disordered). All the data clearly collapses on the same curve, in agreement with the hypothesis that the scaling function does not depend on . As postulated, a simple rescaling of the length scales in the two directions of anisotropy is thus sufficient to recover isotropic scaling in force networks under shear.The inset of Fig. 3 displays the anisotropy parameter as function of . Unexpectedly, appears to be independent of the coordination number and geometry of the underlying contact network.
Discussion— Our results show that applying an external shear stress on a force network does not affect the universal scaling properties of the force chains, but only induces two different length scales in the directions of the two principal stress axes. While these typical lengths and their ratio are not a priori expected to be universal, we find that they are identical for various contact networks we considered, which include the regular hexagonal packing, and disordered networks of different coordination numbers, and in this sense universal.
An important remaining question is the behavior close to the yielding point. If yielding is analogous to a phase transition, as suggested by the jamming picture Liu and Nagel (1998, 2001), it could be expected that close to it a cross-over occurs, and the scaling properties of clusters of large forces change significantly. The value of the yield stress was found to be strongly dependent on the coordination number of the contact network Snoeijer et al. (2006). On the other hand, we find that is completely independent of up to . This observation suggests the absence of any diverging or vanishing length scale which would accompany the cross-over close to . Moreover, we have not observed any dramatic change in the scaling properties close to , but additional work is necessary to clarify these issues.
TJHV acknowledges financial support from the Netherlands Organization for Scientific Research (NWO-CW) through a VIDI grant. SO is financially supported by the Dutch research organization FOM.
References
- Jaeger et al. (1996) H. M. Jaeger, S. R. Nagel, and R. P. Behringer, Rev. Mod. Phys. 68, 1259 (1996).
- de Gennes (1999) P.-G. de Gennes, Rev. Mod. Phys. 71, 374 (1999).
- Bouchaud (2003) J.-P. Bouchaud, in Les Houches, Session LXXVII, edited by J. Barrat (EDP Sciences, 2003).
- Liu and Nagel (1998) A. J. Liu and S. R. Nagel, Nature 396, 21 (1998).
- Liu and Nagel (2001) A. Liu and S. Nagel, Jamming and rheology (Taylor & Francis, 2001).
- Radjai et al. (1998) F. Radjai, D. E. Wolf, M. Jean, and J.-J. Moreau, Phys. Rev. Lett. 80, 61 (1998).
- Geng et al. (2003) J. Geng, G. Reydellet, E. Clement, and R. P. Behringer, Physica D 182, 274 (2003).
- Majmudar and Behringer (2005) T. S. Majmudar and R. P. Behringer, Nature 435, 1079 (2005).
- Atman and et al. (2005) A. Atman and et al., J. Phys. Cond. Mat. 17, S2391 (2005).
- Snoeijer et al. (2004) J. H. Snoeijer, T. J. H. Vlugt, M. van Hecke, and W. van Saarloos, Phys. Rev. Lett. 92, 054302 (2004).
- Snoeijer et al. (2006) J. H. Snoeijer, W. G. Ellenbroek, T. J. H. Vlugt, and M. van Hecke, Phys. Rev. Lett. 96, 098001 (2006).
- Tighe and et al. (2005) B. Tighe and et al., Phys. Rev. E 72, 031306 (2005).
- Ostojic et al. (2006) S. Ostojic, E. Somfai, and B. Nienhuis, Nature 439, 828 (2006).
- (14) S. Ostojic and D. Panja, Phys. Rev. Lett. in press , eprint cond-mat/0606349.
- Stauffer and Aharony (1991) D. Stauffer and A. Aharony, Introduction to Percolation Theory (Taylor & Francis, 1991).
- Privman (1990) V. Privman, Finite Size Scaling and Numerical Simulations of Statistical Physics (World Scientific, 1990).
- Binder and Wang (1989) K. Binder and J.-S. Wang, J. Stat. Phys. 55, 87 (1989).