Comment on “Orbital-selective Mott transitions in two-band Hubbard models”
Abstract
A recent paper by Blümer et al. [cond-mat/0609758] again criticizes earlier QMC/DMFT results by Liebsch [Phys. Rev. B 70, 165103 (2004)]. This criticism is shown to be unfounded.
In Ref. 1 Blümer et al. continue to criticize earlier QMC/DMFT calculations by Liebsch prb70 for the non-isotropic two-band Hubbard model. Now it is claimed: “We quantify numerical errors in earlier QMC data which had obscured the second transition” and: “The second transition is lost in the noise of earlier data [2] with errors exceeding 100 % at both transitions”.
We point out that Ref. 1 once again does not provide any comparisons of self-energies or spectral distributions [3], nor does it refer to recent work [4,5] which confirms the results of Ref. 2. A direct comparison demonstrates, as we show here, that both QMC calculations are in good agreement and that the above claims are unfounded.
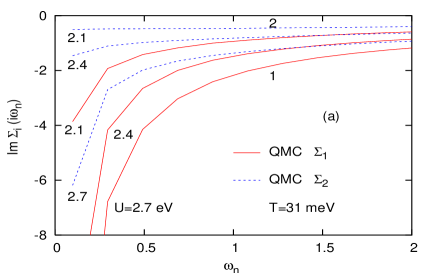
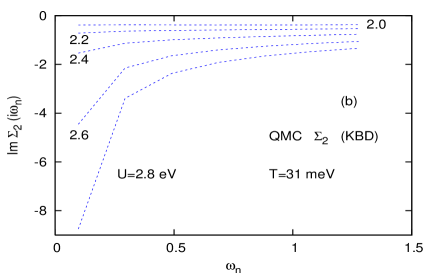
Fig. 1 shows the comparison of QMC self-energies calculated in Ref. 2 with those of Ref. 1. Fig. 2 shows analogous results obtained via exact diagonalization (ED) and numerical renormalization group (NRG) al+costi .
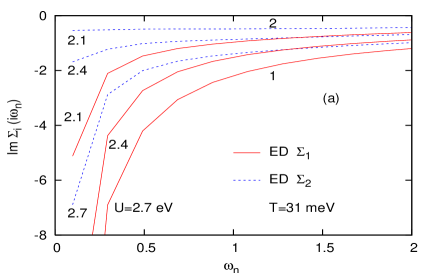
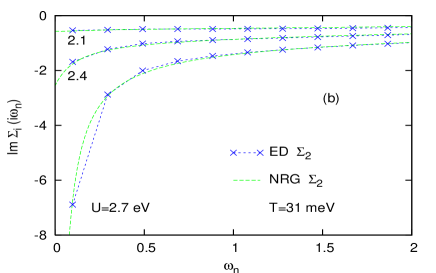
Evidently, all calculations give the same trend: When the narrow band becomes insulating, the self-energy of the wide band no longer exhibits behavior at low frequencies, as would be characteristic of a Fermi-liquid. Instead, it shows progressive bad-metallic behavior, approaching a finite value in the limit. This value grows with increasing , until it diverges near 2.7 eV. Ref. 2 states: “ becomes inversely proportional to at 2.7 eV, i.e., a gap opens up.”
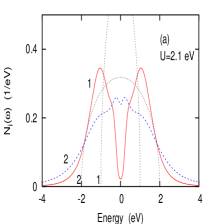
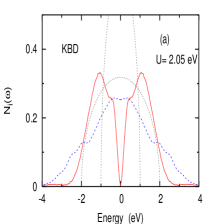
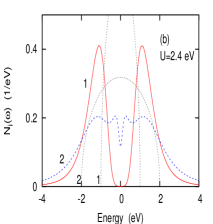
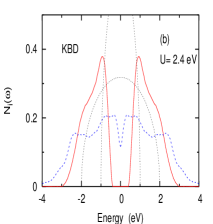
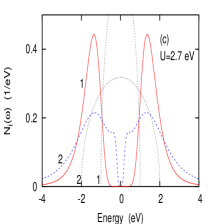
Precisely this behavior is seen in the quasi-particle spectra derived in Refs. 1 and 2 (see Fig. 3). Despite the differences caused by different maximum entropy fitting parameters, the low-frequency region is in perfect agreement. Both spectra show that, when the narrow band becomes insulating, the wide band reveals a pseudogap which gets progressively deeper with increasing , until this band becomes fully insulating near 2.7 eV.

The self-energies and spectral distributions indicate that there is good agreement between the QMC results of Refs. 1 and 2. Both describe identical physics and are consistent with the ED and NRG results. There is no evidence of any sort of disparity. Thus, the claims in Ref. 1 have no basis.
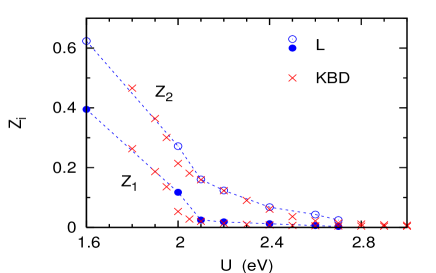
Fig. 4 compares . Again, there is good agreement, consistent with the results in Figs. 1–3. The main difference is that the Coulomb energies at which subbands become insulating are slightly lower in Ref. 1 than in Ref. 2 (see also Fig. 3).
Although the are derived from the self-energies in Fig. 1, Ref. 1 claims that (obtained by subtracting results from Refs. 1 and 2) reveals a qualitative difference: “second transition lost in noise”, etc.
A proper analysis of should, of course, include (i) the different error margins resulting from QMC statistical uncertainties, number of sweeps and time slices, and (ii) the different Coulomb energies at which subbands become insulating, for instance, as a result of a different mesh, different number of iterations and critical slowing down. These issues are particularly important when becomes singular and becomes small. Since all of this is ignored in Ref. 1, it is no surprise that the agreement seen in Fig. 4 can be turned, at specific points, into ficticious disagreement of of arbitrary magnitude.
Evidently the criticism in Ref. 1 is based on a fundamentally inadequate analysis of . Moreover, Ref. 1 does not provide the reader with direct comparisons of self-energies or spectral functions, such as given here in Figs. 1,3 or in Ref. 3, which demonstrate good agreement. Finally, Ref. 1 ignores that the QMC results of Ref. 2 were fully confirmed by ED and NRG calculations [4,5].
We conclude that the QMC/DMFT results of Ref. 2 are correct: The non-isotropic two-band Hubbard model with Ising exchange exhibits a first-order Mott transition near eV when the narrow band becomes insulating, with characteristic hysteresis behavior, and there is no sign of first-order behavior when the wide band becomes insulating near eV.
As also shown by the ED/DMFT calculations in Ref. 4, to obtain sequential first-order Mott transitions, it is essential to go beyond Ising exchange and include full Hund’s coupling.
References
- (1) N. Blümer, C. Knecht, K. Pogajić, and P. G. J. van Dongen, cond-mat/0609758 (accepted for JMMM). See also: C. Knecht, N. Blümer, and P. G. J. van Dongen (KBD), Phys. Rev. B 72, 081103(R) (2005); P. G. J. van Dongen, C. Knecht, and N. Blümer, Phys. Stat. Sol. (b) 243, 116 (2006).
- (2) A. Liebsch, Phys. Rev. B 70, 165103 (2004).
- (3) A. Liebsch, cond-mat/0506138.
- (4) A. Liebsch, Phys. Rev. Lett. 95, 116402 (2005).
- (5) A. Liebsch and T. A. Costi, Eur. Phys. J. B 51, 523 (2006).