Magnetic Excitation Spectrum of the Square Lattice S=1/2 Heisenberg Antiferromagnet K2V3O8
Abstract
We have explored the magnetic excitation spectrum of the S=1/2 square lattice Heisenberg antiferromagnet, K2V3O8 using both triple-axis and time-of-flight inelastic neutron scattering. The long-wavelength spin waves are consistent with the previously determined Hamiltonian for this material. A small energy gap of 729 eV is observed at the antiferromagnetic zone center and the near-neighbor exchange constant is determined to be 1.080.03 meV. A finite ferromagnetic interplanar coupling is observed along the crystallographic c-axis with a magnitude of Jc=-0.00360.0006 meV. However, upon approaching the zone boundary, the observed excitation spectrum deviates significantly from the expectation of linear spin wave theory resulting in split modes at the (/2,/2) zone boundary point. The effects of magnon-phonon interaction, orbital degrees of freedom, multimagnon scattering, and dilution/site randomness are considered in the context of the mode splitting. Unfortunately, no fully satisfactory explanation of this phenomenon is found and further theoretical and experimental work is needed.
pacs:
75.30.Ds, 75.50.Ee, 75.40.GbI Introduction
Quantum magnetism has been a topic of considerable interest for many decades Manousakis , with particular interest in two-dimensional systems stimulated by the discovery of high-Tc superconductivity in oxides comprised of CuO2 layers highTc . Shortly after this discovery, it was realized that the parent compounds of these superconductors are well described by the quantum (S=1/2) square lattice Heisenberg antiferromagnet (QSLHAF) Anderson ; Endoh and since then this model system has been the topic of considerable theoretical and experimental investigation.
Theoretically, there is growing consensus that the ground state of the QSLHAF is long-range ordered only at zero temperature. The dynamics of the QSLHAF are well described by classical linear spin-wave theory with quantum corrections, in the form of higher order expansions in 1/S Igarashi1 ; Singh , necessary to extract accurate physical parameters. For instance, classical spin-wave theory accurately reproduces the dynamical structure factor, S(Q,), with physical parameters, such as the spin-wave velocity, spin stiffness, and susceptibility strongly renormalized by these quantum corrections. Qualitative deviations from spin-wave theory may be manifest near the antiferromagnetic zone boundary, as shown from both quantum Monte-Carlo Sandvik and series expansion Singh ; Zheng studies. These predictions suggest a 7-9% dispersion in the magnetic excitations between the 2d zone boundary points (/2,/2) and (,0). Linear spin-wave theory predicts no dispersion between these points although recent extensions of the spin-wave calculation including up to second order corrections in 1/S show a 2% dispersion Igarashi2 , much smaller than that predicted by other theoretical techniques. The effect of temperature on this model system is to destroy the T=0 long-range order and the temperature dependence of the correlation length, which provides a measure of the degree of order, has been well studied both theoretically Chakravarty ; Kim ; Beard ; Elstner and experimentally Yamada ; Birgeneau ; Greven ; Ronnow ; Carretta . The temperature dependence of the dynamical structure factor has also been the topic of considerable theoretical effort Tyc ; Auerbach ; Takahashi ; Sokol ; Sherman ; Winterfeldt ; Nagao ; Wang ; Makivic with much less experimental effort cftd . In recent years theoretical investigations have been extended to include effects of an external applied magnetic field Yang ; Zhitomirsky1 ; Zhitomirsky2 ; Syljuasen . Perhaps the most dramatic prediction of these studies is a decay of the single magnon spectrum into a two-magnon continuum for fields sufficiently close to the saturation field Zhitomirsky2 .
As is evident in the preceding paragraph, many of the interesting theoretical studies of the QSLHAF have involved detailed calculations of the dynamical properties. These properties are directly probed by inelastic neutron scattering experiments which measure the dynamical structure factor, S(Q,). Experimental measurements have focussed on the cuprates and inelastic neutron scattering measurements have been hindered by the large characteristic energy scale (J 1500 K) of these materials. Early reactor-based measurements on the high-Tc parent compound, La2CuO4, were only able to measure the spin-wave velocity in the long-wavelength limit Shirane ; Endoh ; Aeppli . The abundance of epithermal neutrons at spallation neutron sources have allowed for measurements of the full dispersion Hayden , resulting in a near-neighbor coupling constant of 136 meV for La2CuO4. Advancement in time-of-flight instrumentation and visualization software allowed much more detailed measurements to be performed Coldea . In these experiments, the zone boundary dispersion was measured and a strong dispersion was observed between the (/2,/2) and (,0) zone boundary point but in the opposite trend to that predicted theoretically Sandvik ; Singh ; Zheng . This trend was attributed to the presence of a higher order ring exchange interaction around Cu4O4 square plaquettes Coldea , an interpretation which has been the topic of considerable interest both theoretically Peres ; Singh2 ; Katanin and experimentally Toader . In addition, several other related cuprate model systems have been studied. One of the best realizations of the QSLHAF is Sr2CuO2Cl2 where neutron scattering experiments have produced detailed measurements of the temperature dependent correlation length Greven but no studies of the dynamics have been performed to date. Another related compound, Sr2Cu3O4Cl2 is complicated by the presence of two interpenetrating square Cu2+ sublattices with very different coupling constants (JI 130 meV and JII 10 meV) and frustrated interactions between the sublattices. Kim2 . The magnetic excitation spectrum was measured in detail, for the specific range of temperatures where this material behaves as a QSLHAF with J 10 meV, and these measurements provided the first experimental evidence for the theoretically predicted dispersion between the (/2,/2) and (,0) zone boundary points Kim2 .
Temperature dependent measurements were limited by the large coupling constants in the cuprates to temperatures considerably less than J. These measurements were extended following the discovery of the metallo-organic Cu(DCOO)4D2O (CFTD) which has a much smaller coupling constant, J 6.3 meV cftd . Measurements of the correlation length were extended to temperatures comparable to J Ronnow ; Carretta and were found to be in good agreement with theoretical predictions. Inelastic neutron scattering measurements on this material cftd confirmed the theoretically predicted dispersion along the zone-boundary Sandvik ; Singh ; Zheng and also measured the temperature dependence of the dynamical structure factor. Excitations were found to persist to temperatures as high as J/2 but were found to broaden and soften upon warming cftd .
Experimental studies of the effects of an external magnetic field have been impossible due to the magnitude of the coupling constants in known model materials. Interesting theoretical predictions in the presence of an applied magnetic field require field strengths near saturation. Using the value of J, we can estimate the field required for saturation for the model systems mentioned above. The resulting saturation field for La2CuO4 is 3800 T, Sr2Cu3O4Cl2 is 350 T (4500 T) assuming the lower (higher) of the two coupling constants, and CFTD is 220 T. Clearly all of these materials are unsuitable for magnetic field measurements. Recently, a family of metallo-organics have been synthesized with much smaller coupling constants giving rise to saturation fields ranging from 2.25-25 T Woodward . Unfortunately, these materials have rather strong three-dimensional interactions and are also problematic for inelastic neutron scattering experiments as it has proven very difficult to grow large, deuterated single crystals. One particularly attractive material, and the topic of this communication, is K2V3O8 which has a saturation field of 38 T, experimentally achievable for some experiments.
In this manuscript, we present detailed inelastic neutron scattering measurements and analysis of the zero-field magnetic excitation spectrum of K2V3O8. Such studies are not only essential to understand future results obtained in the presence of a finite applied magnetic field but are quite interesting in their own right. Comparison of the measured spectrum to the predictions of classical linear spin-wave theory has proven very interesting in other model systems as emphasized by the opposing trend in the zone boundary dispersions observed in La2CuO4 Coldea and CFTD Ronnow . The zone boundary dispersion observed K2V3O8 is different than that observed in any of the previously explored model systems or predicted in theoretical studies, displaying two modes in the excitation spectrum in the immediate vicinity of the zone boundary. The remainder of the paper will be organized in the following manner; we begin by discussing the properties of K2V3O8 (Section II) followed by a description of the details of the inelastic neutron scattering experiments (Section III). The experimental results are described in Section IV for spin-waves in the long-wavelength limit which is fully consistent with the prediction of linear spin-wave theory. In Section V the experimental results near the zone boundary are described showing the evidence for the two modes in the excitation spectrum. Several possible sources of the observed zone boundary mode splitting will be discussed in Section VI followed by conclusions in Section VII.
II K2V3O8: General Properties
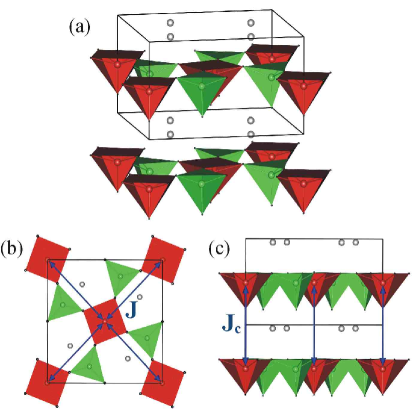
K2V3O8 crystallizes in the fresnoite structure with tetragonal space group P4bm and lattice constants a=8.87 Å and c=5.2 ÅGaly . The room temperature structure, shown in Fig. 1, consists of vanadium oxide planes composed of S=1/2, V4+-O5 square pyramids and nonmagnetic V5+-O4 tetrahedra. The intralayer coupling constant, , is small due to the long V4+-O-O-V4+ superexchange path as can be seen in Fig. 1b which also shows the square arrangement of the V4+ ions. The 2d nature of the magnetic system results from layers of K+ ions which separate the vanadium oxide layers. Powder magnetization measurements were well described by the QSLHAF with a small near neighbor coupling constant of 1.09 meV Liu . This material is found to order magnetically with TN=4 K Lumsden indicating a finite interlayer coupling (Fig. 1c). The magnetic structure in the absence of an applied magnetic field is a simple two-sublattice antiferromagnetic arrangement with spins aligned along the crystallographic -axis with ferromagnetic stacking of the 2d layers Lumsden . A non-zero magnetic field results in phase transitions when applied along both the -axis and in the tetragonal basal plane. The -axis field induced phase transition is a rather conventional spin-flop transition while the presence of a basal plane applied field induces a peculiar spin reorientation transition where the spins rotate from the easy -axis into the basal plane while remaining normal to the applied field direction. These observations were described by the following two-dimensional Hamiltonian which includes a Dzyaloshinskii-Moriya (DM) interaction and an additional -axis anisotropy Lumsden ,
| (1) | |||||
where represents near-neighbor pairs of spins, and , are the spin operators for sites ,. The applied field required to induce both the basal plane spin reorientation and the -axis spin flop transition allowed for estimates of of 0.0012 and of 0.04.
Thermal conductivity measurements on K2V3O8 indicate dramatic enhancements in the low temperature heat transport in the presence of an applied magnetic field Sales . These same measurements indicate anomalies at 110 K Sales suggesting a phase transition at this temperature. Optical measurements clearly show anomalies in the local structure of the VO5 square pyramids on passing through 110 K Choi indicating the structural nature of this phase transition.
Recently, a more comprehensive theoretical treatment of the magnetic properties of K2V3O8 has been carried out Chernyshev . This work pointed out that weak ferromagnetism induced by the DM interaction is “hidden” in K2V3O8 in the zero field limit by a dominant -axis anisotropy. The effects of the DM interaction are revealed in the presence of an applied magnetic field and analytic expressions for the field strength required to induce both the spin-flop and spin reorientation transitions were provided. The field dependence of gap energies in the magnetic excitations were calculated and the effects of quantum corrections were included. One interesting theoretical prediction is a non-linear form for the gap energy as a function of field applied in the basal plane.
The topic of this manuscript will be inelastic neutron scattering measurements in the limit of zero applied magnetic field. If we set H=0 in Eq. 1 and add a ferromagnetic coupling between the 2d layers, as expected from the known zero-field magnetic structure, linear spin-wave theory applied to the resulting Hamiltonian yields two degenerate spin wave modes with dispersion,
| (2) |
where
| (3) |
Here, we introduce an effective coupling constant, where represents the quantum renormalization of the coupling constant with a best theoretical estimate of =1.18 Igarashi1 ; Singh . Note that as a consistency check, if we set ===0, we recover the result for the QSLHAF,
| (4) |
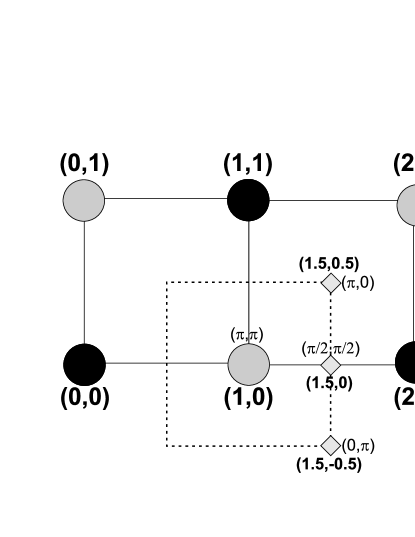
where the unit cell is rotated by 45∘ from the conventional square lattice unit cell (see Fig. 2).
Inelastic neutron scattering experiments measure a convolution of the instrumental resolution function with the partial differential cross-section,
| (5) |
where and are the magnitudes of the incident and final neutron wavevectors, F(Q) is the magnetic form factor, in this case for V4+, is the Bose occupation factor, is a polarization term reflecting the spin direction ( is the angle between and the easy -axis) and is the dynamical structure factor. Spin wave theory applied to the above Hamiltonian yields
| (6) |
III Experimental Details
About 100 grams of V2O5 (99.995%) and 76 grams of K2CO3 (99.997%) was loaded into a 250 ml Pt crucible and slowly heated in air to 700∘C and held for 2 hours. The powder was added in two stages because of substantial foaming. The molten KVO3 flux was then cooled to room temperature and the Pt crucible and solidified KVO3 loaded into a fused silica ampoule that is necked down at the top. Using a long funnel, 9 grams of VO2 (99%) was added to the Pt crucible and the entire ampoule was evacuated and sealed. The sealed ampoule was loaded into a furnace, heated to 850 ∘C for 6 hours, cooled to 700 C over 1h and then cooled to about 400 ∘C at 1 ∘C/h, followed by furnace cooling to room temperature. The KVO3 flux was then removed with a combination of warm water and ultrasonic vibration. The resulting K2V3O8 crystals are black rectangular plates with typical dimensions of 5 x 5 x 1 mm3.
Inelastic neutron scattering experiments on single crystal samples were performed using the backscattering spectrometer, IRIS at the ISIS neutron scattering facility, the RITA II triple-axis spectrometer at the Paul-Scherrer Institut and the SPINS triple-axis spectrometer at the NIST Center for Neutron Research. The IRIS and RITA II experiments were performed on an array of 40 single crystals visually co-aligned with a total mosaic spread of about 4∘. Improvements in crystal size allowed the SPINS experiment to be performed on an array of 5 single crystals which were much more accurately co-aligned with a final mosaic spread of about 0.5∘. For all experiments, the crystals were mounted on an aluminum sample mount which was connected to the cold finger of a 4He cryostat with a minimum temperature of about 1.5 K. The IRIS experiments used PG (002) to select a fixed Ef of 1.845 meV yielding a resolution of 18 eV at the elastic position. Measurements were performed using two sets of chopper settings allowing for studies with energy transfers covering a range from -0.2 to 1.2 meV and 0.5 to 2.8 meV respectively. Both the RITA II and SPINS triple-axis spectrometers used PG (002) as the monochromator with pre-monochromator collimation determined by the presence of a neutron guide and an 80’ post-monochromator collimator. The majority of measurements were performed with a fixed final energy of 5 meV and a cooled Be filter before the analyzer resulting in an energy resolution of 0.25 meV at the elastic position. Both instruments employ a multiblade PG (002) analyzer configuration and measurements were made with this analyzer array either in a flat or focussing configuration.
For means of reference, we have included a map of reciprocal space in Figure 2 with nuclear zone centers indicated by black circles, antiferromagnetic zone centers by gray circles, and several high symmetry antiferromagnetic zone boundary points by gray diamonds. To allow for easier comparison with previous measurements, the relevant region of reciprocal space is labelled by both and for K2V3O8 together with the labels for the conventional square lattice. This labelling clearly shows that the unit cell of K2V3O8 is rotated by 45∘ from the square lattice unit cell.
IV Results: Long Wavelength Excitations
One clear prediction of the dispersion shown in Eq. 2 is the presence of an energy gap at the antiferromagnetic zone center of,
| (7) |
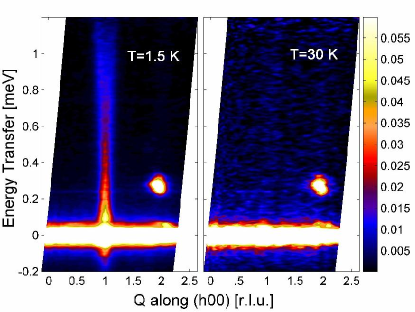
Using the previously determined experimental values for , , and Lumsden , together with the expected quantum correction =1.18 Igarashi1 ; Singh we expect this energy gap to be about 73 eV. In order to explore the low energy region of the dispersion, we performed initial measurements on the IRIS backscattering spectrometer. For these measurements, the sample was mounted in the ( 0 ) scattering plane. Measurements of the low energy portion of the magnetic excitation spectrum at temperatures of 1.5 K and 30 K are shown in Figure 3. This plot shows the inelastic intensity as a color map as a function of component of momentum transfer along the ( 0 0) direction and energy transfer. The excitations, clearly seen in the T=1.5 K data, are found to vanish at higher temperatures providing clear evidence of their magnetic nature. The temperature independent bright intensity spot observed near =1.8 and E=0.25 meV is a spurious feature, not uncommon in an inverse geometry, time-of-flight spectrometer where a white beam is incident on the sample, related to a nearby (2,0,1) structural Bragg reflection.
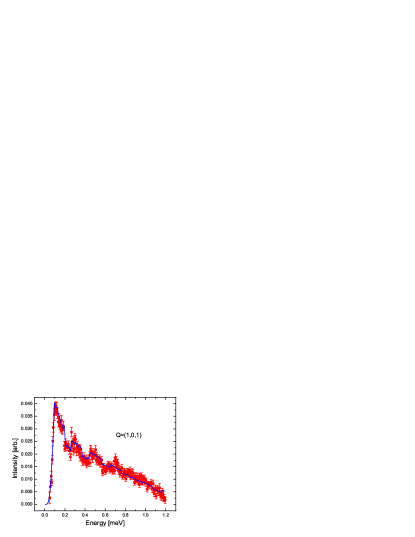
Careful examination of Figure 3 suggests a slight reduction in inelastic intensity as the energy approaches the elastic position which may be an indication of a gap in the excitation spectrum. To see this more clearly, an energy dependent background was subtracted from the data shown in Figure 3 and an energy dependent cut through this background subtracted data for h ranging from 0.9 to 1.1 is shown in Figure 4. This plot clearly shows a gap in the excitation spectrum which appears to about 100 eV. The solid line shown in Figure 4 represents the cross-section of Eq. 5 convoluted with the instrumental resolution function of the IRIS spectrometer. The line is in excellent agreement with the measured data and allows extraction of a zone center energy gap of 729 eV. As can be clearly seen from Eq. 7, the value of the gap cannot uniquely define both and . If we arbitrarily fix to value of 0.04 Lumsden and use a value of of 1.275 (as will be shown later), we extract a value of the -axis anisotropy of =0.00120.0001 consistent with the value determined previously from the locations of the field-dependent phase transitions Lumsden . On a technical note, the apparent jumps in the data shown in Figure 4 result from the small number of detectors present on IRIS and these jumps are quite accurately reproduced in the simulated scattering, shown by the solid line in Figure 4, when the instrumental resolution and detector configuration are properly taken into account.
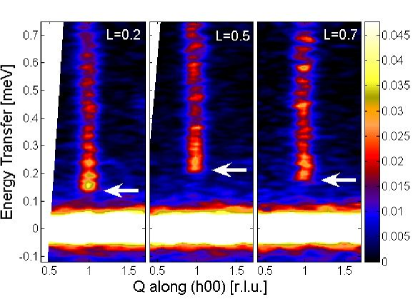
The same experimental configuration on IRIS can also be used to measure the dispersion perpendicular to the 2d planes. This is accomplished by measuring the same spectrum at several different sample rotations and the results are shown for 0.2,0.5 and 0.7 in Figure 5. Note that these designations for are only valid in the elastic position and actually varies across the contour plot. Nonetheless, the dispersion along the -axis can clearly be seen in this plot as a variation in the gap represented by the arrows in Figure 5. To quantitatively extract the dispersion along the -axis, the same cut along energy (for ranging from 0.9 to 1.1) at several different sample angles is shown in Figure 6. The solid lines shown in the figure represent a numerical convolution of the cross-section (Eq. 5) with the instrumental resolution. Once again, we see good agreement between the measured data and the simulation for all sample rotation angles measured. The grey vertical bars shown in each panel represent the location of the energy gap for the appropriate -value clearly showing the -axis dispersion. The fits allow us to extract a value of the interplanar coupling of =-0.00280.0005 reflecting the two dimensionality of the material. Note that the negative sign indicates the ferromagnetic nature of the interaction consistent with the observed magnetic structure Lumsden .
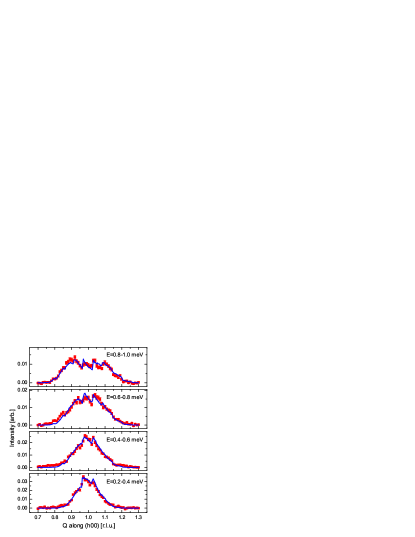
While IRIS is an ideal instrument for measuring features associated with the energy gap, due to extremely good energy resolution, it has Q-resolution limitations resulting from the small number of detectors on the instrument and the large angle accepted by each analyzer crystal each of which scatters into a single detector. To see this, we plot cuts along the (h00) direction for several ranges of energy transfer in Figure 7 together with the corresponding numerical convolution of the expected cross-section (Eq. 5) with the instrumental resolution function. While the simulation is seen to agree well with the measured data, it is extremely difficult to resolve the excitations and, hence, to extract physical parameters from these fits due to limited Q resolution.
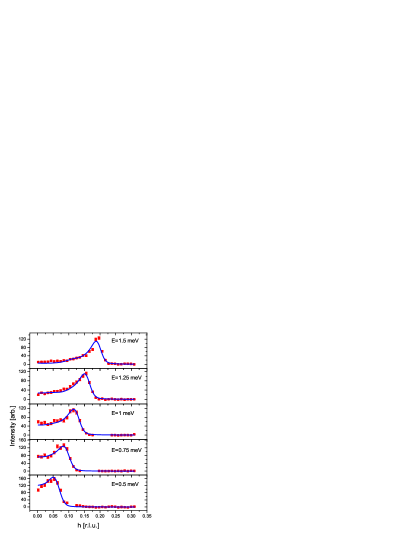
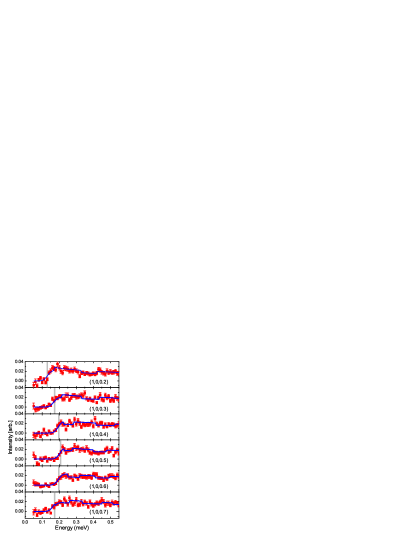
To extract information about the coupling constant, measurements were performed on the SPINS and RITA II triple-axis spectrometers. The multiblade analyzer system was configured in a horizontally focussing configuration for these measurements which increases intensity while maintaining good energy resolution at the sacrifice of Q resolution in the direction perpendicular to . The results shown in Figure 8 represent constant-E scans performed with the sample mounted in the (,,0) plane using the SPINS triple-axis spectrometer. These measurements were performed along the (,1,0) direction which corresponds to the direction from (,) (for h=0) toward the antiferromagnetic zone boundary, (/2,/2) (for h=0.5). The much better Q resolution of the triple-axis spectrometer can be seen from the clearly dispersive mode in the data shown in Fig. 8. The use of the horizontally focussing configuration made analysis of the data complicated in this case. Typically, this configuration is used with an irrelevant direction in the scattering plane which can be oriented along the direction perpendicular to . However, in these measurements, both directions within the (,,0) plane are strongly dispersive. This complicated the analysis as typical Gaussian approximations to the resolution function were not able to reproduce the sharp features observed in the data. Consequently, the cross-section appropriate to K2V3O8 (Eq. 5), was convolved with the resolution function for each of the 7 individual analyzer blades and the contribution from each blade was added with the correct phase to yield the solid lines shown in Figure 8. To correctly duplicate the effective collimation introduced by the small width of the individual analyzer blades, the more rigorous Popovici approximation Popovici to the triple-axis resolution function was required. Several scans ranging from 0.5 meV to 1.5 meV were simultaneously fit with a single overall amplitude clearly showing that intensity modulation represented by (Eq. 6) provides an excellent description of the data. This analysis allowed extraction of the 2d coupling constant of 1.2750.03 meV.
As mentioned previously, the coupling constant, , is written as an effective coupling and theoretical studies indicate that quantum corrections to spin-wave theory result in an overall renormalization of the dispersion by a scaling factor such that = Igarashi1 ; Singh . As a consistency check, we can calculate the value of by comparing the coupling constant above to the value of =1.09 meV obtained from magnetization measurements Liu where quantum effects were taken into account. This results in =1.1740.03, in excellent agreement with the best theoretical estimate of of 1.18 Igarashi1 ; Singh justifying the designation of K2V3O8 as a good example of a QSLHAF. Using the theoretical value for , we can extract the true coupling constant, , for K2V3O8 of 1.080.03 meV.
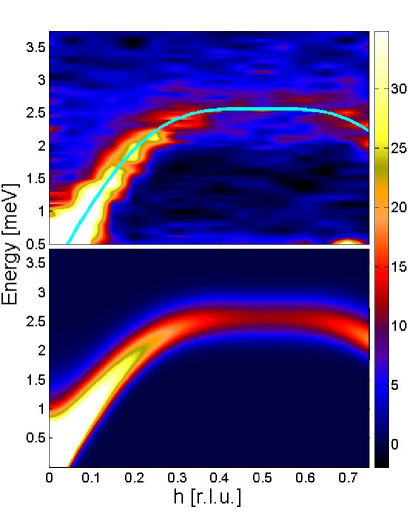
Measurements of the dispersion were additionally performed along the square lattice direction (,) to (,0) corresponding to the (,1+,0) direction in K2V3O8. Measurements along this direction were performed using the RITA II triple-axis spectrometer with the sample mounted in the (,,0) scattering plane and the results are shown in the upper panel of Figure 9. The solid line in the upper panel represents the classical spin wave dispersion with =1.275 meV which clearly describes the data well. The lower panel represents the best fit to a convolution of Eq. 5 with the instrumental resolution function with the dispersion represented by the solid line in the upper panel. The fits agree very well with the data across the entire zone except in the immediate vicinity of the zone boundary where the peak intensity appears weaker than the calculated peak value. The behavior near the zone boundary will be discussed in more detail in the next section.
V Results: Short Wavelength Behavior
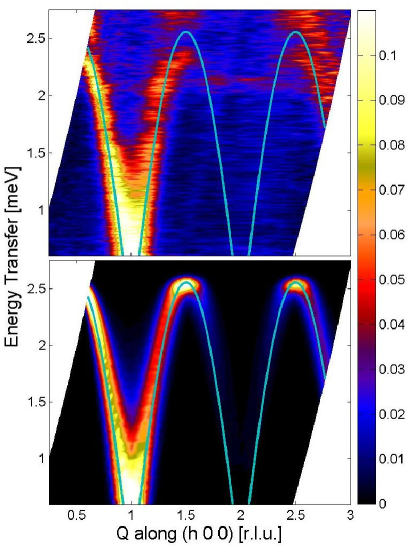
As mentioned in the introduction, the dynamical structure factor of the QSLHAF only deviates from predictions of spin-wave theory near the antiferromagnetic zone boundary. Consequently, to explore the behavior in the vicinity of the zone boundary more carefully, measurements on IRIS were extended with the choppers configured to select a range of energy transfers from 0.5 to 2.8 meV and the resulting data are shown in the upper panel of Figure 10. As can be clearly seen from the data, we observe well defined excitations up to the zone boundary. However, as can be seen from the solid line in the upper panel, the dispersion curve which describes the data well near the zone center seems to disagree with the data near the zone boundary. In the lower panel of Figure 10, we show the result of a convolution of the instrumental resolution with the expected cross-section together with the dispersion curve used to generate the simulation. In comparing this to the measured data, it is also clear that once the amplitude is set to provide good agreement with the data near the zone center, the calculated intensity near the zone boundary exceeds that of the measurement. However, closer examination of the measured intensity indicates the presence of two modes with intensity in the second mode only appearing near the zone boundary.
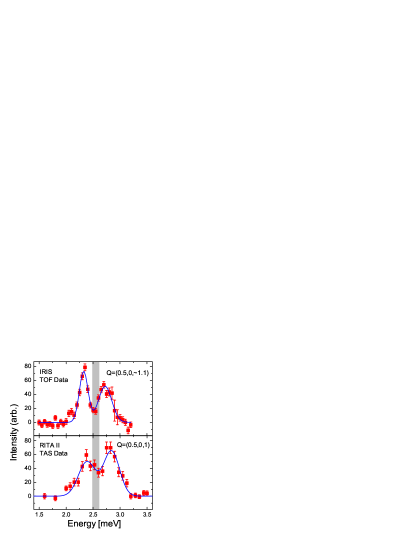
Instrumentally, the IRIS spectrometer exhibits various spurious scattering features around 3 meV energy transfer. The presence of these features led to scepticism as to the validity of the observed two modes near the zone boundary. To confirm this observation, measurements were performed in the identical (,0,) scattering plane using the RITA II triple-axis spectrometer. The instrument was configured with Ef=4.6 meV and the resulting constant-Q scan at Q=(0.5,0,1) is shown in the lower panel of Figure 11. In the upper panel, we show a cut through the IRIS data from =0.4 to =0.6 with the sample slightly rotated from the measurement shown in Figure 10 so as to emphasize the data near =0.5. Both the time-of-flight and triple-axis data clearly show the presence of two peaks near the zone boundary. For reference, the gray box represents the predicted zone boundary energy corresponding to =1.275 meV with the width of the box corresponding to the uncertainty of 0.03 meV. Clearly, in both measurements, the calculated value of the zone boundary energy falls between the two measured peaks. Note that the exact energies of the two modes differ slightly between the two instruments, a discrepancy which can be accounted for by differences in energy calibration.
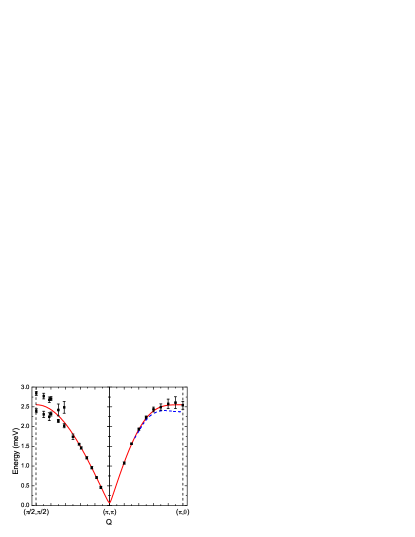
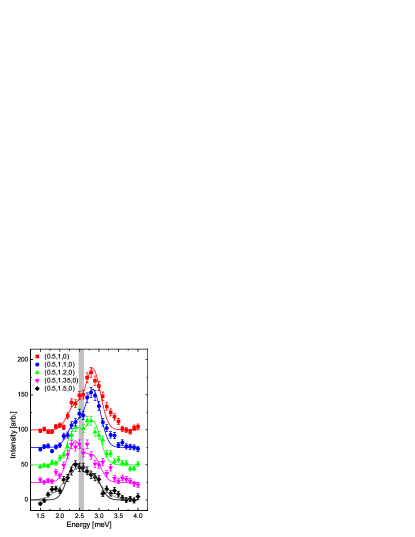
The full dispersion, measured using triple-axis spectrometers along high symmetry directions in the 2d plane, is summarized in Figure 12 with Q plotted in square lattice notation. The data shown in this figure are the result of experiments performed using both the RITA II and SPINS triple-axis spectrometers with the sample oriented in both the (,,0) and (,0,) scattering planes. The measured data along the (,) - (,0) direction and near the zone center along the (,) - (/2,/2) were fit to the expected S(Q,) convolved with the instrumental resolution function. The amplitude, coupling constant, and a Lorentzian broadening term were allowed to vary for each of these data points. As this model no longer describes the data well near the (/2,/2) zone boundary point, the data here was fit to Gaussian lineshapes with widths constrained to be broader than that expected from resolution. The solid line is the expected classical dispersion (Eq. 2) with =1.275 meV, Dz/=0.04, E/=0.0012, and Jc/=-0.0028. This solid line is seen to agree well with the data near the zone center but deviates on approaching the (/2,/2) zone boundary point. As the data begins to deviate from the solid line, an additional mode appears. As reflected by the size of the error bars, this mode is rather weak when it first appears and gains intensity on approaching the zone boundary. As shown previously in Figure 11, the calculated dispersion falls between the two modes on approaching (/2,/2). There is no clear evidence for two peaks near the (,0) zone boundary point. However, as indicated by the large error bars near this point, the measured spectrum is broader than would be expected from resolution. The dashed line represents the expected quantum dispersion Ronnow . While it does appear that the data agrees better with the classical dispersion, there very well may be two modes near the (,0) zone boundary point as well. As such, the points shown on the dispersion may represent the mid point of the two modes the lower of which would be quite close to the quantum dispersion.
As mentioned in the introduction, the one region where measurements and quantum calculations on the QSLHAF deviate from the predictions of spin-wave theory is in measuring the zone boundary energy along the direction (/2,/2) to (,0). Consequently, we have measured the excitations along this direction using the SPINS triple-axis spectrometer to study the evolution of the observed two modes and the result is shown in Figure 13. For reference, as shown in Figure 2, Q=(0.5,1,0) corresponds to the square lattice point (/2,/2) while Q=(0.5,1.5,0) corresponds to (,0). The presence of two modes can also be seen in this scattering plane. To further emphasize this, the solid lines in the figure are the results of two Gaussians centered at the positions measured under higher resolution conditions, shown in Fig. 11, with fixed widths and only the amplitudes of the Gaussians varying. The results clearly show an intensity distribution which varies across the zone boundary with the higher energy mode having its greatest intensity near (0.5,1,0) and continuously decreasing on approaching (0.5,1.5,0). In fact, although this two mode model still describes the data fairly well near (0.5,1.5,0), a better description, as shown by the solid gray line is that of a broadened Gaussian. This is consistent with the previously presented data showing the dispersion along the (,1+,0) direction (Fig. 9 and 12) which suggests only a single mode along this direction albeit with increased width near the zone boundary. As mentioned previously, there may be two modes in this direction as well and the weaker intensity of the upper mode may act to increase the difficultly in resolving the individual modes. For reference, the solid gray bar in Figure 13 shows the range of values for the zone boundary energy given by the dispersion of Eq. 2 with =1.275 meV. The width of this bar is reflective of the uncertainty in the predicted classical zone boundary energy and is approximately 5%. Theoretically, dispersion between (/2,/2) and (,0) is predicted to be 7-9%, less than twice the width of the bar. Clearly, the measured data near the zone boundary is far too broad to allow observation of such a small zone boundary dispersion and the presence of the unexpected two modes makes such an investigation meaningless.
VI Origin of Splitting
VI.1 Magnon-Phonon Interaction
The observation of two modes near the zone boundary is clearly not expected from the Hamiltonian postulated for K2V3O8 (Eq. 1). We have experimentally characterized the zone boundary properties quite extensively. The higher energy mode only seems to have significant spectral weight in the immediate vicinity of the zone boundary. We have tried fitting the data closer to the zone center using a model incorporating two dispersive modes and no significant improvement in fit quality was observed supporting the notion that the high energy mode is only significant near the zone boundary. In addition, the presence of two modes is much clearer near Q=(0.5,1,0) (or (/2,/2) in square lattice notation) and the intensity of the upper mode falls off continuously in moving away from this position along the zone boundary. Eventually, this evolves into what is best described as a broadened single peak at Q=(0.5,1.5,0) ((,0) in square lattice notation). In addition, both modes vanish upon increasing the temperature to 30 K indicating that both are of magnetic origin. This rules out the possibility of a low-lying phonon mode interacting with the spin waves. Any proposed model to describe the observed scattering must satisfy these experimental observations.
VI.2 Additional Magnetic Interactions
Although we haven’t determined a single, consistent explanation for the peculiar zone boundary properties of K2V3O8, there are a number of possible explanations which we can discuss. Of course, the first possibility is that of additional couplings in the Hamiltonian. Longer range interaction do, in fact, tend to manifest themselves near the zone boundary Coldea . Although we can’t rule out such a possibility, it is difficult to conceive of a coupling term which will only produce intensity near the zone boundary. The particular case of next-near-neighbor coupling has been studied quite extensively using both linear spin-wave theory Merino and series expansion techniques Zheng2 . Although the inclusion of such a coupling term does modify the dispersion, with the largest effects observed near the zone boundary, no evidence for a split excitation spectrum is predicted Merino ; Zheng2 . The symmetry arguments presented by Bogdanov et al. Bogdanov suggest that K2V3O8 together with Ba2CuGe2O7 Zheludev1 ; Zheludev2 are members of an interesting class of compounds where chiral inhomogeneous magnetic structures can coexist with weak ferromagnetism. The net result of this symmetry analysis is the existence of an additional, symmetry allowed term in the Hamiltonian describing K2V3O8. The form of this chiral coupling term is rather complicated and its effects on the excitation spectrum are unclear at this point indicating the need for further theoretical investigations.
VI.3 Multimagnon Scattering
Another possible explanation for the additional scattering observed at the zone boundary is multi-magnon scattering. A recent theoretical investigation Syljuasen based on the assumption that high-energy fermions exist in the QSLHAF suggest a very structured multi-magnon continuum resulting in a rather sharply peaked extra mode around the (/2,/2) point and much broader scattering around (,0) in qualitative agreement with our experimental observations. However, the strength of the scattering in the additional mode makes such an interpretation very unlikely. Theoretical studies using both series expansion Zheng and quantum Monte Carlo Sandvik indicate a significant amount of spectral weight in the multi-magnon spectrum. The calculated ratio of the longitudinal to transverse structure factors for unpolarized neutrons is 29% (34%) at (,0) while at (/2,/2) the ratio is 31% (35%) where the values quoted are the results of series expansion Zheng (quantum Monte Carlo Sandvik ) studies. Although these values are rather large reflecting the strength of the multi-magnon scattering expected for the QSLHAF, they are somewhat deceiving in that they assume that neutron scattering will fully measure two transverse modes and one longitudinal mode. In reality, the neutron only sees components of magnetic moment normal to the wavevector transfer resulting in a correction term which has the form for the two transverse modes and for the longitudinal mode where is the angle between Q and the spin direction, in this case the -axis. For the results presented in Figure 11 the angle between the (0.5,0,1) direction and the -axis is about 30 degrees resulting in a correction term of 1.75 for the two transverse modes and 0.25 for the longitudinal mode. This implies, at this wavevector, that instead of seeing about 30% of the intensity, as predicted for the calculation under the assumption of a 1:2 ratio of longitudinal to transverse we would actually see 30%*2*0.25/1.75 8.5%. Clearly, the measurement at (0.5,0,1) shows intensities for the two modes which are very similar in magnitude and is not consistent with the upper mode being 8.5% of the lower mode. This essentially eliminates multi-magnon scattering as a source for the additional mode.
VI.4 Orbital Effects
Another possible source for the observed mode splitting is the influence of orbital degrees of freedom. Examination of the dispersion curve (Fig. 12) is qualitatively consistent with the behavior expected if a flat mode were interacting with the spin wave dispersion resulting in repulsion of the modes. In addition, a flat excitation with a weak neutron structure factor which was enhanced through mixing with the spin-wave mode could explain the observed intensity modulation. One potential source of such a flat mode would be a low-lying crystal field excitation. A related effect was predicted theoretically using a generalized Holstein Primakoff transformation of the magnetic excitations in a system with spin and orbital degrees of freedom in the presence of orbital degeneracy Joshi . The net result of inclusion of orbital degrees of freedom is an excitation spectrum with modes of pure spin, pure orbital, and mixed spin-orbital character Joshi . Mixing is predicted between the spin and spin-orbital modes the strength of which is greatest near the zone boundary and weaker near the zone center. The scenarios postulated above require an understanding of the crystal-field ground state together with the approximate energies for the lowest excitations from this ground state.
Symmetry analysis of the local square-pyramidal environment of the V4+ ion yields a splitting of the octahedral levels into a singlet () and a doublet (, ) and the octahedral states into two singlets ( and ). Consequently, the only possibility of an orbitally degenerate ground state would the , doublet. In an ideal square pyramidal geometry, where the cation sits in the center of the square plane of the pyramid, this doublet is indeed the ground state. However, for O5 square pyramids, the cation is significantly displaced from this square plane which lowers the energy of the singlet relative to that of the doublet. Consequently, the detailed structural arrangement needs to be taken into account to determine the orbital ground state. Ohama et. al Ohama calculated the crystal field splitting as a function of displacement of the cation from the basal plane under the assumption of a ideal square pyramid with equal V-O distances of 1.9 Å. This calculation suggests that when the distance exceeds about 0.35 Å, the singlet is the crystal field ground state. As the true distance for K2V3O8 is 0.55 Å, this calculation suggests a non-degenerate singlet crystal field ground state ruling out the above scenario of a mixed spin-orbital mode.
To rule out the possibility of low-lying crystal field modes, we must consider the splitting between the ground state and the , lowest excited states in a more quantitative sense. Recent interest in S=1/2 systems where quantum effects are significant have resulted in several materials exhibiting V4+O5 square pyramidal local structure Ueda . Detailed molecular orbital calculations for -NaV2O5, CaV2O5, and MgV2O5 Koo all of which exhibit square pyramidal geometry similar to K2V3O8 confirms the ground state and estimates a rather large splitting to the lowest excited state ranging from 600-900 meV. Evidence of this large crystal field splitting is also seen in band structure calculations for several square-pyramidal V4+ vanadates where the bands are well separated from the remainder of the bands Pickett ; Valenti1 ; Smolinskii ; Valenti2 ; Rosner . Similar calculations performed on K2V3O8 Rai show a very similar splitting of the bands suggesting a rather large crystal field splitting. One particular compound of note is Li2VOSiO4 Melzi which has a crystal structure where V-O distances within the square pyramid are almost identical to K2V3O8. For this compound, an experimental estimate of the splitting between the ground state and first crystal field excited state yielded a splitting of 150 meV Melzi while LDA band structure calculations estimated this value to be 400 meV Rosner . The local structural similarity between K2V3O8 and these other vanadates together with the evidence for rather large splitting in all of these materials, is very strong evidence of splitting between the ground state and the , lowest lying excited state for K2V3O8 which is on the order of hundreds of meV. A splitting of this magnitude together with the non-degenerate orbital ground state eliminates orbital effects from playing a significant role on the mode splitting observed at much lower energies (3 meV). As a caveat, it is important to note that the crystal field splitting in K2V3O8 has not been directly measured experimentally and the above arguments are based purely on comparison with other related vanadate systems together with band structure calculations.
VI.5 Dilution/Randomness
The measured anomalies near the zone boundary in the magnetic excitation spectrum of K2V3O8 are strikingly similar to the calculated excitation spectrum for site diluted 2d antiferromagnets disorder1 ; disorder2 . Studies of the effects of disorder on lattice models orbach_review showed the development of localized modes, named fractons disorder3 with increasing disorder. Similar localized modes were predicted to exist in studies of the effects of disorder on Heisenberg ferromagnets and antiferromagnets orbach_review . Fractons have little impact on the excitation spectrum at longer wavelengths as this effectively averages over enough sites to make dilution effects negligible. However, as the characteristic distance becomes smaller on approaching the zone boundary, the influence of these fractons becomes much more significant and theoretical predictions Aharony suggest a multi-peaked spectrum on approaching the zone boundary. Experimentally, inelastic neutron scattering experiments on the 3d antiferromagnet, MnxZn1-xF2 Uemura and the 2d antiferromagnet, Rb2MnxMg1-xF4 Cowley , provided clear evidence for the multi-peaked nature of S(Q,) in the presence of substantial disorder with concentrations in both cases very close to the percolation limit.
Recently, detailed calculations of S(Q,) have been presented for the site diluted 2d Heisenberg antiferromagnet disorder1 ; disorder2 . These calculations show behavior which is similar to the undiluted case at long wavelengths, albeit with a renormalized spin-wave velocity disorder1 , with a crossover on approaching the zone boundary to a multi-peaked spectrum disorder1 ; disorder2 the form of which is very similar to the experimental observations presented here for K2V3O8. Specifically, at the zone boundary, the theoretical predictions show two modes at weaker doping concentrations, with a splitting between the modes which is largely independent of doping level. This theoretical splitting is 0.6 meV using the experimental parameters of K2V3O8 which can be compared to the experimentally measured splitting in K2V3O8 of 0.45 meV. These values are in fairly good agreement, particularly given that anisotropy, interplanar coupling, and quantum effects haven’t been accounted for in the theoretical models disorder1 ; disorder2 . There are, however, some differences between the experimental observations and the theoretical predictions which should be pointed out. First, the calculated S(Q,) disorder1 ; disorder2 contains two modes on approaching both the (/2,/2) and (,0) zone boundary points while the experimental observations only show a clear splitting near (/2,/2) with what is best described as broadening near (,0). In addition, the calculations shown to date make no predictions of how S(Q,) varies along the zone boundary direction (/2,/2)-(,0). Consequently, it is unclear as to whether the experimentally observed spectral weight shift can be described by this model. Clearly, further theoretical work is needed to determine if the qualitative comparison to the site dilution model is able to describe the anomalous features seen in the excitation spectrum of K2V3O8.
The obvious question that arises, however, is why there would be significant disorder in K2V3O8. This material is a mixed valence material with an average valence of 4.667, containing both magnetic V4+ and non-magnetic V5+. Crystallographically, the three Vanadium positions in each formula unit are comprised of 2 tetrahedrally coordinated sites and 1 pyramidally coordinated site. The simplest manner of getting the correct overall valence is to have the V5+ located on the tetrahedral site and the V4+ on the pyramidal site and this is the assumed charge ordering scheme. However, there is no strict experimental proof that such an ordering occurs in K2V3O8 and some valence mixing on the pyramidal site could result in disorder effects. Other mixed valence vanadates, most notably -NaV2O5 are strongly influenced by charge disproportionation and the resulting charge degrees of freedom Smolinskii ; nav2o5b . More detailed experimental studies are necessary to explore the possibility of site disorder in the low temperature state of K2V3O8.
VI.6 Structural Distortion
One final experimental note of potential importance is the recent observation of a higher temperature phase transition (T110 K) in K2V3O8 Sales . This transition is clearly structural in nature, as evidenced by changes in the vibrational properties Choi . Compounds such as K2V3O8 with the fresnoite structure are typically sensitive to displacive structural phase transitions resulting in incommensurately modulated structures Withers . In most systems, the incommensurate modulation is along the (1,1,0) crystallographic direction and usually results in a modulation wavevector of Q0.3(1,1,0) or Q0.3(1,1,0)+0.5. Very recent crystallographic measurements on K2V3O8 indicates the presence of such a displacive transition with superlattice peaks seen in x-ray diffraction studies with wavevector Q0.3(1,1,0)+0.5 Chako . Experimentally, no direct evidence for this changed periodicity is observed in the inelastic neutron scattering measurements. The presence of an incommensurate structural modulation will affect the interactions between near-neighbor spins via a long-wavelength modulation of the superexchange interactions. The effects of periodic modulations of exchange interactions has received some attention in recent years in investigating the effects of stripe order on the magnetic interactions in cuprates stripe1 ; stripe2 ; stripe3 . A recent theoretical investigation described the modification of the Hamiltonian required to account for such an exchange constants modulation in the limit of weak modulation strength Zaliznyak . This study suggests that simple model systems, for instance, conventional antiferromagnets such as K2V3O8, would be insensitive to small long-wavelength modulations of the exchange constants. It should be noted, however, that this study focussed on the ground state properties and not more subtle changes to the spin-wave spectrum. In addition, this study assumes a weak modulation of the exchange which need not be the case. More theoretical effort is needed to estimate the strength of the expected modulation for the particular case of K2V3O8 and the resulting effect of such a modulation on the spin-wave spectrum.
Interestingly, the material Rb2V3O8 which is isostructural at room temperature, also exhibits a structural phase transition with a very different modulation of Q0.16 Withers . These distortions are explained, within the rigid unit mode analysis, as resulting from rotations of the V5+O4 tetrahedra such as to uniformly raise or lower the V4+O5 pyramidal network along the -axis Withers . The proposed modulation does not affect the V4+-O-O-V4+ superexchange pathway within the 2d planes only affecting the separation between layers and, hence, the interplanar coupling. One would expect such a distortion to have little effect on the excitation spectrum which is predominately two-dimensional in character. Comparison of the magnetic excitations in Rb2V3O8 to those of K2V3O8, where the modulation contains a large in-plane component, could shed some light on the nature of the observed mode splitting.
VII Conclusions
In conclusion, we have performed detailed inelastic neutron scattering studies of the magnetic excitation spectrum of the 2d antiferromagnet, K2V3O8 using a combination of triple-axis and time-of-flight experiments. The long-wavelength region of the excitation spectrum confirms that K2V3O8 is an excellent example of a QSLHAF with a very small near-neighbor coupling constant =1.080.03 meV. In addition, we were able to confirm the presence of a very small anisotropy gap in the excitation spectrum of 729 eV. Under the assumption of the previously suggested Hamiltonian with the Dzyaloshinskii-Moriya interaction set to Dz/=0.04, we determine a c-axis exchange anisotropy of E/=0.00120.0001 in very good agreement with the values estimated based on the location of the field-induced phase transitions Lumsden . Finally, the dispersion along the c-axis was measured indicating a ferromagnetic interplanar coupling Jc=-0.00360.0006 meV (using Jc/=-0.00280.0005 and =1.2750.03) demonstrating that K2V3O8 is a very good two-dimensional material.
As we approach the zone boundary, however, the previously determined model no longer adequately describes the measured excitation spectrum. The excitations near the (,0) zone boundary point are broadened while near the (/2,/2) zone boundary point we observe two clear modes rather evenly split around the expected position of the single mode based on measurements in long-wavelength limit and the predictions of spin-wave theory. The upper of the two modes has a peculiar Q-dependence in that it only has significant intensity near the zone boundary. In addition, the intensity of the upper mode is seen to fall off continuously as we move along the zone boundary from (/2,/2) to (,0). We have discussed several possible explanations for the split mode near the zone boundary. Among these explanations, the best agreement with the data is the case of disorder on the 2d lattice although we have no other evidence for disorder in this material. We hope that these measurements will stimulate additional effort both experimentally and theoretically to attempt to explain the peculiar zone boundary properties of K2V3O8.
Acknowledgements.
We would like to thank A. Zheludev and A.L. Chernyshev for helpful discussions and to Mark Telling and Felix Altofer for technical assistance. The triple-axis data was fit using the Reslib software package, A. Zheludev and the time-of-flight data was fit using routines derived from MSLICE, R. Coldea. We would like to thank A. Joshi, M. Ma, and F.C. Zhang for calculating the crystal field energy levels. Research sponsored by the Division of Materials Sciences and Engineering, Office of Basic Energy Sciences, U.S. Department of Energy, under contract DE-AC05-00OR22725 with Oak Ridge National Laboratory, managed and operated by UT-Battelle, LLC. Work in London was supported by a Wolfson Royal Society Research Merit Award. D.A.T. acknowledges the support by UK EPSRC Grant No. GR/N35038/01 for IRIS measurement time.References
- (1) See E. Manousakis, Rev. Mod. Phys. 63, 1 (1991) and references therein.
- (2) J.G. Bednorz and K.A. Müller, Z. Phys. B 64, 189 (1986).
- (3) P.W. Anderson, Science 235, 1196 (1987).
- (4) Y. Endoh, K. Yamada, R.J. Birgeneau, D.R. Gabbe, H.P. Jenssen, M.A. Kastner, C.J. Peters, P.J. Picone, T.R. Thurston, J.M. Tranquada, G. Shirane, Y. Hidaka, M. Oda, Y. Enomoto, M. Suzuki, and T. Murakami, Phys. Rev. B 37, 7443 (1988).
- (5) J.I. Igarashi, Phys. Rev. B 46, 10763 (1992).
- (6) R.R.P. Singh and M.P. Gelfand, Phys. Rev. B 52, R15695 (1995).
- (7) A.W. Sandvik and R.R.P. Singh, Phys. Rev. Lett. 86, 528 (2001).
- (8) W. Zheng, J. Oitmaa and C.J. Hamer, Phys. Rev. B 71, 184440 (2005).
- (9) J.I. Igarashi and T. Nagao, Phys. Rev. B 72, 014403 (2005).
- (10) S. Chakravarty, B.I. Halperin, D.R. Nelson, Phys. Rev. B 39, 2344 (1989).
- (11) J.-K. Kim and M. Troyer, Phys. Rev. Lett. 80, 2705 (1998).
- (12) B.B. Beard, R.J. Birgeneau, M. Greven, and U.-J. Wiese, Phys. Rev. Lett. 80, 1742 (1998).
- (13) N. Elstner, A. Sokol, R.R.P. Singh, M. Greven, and R.J. Birgeneau, Phys. Rev. Lett. 75, 938 (1995).
- (14) K. Yamada, K. Kakurai, Y. Endoh, T. R. Thurston, M. A. Kastner, R.J. Birgeneau, G. Shirane, Y. Hidaka and T. Murakami, Phys. Rev. B 40, 4557 (1989).
- (15) R.J. Birgeneau, M. Greven, M.A. Kastner, Y.S. Lee, B.O. Wells, Y. Endoh, K. Yamada, and G. Shirane, Phys. Rev. B 59, 13788 (1999).
- (16) M. Greven, R.J. Birgeneau, Y. Endoh, M.A. Kastner, M. Matsuda, and G. Shirane, Z. Phys. B 96, 465 (1995).
- (17) H.M. Rønnow, D.F. McMorrow, and A. Harrison, Phys. Rev. Lett. 82, 3152 (1999).
- (18) P. Carretta, T. Ciabattoni, A. Cuccoli, E. Mognaschi, A. Rigamonti, V. Tognetti, and P. Verrucchi, Phys. Rev. Lett. 84, 366 (2000).
- (19) S. Tyč, B.I. Halperin, and S. Chakravarty, Phys. Rev. Lett. 62, 835 (1989).
- (20) A. Auerbach and D.P. Arovas, Phys. Rev. Lett. 61, 617 (1988).
- (21) M. Takahashi, Phys. Rev. B 40, 2494 (1989).
- (22) A. Sokol, R.R.P. Singh, and N. Elstner, Phys. Rev. Lett. 76, 4416 (1996).
- (23) A. Sherman and M. Schreiber, Phys. Rev. B 60, 10180 (1999).
- (24) S. Winterfeldt and D. Ihle, Phys. Rev. B 56, 5535 (1997).
- (25) T. Nagao and J. Igarashi, J. Phys. Soc. Jpn. 67, 1029 (1998).
- (26) Y.-J. Wang, M.-R. Li, C.-D. Gong, Phys. Rev. B 56, 10982 (1997).
- (27) M. Makivić and M. Jarrell, Phys. Rev. Lett. 68, 1770 (1992).
- (28) H.M. Rønnow, D.F. McMorrow, R. Coldea, A. Harrison, I.D. Youngson, T.G. Perring, G. Aeppli, O. Syljuåsen, K. Lefmann, and C. Rischel, Phys. Rev. Lett. 87, 037202 (2001).
- (29) M.S. Yang and K Mütter, Z. Phys. B: Condes. Matter 104, 117 (1997).
- (30) M.E. Zhitomirsky and T. Nikuni, Phys. Rev. B 57, 5013 (1998).
- (31) M.E. Zhitomirsky and A.L. Chernyshev, Phys. Rev. Lett. 82, 4536 (1999).
- (32) O.F. Syljuåsen and P.A. Lee, Phys. Rev. Lett. 88, 207207 (2002).
- (33) G. Shirane, Y. Endoh, R.J. Birgeneau, M.A. Kastner, Y. Hidaka, M. Oda, M. Suzuki, and T. Murakami, Phys. Rev. Lett. 59, 1613 (1987).
- (34) G. Aeppli, S. M. Hayden, H. A. Mook, Z. Fisk, S. W. Cheong, D. Rytz, J. P. Remeika, G. P. Espinosa, and A. S. Cooper, Phys. Rev. Lett. 62, 2052 (1989).
- (35) S.M. Hayden, G. Aeppli, R. Osborn, A.D. Taylor, T.G. Perring, S.-W. Cheong, and Z. Fisk, Phys. Rev. Lett. 67, 3622 (1991).
- (36) R. Coldea, S.M. Hayden, G. Aeppli, T.G. Perring, C.D. Frost, T.E. Mason, S.-W. Cheong, and Z. Fisk, Phys. Rev. Lett. 86, 5377 (2001).
- (37) N.M.R. Peres and M.A.N. Araújo, Phys. Rev. B 65, 132404 (2002).
- (38) A. Singh and P. Goswami, Phys. Rev. B 66, 092402 (2002).
- (39) A.A. Katanin and A.P. Kampf, Phys. Rev. B 66, 100403(R) (2002).
- (40) A.M. Toader, J.P. Goff, M. Roger, N. Shannon, J.R. Stewart, and M. Enderle, Phys. Rev. Lett. 94, 197202 (2005); L. Raymond, G. Albinet, and A.-M.S. Tremblay, Phys. Rev. Lett. 97, 049701 (2006); A.M. Toader et al. Phys. Rev. Lett. 97, 049702 (2006).
- (41) Y.J. Kim, A. Aharony, R.J. Birgeneau, F.C. Chou, O. Entin-Wohlman, R.W. Erwin, M. Greven, A.B. Harris, M.A. Kastner, I.Ya. Korenblit, Y.S. Lee, and G. Shirane, Phys. Rev. Lett. 83, 852 (1999).
- (42) F.M. Woodward, A.S. Albrecht, C.M. Wynn, C.P. Landee, M.M. Turnbull, Phys. Rev. B 65, 144412 (2002).
- (43) J. Galy and A. Carpy, Acta. Crystallogr. B31, 1794 (1975).
- (44) G. Liu and J.E. Greedan, J. Solid State Chem. 114, 499 (1995).
- (45) M.D. Lumsden, B.C. Sales, D. Mandrus, S.E. Nagler, and J.R. Thompson, Phys. Rev. Lett. 86, 159 (2001).
- (46) B.C. Sales, M.D. Lumsden, S.E. Nagler, D. Mandrus, and R. Jin, Phys. Rev. Lett. 88, 095901 (2002).
- (47) J. Choi, Z. Zhu, J.L. Musfeldt, G. Ragghianti, D. Mandrus, B.C. Sales, and J.R. Thompson, Phys. Rev. B 65, 054101 (2001).
- (48) A.L. Chernyshev, Phys. Rev. B 72, 174414 (2005).
- (49) M.Popovici, Acta. Cryst. A31, 507 (1975).
- (50) J. Merino, R.H. McKenzie, J.B. Marston, and C.H. Chung, J. Phys.: Condens. Matter 11, 2965 (1999).
- (51) W. Zheng, J.O. Fjærestad, R.R.P. Singh, R.H. McKenzie, and R. Coldea, Phys. Rev. Lett. 96, 057201 (2006).
- (52) A. N. Bogdanov, U. K. Rossler, M. Wolf, and K.-H. Müller, Phys. Rev. B 66, 214410 (2002).
- (53) A. Zheludev, G. Shirane, Y. Sasago, N. Koide, and K. Uchinokura, Phys. Rev. B 54, 15163 (1996).
- (54) A. Zheludev, G. Shirane, Y. Sasago, N. Koide, and K. Uchinokura, Phys. Rev. B 55, 11879 (1997).
- (55) A. Joshi, M. Ma, F. Mila, D.N. Shi and F.C. Zhang, Phys. Rev. B 60, 6584 (1999).
- (56) T. Ohama, H. Yasuoka, M. Isobe, Y. Ueda, J. Phys. Soc. Jpn. 66, 3008 (1997).
- (57) Y. Ueda, Chem. Mater. 10, 2653 (1998).
- (58) H.-J. Koo and M.-H. Whangbo, Solid State Commun. 111, 353 (1999).
- (59) W.E. Pickett, Phys. Rev. Lett. 79, 1746 (1997).
- (60) R. Valenti and T. Saha-Dasgupta, Phys. Rev. B 65, 144445 (2002).
- (61) H. Smolinski, C. Gros, W. Weber, U. Peuchert, G. Roth, M. Weiden, and C. Geibel, Phys. Rev. Lett. 80, 5164 (1998).
- (62) R. Valenti, T. Saha-Dasgupta, and F. Mila, Phys. Rev. B 68, 024411 (2003).
- (63) H. Rosner, R.R.P. Singh, W.H. Zheng, J. Oitmaa and W.E. Pickett, Phys. Rev. B 67, 014416 (2003).
- (64) R.C. Rai, J. Cao, J.L. Musfeldt, D.J. Singh, X. Wei, R. Jin, Z.X. Zhou, B.C. Sales and D. Mandrus, Phys. Rev. B 73, 075112 (2006).
- (65) R. Melzi, S. Aldrovandi, F. Tedoldi, P. Carretta, P. Millet and F. Mila, Phys. Rev. B, 64, 024409 (2001).
- (66) A. Joshi, M. Ma, and F.C. Zhang, private communication.
- (67) A.L. Chernyshev, Y.C. Chen, and A.H. Castro Neto, Phys. Rev. B 65, 104407 (2002).
- (68) E.R. Mucciolo, A.H. Castro Neto, and C. Chamon, Phys. Rev. B 69, 214424 (2004).
- (69) See T. Nakayama, K. Yakubo, and R. Orbach, Rev. Mod. Phys. 66, 381 (1994) and references therein.
- (70) S. Alexander and R. Orbach, J. Phys. (France) Lett. 43, L625 (1982).
- (71) A. Aharony, O. Entin-Wohlman, and R. Orbach, in Time Dependent Effects in Disordered Materials, edited by T. Riste and R. Pynn, p. 233 (1988).
- (72) Y.J. Uemura and R.J. Birgeneau, Phys. Rev. B 36, 7024 (1987).
- (73) R.A. Cowley, G. Shirane, R.J. Birgeneau, and H.J. Guggenheim, Phys. Rev. B 15, 4292 (1977).
- (74) T. Ohama, H. Yasuoka, M. Isobe, Y. Ueda, Phys. Rev. B 59, 3299 (1999).
- (75) B.C. Chakoumakos, R. Custelcean, T. Kamiyama, K. Oikawa, B.C. Sales, and M.D. Lumsden, submitted to Journal of Solid State Chemistry.
- (76) J.M. Tranquada, B.J. Sternlib, J.D. Axe, N. Nakamura and S. Uchida, Nature(London) 375, 561 (1995).
- (77) J.M. Tranquada, J.D. Axe, N. Ichikawa, A.R. Moodenbaugh, Y. Nakamura, and S. Uchida, Phys. Rev. Lett. 78, 338 (1997).
- (78) J. Orenstein and A.J. Millis, Science 288, 468 (2000).
- (79) I.A. Zaliznyak, Phys. Rev. B 68, 134451 (2003).
- (80) R.L. Withers, T. Hoche, Y. Liu, S. Esmaeilzadeh, R. Keding, and B.C. Sales, J. Solid State Chem. 177, 3316 (2004).