Point-contact spectroscopy of the nickel borocarbide superconductors Ni2B2C (=Y, Dy, Ho, Er, Tm, Lu)
Abstract
An overview of the recent efforts in point-contact (PC) spectroscopy of the nickel borocarbide superconductors Ni2B2C in the normal and superconducting (SC) state is given. The results of measurements of the PC electron-boson(phonon) interaction spectral function are presented. Phonon maxima and crystalline-electric-field (CEF) excitations are observed in the PC spectra of compounds with =Dy, Ho, Er and Tm, while for =Y a dominant phonon maximum around 12 meV is characteristic. Additionally, non-phonon and non-CEF maxima are observed near 3 meV in =Ho and near 6 meV in =Dy. Directional PC study of the SC gap gives evidence for the multi-band nature of superconductivity in =Y, Lu. At low temperature the SC gap in =Ho exhibits a standard single-band BCS-like dependence, which vanishes above KK, where a specific magnetic ordering starts to play a role. For =Tm (K) a decrease of the SC gap is observed below 5 K.
keywords:
nickel borocarbides, point-contact spectroscopy , superconducting gap , electron-phonon interaction , CEFPACS:
72.10.Di, 74.45.+c, 74.70Dd, , , , , , , , , , , ,
The Ni2B2C ( is mainly rare earth, Y or Sc) family of ternary superconductors discovered in 1994 has become attractive to study fundamental questions in superconductivity [1]. The interest is because the critical temperature in Ni2B2C is relatively high, their superconducting (SC) properties exhibit often unconventional behavior and depending on the rare earth element magnetism and superconductivity co-exist in these materials in a wide range of temperatures. Last but not least there is continious progress in synthesis of high purity single crystal samples. However in spite of dozens of publications some fundamental issues as to the nature of Cooper pairing and attractive interaction are still under debate for the borocarbides.
By point-contact (PC) research both the SC gap and the PC electron-phonon(boson) interaction (EP(B)I) function can be determined from the first and second derivatives of the characteristic of PC’s [2]. The second derivative of contains straightforward information as to the PC EB(P)I spectral function [2]. Knowing one can elucidate the nature of the attractive interaction and characteristic bosons. Unique is that with the same PCs driven to the superconducting state the SC gap can be measured. Thus the PC spectroscopy is a powerful method to study both the EP(B)I spectra and the SC gap behavior.
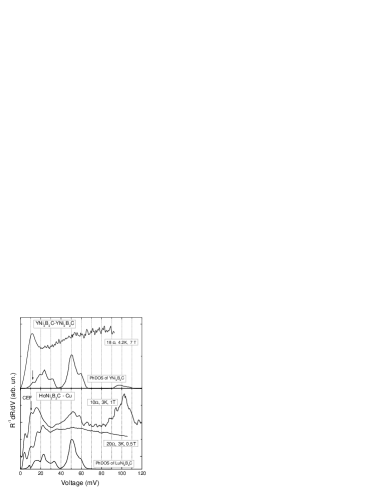
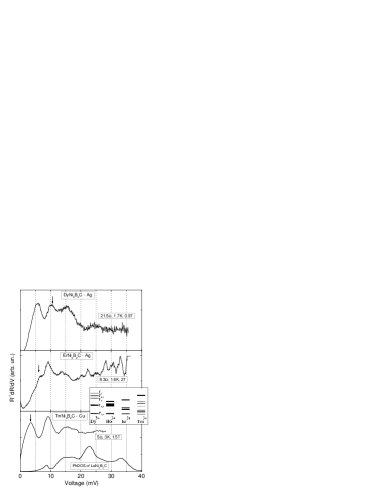
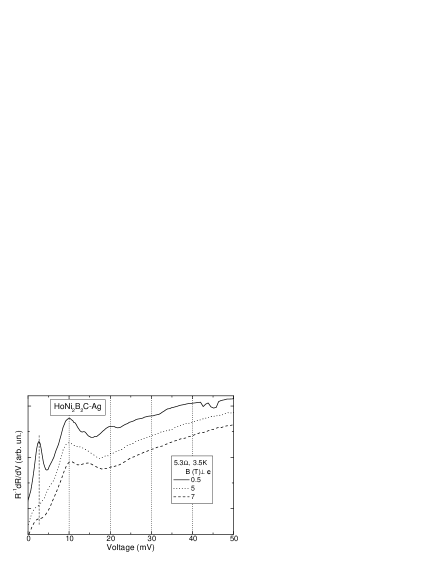
At first we start with the discussion of PC EP(B)I spectra in Ni2B2C presented in Figs. 1 and 2. The most detailed spectra are measured for HoNi2B2C. Here, most of the maxima correspond to those in the phonon DOS of the isostructural compound LuNi2B2C [3]. The upper Ho-spectrum displays also expressed high energy maxima around 50 and 100 mV which were not so clearly resolved so far in the PC spectra of other nickel borocarbides. The low energy maximum around 3 mV in =Ho and 6 mV in =Dy (Fig. 2), not present in the phonon DOS, have non phonon origins. The 3-mV maximum in =Ho can be suppressed by a magnetic field (Fig. 3) pointing to its ”magnetic” origin as discussed in [4, 5]. The 6-mV peak in =Dy vanishes with increasing above 15 K, has probably a similar ”magnetic” origin. The first maximum in =Tm and =Er corresponds in position to the first exited crystal-electric-field (CEF) level [6]. CEF contributes apparently also to the 10-mV peak in =Ho and Dy compounds. In the former case this is seen from the modification of the 10-mV peak in a magnetic field (Fig. 3). Most of the PC spectra in =Ho (not shown) demonstrate a prominent 10-mV peak while other phonon maxima are completely smeared. This points to the importance of the CEF excitations in the charge transport as well as in the SC properties of HoNi2B2C and other =Dy, Er and Tm borocarbides. Thus the contribution of the 10-mV peak in the EP(B)I constant for =Ho is evaluated as 20-30%, while the contribution to of the high frequency modes at 50 and 100 meV amounts up to 10% for each maximum.
The spectra of the nonmagnetic YNi2B2C show a dominant maximum at about 12 mV and a broad shallow maximum or a kink positioned close to 50 mV (Fig. 1). These features have a counterpart in the phonon DOS of YNi2B2C. To summarize: a clear coupling to the low energy modes has been shown in the PC spectra of the title compounds. In =Dy, Ho, Er and Tm compounds the CEF excitations contribute to the EP(B)I function. For =Ho the contribution of two high energy modes are also notable. The 50-mV mode can be also resolved for other compounds, but it looks very smeared as shown in Fig. 1 for =Y. In this context, we note that the electronic mean free path is shortened with increase of the bias voltage due to the EP(B)I. In this case if the EP(B)I is strong enough, it results in a violation of the ballistic condition (with voltage increase) necessary for energy resolved spectroscopy by PCs. On the other hand the high energy modes involve vibration of light B and C ions. As it is known, the physical properties of nickel borocarbides, including the superconductivity, are sensitive to small variations in the crystal stoichiometry. Disorder in the B and C position is especially difficult to avoid and control. Turning to the PC spectra we mention that the pronounced high energy maxima for the Ho compound were measured for a sample with improved RRR and superconductivity after a special annealing treatment.
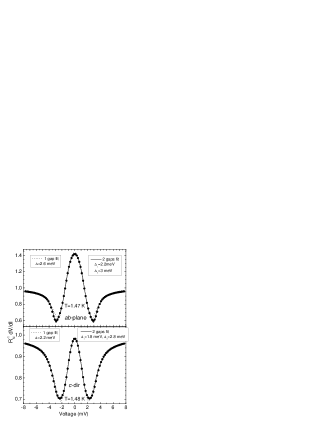
The SC gap manifests itself in the characteristic of a N-c-S contact as pronounced minima symmetrically placed at for . In the case of a two-gap(band) superconductor like MgB2 (and firstly proposed for borocarbides already in 1998 [8]) a number of minima are seen, each pair corresponding to a definite gap (see e. g. [2]). Up to now all measured curves for SC borocarbides exhibit only one pair of minima as in the case of a single gap. However as it is shown in [9], a two gap approach allows better to fit the experimental curves for LuNi2B2C (Fig. 4). The reason why only one gap minimum structure is visible is that the gap values differ only by a factor of 1.5 while in MgB2 this difference is about 3 times.

It is interesting that in the BCS extrapolation the critical temperature, , corresponding to the small gap in LuNi2B2C is 10 K in the ab plane and 14.5 K in the c direction (see Fig. 5). Note the unusual temperature dependence of this gap suggesting extremely weak interband coupling (compare with [7]). For the large gap coincides with the bulk =16.8 K and the absolute values are about 3 meV in both orientations. In the c direction the contributions to the conductivity from the small and the large gaps remain practically identical up to 10 -11 K. In the ab plane the contribution from the small gap is smaller and decreases rapidly with increasing .
The single gap approach used in [5] gives an anisotropic gap in YNi2B2C with a gap of about 1.5 meV along the a-axis, a larger 2.3 meV gap along the c-axis and maximal 2.5 meV gap in the [110] direction. The last two values are close to the corresponding values in LuNi2B2C for the single gap fit shown in Fig. 4. Thus the measurements on Lu and Y compounds are compatible with a multi(two) band scenario of the SC state in these both nonmagnetic borocarbides.
Turning to the SC gap measurement in the Ho compound, no obvious gap anisotropy was observed [5]. The intriguing feature here is that the gap vanishes at 5.6 K, which is close to the Nel temperature 5.3 K, but well below 8.5 K of the bulk crystal. This suggest that the superconductivity in the commensurate antiferromagnetic phase of the Ho compound survives at a special nearly isotropic Fermi Surface Sheet. Between and 8.5 K the SC signal in is drastically suppressed, giving no possibility to observe a finite SC gap by fitting the data. This shows that the SC state in HoNi2B2C between and , i. e. in the region of peculiar incommensurate magnetic order, is unusual.
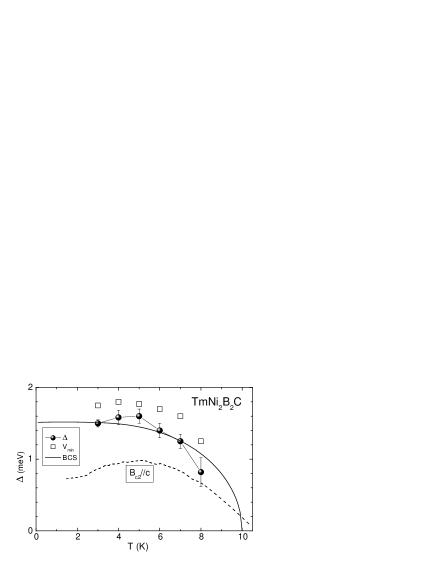
An interesting nonmonotonic behavior characterizes the in TmNi2B2C (Fig. 6) at the maximum around 5 K where the gap decreases again with lowering of . This is similar to the behavior of the upper critical field along the c-axis. Apparently, antiferomagnetic fluctuations due to the approaching of a Nel phase 1.5 K are responsible for the gap decrease.
Figure 7 summarizes the measurement of the SC gap by PCs in the title compounds. In general, the gaps are placed close to the BCS value taking into account the anisotropy or multiband behavior in the Y and Lu compounds and the specific SC state in the Ho borocarbide.

Support by SFB 463 (Germany), US CRDF (No.UP1-2566-KH-03) grants and NAS of Ukraine are acknowledged. Work at TAMU was partially supported by the Robert A. Welch Foundation, Houston, TX (A-0515, A-1526).
References
- [1] K.-H. Müller et al., Rep. Prog. Phys. 64, 943 (2001).
- [2] Yu. G. Naidyuk and I. K. Yanson, Point-Contact Spectroscopy, Springer Series in Solid-State Sciences, Vol.145 (Springer Science+Business Media, Inc, 2005).
- [3] F. Gompf et al., Phys. Rev. B 55 (1997) 9058.
- [4] Yu. G. Naidyuk et al., Physica B 359-361 (2005) 469.
- [5] Yu. G. Naidyuk et al., this Proceedings.
- [6] U. Gasser et al., Z. Phys. B 101 (1996) 345.
- [7] A. Wälte et al., Phys. Rev. B 73 (2006) 064501.
- [8] S.V. Shulga et al., Phys. Rev. Lett. 80 (1998) 1730.
- [9] N. L. Bobrov et al., Fiz. Nizk. Temp. 32 (2006) 641.