Bandwidth-controlled Mott transition in -(BEDT-TTF)2Cu[N(CN)2]BrxCl1-x:
I. Optical studies of localized charge excitations
Abstract
Infrared reflection measurements of the half-filled two-dimensional organic conductors -(BEDT-TTF)2Cu[N(CN)2]BrxCl1-x were performed as a function of temperature ( K) and Br-substitution (, 40%, 73%, 85%, and 90%) in order to study the metal-insulator transition. We can distinguish absorption processes due to itinerant and localized charge carriers. The broad mid-infrared absorption has two contributions: transitions between the two Hubbard bands and intradimer excitations from the charges localized on the (BEDT-TTF)2 dimer. Since the latter couple to intramolecular vibrations of BEDT-TTF, the analysis of both electronic and vibrational features provides a tool to disentangle these contributions and to follow their temperature and electronic-correlations dependence. Calculations based on the cluster model support our interpretation.
pacs:
74.70.Kn, 71.30.+h, 74.25.Gz, 71.10.HfI Introduction
The physics of strongly correlated electron systems is a very active field in solid-state science where the vicinity of Mott-insulating, magnetically ordered, and superconducting ground states is most intriguing. These effects are intensively studied for transition-metal oxides, in particular high-temperature superconductors, and organic conductors. It is extremely interesting that all of these materials show a similar competition between ordered antiferromagnetic and superconducting phases: this suggests common physics, while the chemistry of the compounds and the origin of the conducting electrons is different.Jerome94 ; Ishiguro98 ; McKenzie97 These facts have initiated our investigation of the molecular conductors of the BEDT-TTF family as model compounds to study physics of correlated electrons close to the Mott transition in two dimensions.Seo04 ; Dressel04
In the -phase crystals, conducting layers of cationic bis-(ethylenedithio)tetrathiafulvalene (BEDT-TTF) molecules are separated by ‘charge-reservoir’ layers of monovalent anions. As depicted in Fig. 1, two BEDT-TTF+0.5 molecules form confacial dimers which can be considered as lattice sites; due to this dimerization the conduction band is half filled. The anion size sensitively influences the physical properties of the system very similar to the variation of pressure, since they define the spacing between the molecules (molecular sites) and thus the width of the band.Mori99 ; remark4 The ratio of electronic correlations to the width of the conductance band is the control parameterMcKenzie97 in the phase diagram depicted in Fig. 2. The ground state of -(BEDT-TTF) salts can be switched between an antiferromagnetic insulating, a superconducting, and a metallic state. These salts exhibit the highest superconducting transition temperature of all organic superconductors with K.Jerome94 ; Ishiguro98
At ambient temperature the studied -phase BEDT-TTF salts have common properties, which may be characterized as a narrow-gap semiconductor or “bad metal”. When the temperature drops below a so-called coherence temperature K on the right side of the phase diagram, the metallic behavior becomes dominant due to the formation of Fermi liquid quasiparticlesGeorges96 ; Merino00a until a second-order transition occurs to a superconducting state. The nature of superconductivity in organic crystals is subject to discussion for twenty yearsLang03 but in the present study we focus on the metallic and insulating states. On the left side of the phase diagram (Fig. 2), i.e., for higher values of , the system never shows metallic properties, but is gradually driven into an insulating state by electronic correlations as the temperature drops below 90 K; at K magnetic order is observed. NMR measurements in deuterated samples -(-BEDT-TTF)2Cu[N(CN)2]Br (which fall right on the phase boundary) revealed that at low temperatures the transition between the commensurate antiferromagnet and pseudogapped superconductor is of first order.MIY02 Most recently, enormous research efforts were dedicated to the metal-to-insulator transition and critical end-point in this highly correlated two-dimensional electron system. The critical behavior in the vicinity of the Mott transition was investigated by dc measurements under external pressure and in magnetic field.Lefebvre00 ; LIM03 ; KAG04 The alloyed series -(BEDT-TTF)2Cu[N(CN)2]BrxCl1-x, studied in the present work, covers the most interesting region of the phase diagram spanned by the pure Cl and Br salts, including the border between the Mott insulating and metallic phases. Our infrared reflection measurements of a series of compounds with Br concentration varying between 0 and 90 % make it possible to explore the temperature and correlation (bandwidth)-dependent charge dynamics on crossing this phase boundary, as well as the unusual physical properties in the metallic region above the superconducting transition.
Several optical experiments were performed on the pristine compounds -(BEDT-TTF)2Cu[N(CN)2]Br and -(BEDT-TTF)2Cu[N(CN)2]Cl over the years.Eldridge91b ; Tamura91 ; Kornelsen92 ; Eldridge96b ; VLA96 ; McGuire01 ; SAS04 They gave a general idea of the electronic excitation observed in the infrared region: a broad mid-infrared band around cm-1 and a narrow Drude-like peak in the spectra of superconducting Br-compoundremark5 at temperatures below 50 K. In the discussion Section IV.1 we review the different interpretations of the mid-infrared spectra. Our investigation of the alloys gives an unambiguous assignment of the spectral features in this region, important for the analysis of the charge dynamics in these salts. BEDT-TTF)2Cu[N(CN)2]Br0.5Cl0.5 is the only mixed compound which has previously been investigated by infrared spectroscopy,VLA93 ; DRO94 ; VLA96 ; Pet02 ; Troung97 but only in the mid-infrared range.
Here, we present for the first time a systematic optical study of the series -(BEDT-TTF)2Cu[N(CN)2]BrxCl1-x, with crossing all relevant regions of the phase diagram from the insulating/antiferromagnetic to the metallic/superconducting state. Our experiments cover a broad spectral range from 50 to 10000 cm-1 and temperatures from room temperature down to K. This enables us to follow the response of the free and localized carriers for the different points of this phase diagram, depending on temperature and correlation-to-bandwidth ratio. While we focus on the signature of localized charge excitations here, the succeeding paperDressel05 (which we refer to as Part II in the following) is devoted to the dynamics of free charge carriers and the formation of the coherent quasiparticle response.
II Experiments
Single crystals of the -(BEDT-TTF)2Cu[N(CN)2]BrxCl1-x salts were grown by standard electrochemical methods. Certain ratios of Br/Cl concentration were chosen to obtain a series of alloys. Subsequent to the optical reflection experiments, each individual crystal was checked by microprobe analysis in order to determine the composition. The actual Br/Cl ratio turned out to be significantly different than expected from the starting concentration, since Br enters the compounds much easier than Cl.remark9 It was hardly possible to produce samples with predefined Br concentration. In the following, we denote the actual Br content of -(BEDT-TTF)2Cu[N(CN)2]BrxCl1-x where , 40%, 73%, 85%, and 90%; the concentration was found homogeneous for each specimen. The platelets contained naturally flat () surfaces with a typical size of about mm2.remark8 The orientation was determined from the optical spectra.

The strong dependence of the dc resistivity on the Br/Cl ratio is emphasized in Fig. 3 where is plotted for a crystal with low () and high () bromine content. For the insulating sample -(BEDT-TTF)2Cu[N(CN)2]Br0.23Cl0.77 the resistivity rises by many orders of magnitude as the temperature decreases, most dramatically below 70 K. Contrary, -(BEDT-TTF)2Cu[N(CN)2]Br0.85Cl0.15 shows basically the same temperature dependence like the pure Br specimen: increases slightly below room temperature until it reaches a broad maximum around 100 K. At lower temperatures the behavior is metallic with for K and finally a superconducting transition is observed at K.remark1 The superconducting properties of -(BEDT-TTF)2Cu[N(CN)2]BrxCl1-x with different Br concentrations have been investigated previously by dc resistivity and magnetization.Sushko93
The in-plane optical reflectivity was measured with light polarized along and axes, respectively. Employing a modified Bruker IFS 113v Fourier-transform spectrometer, we covered a broad frequency range from 50 to 10 000 cm-1 (6 meV - 1.2 eV) with a resolution of up to 0.5 cm-1. The single crystals were studied at 300, 150, 90, 50, 35, 20 and 5 K with the help of a cold-finger cryostat. To achieve good thermal contact, the samples were fixed by carbon paste on a brass cone directly attached to the cold finger. Absolute values of the reflectivity are obtained by subsequently evaporating gold onto the sample and remeasuring it as reference mirror at all temperatures.HOM93 The in-situ gold-evaporation technique is more accurate than other referencing methods because it utilizes the entire sample surface and is less effected by surface imperfections. In addition, for the crystals with 40% and 85% Br concentration, reflectivity spectra were measured in cm-1 range at temperatures between 300 and 20 K using a Bruker IFS 66v spectrometer equipped with an IR microscope and cold-finger Cryovac Microstat. The spectra in this range coincide for both methods of measurement; there is basically no dependence on Br-content and temperature. In the overlapping range they are in agreement with the room-temperature data received by Drozdova et al.DRO94 up to 40 000 cm-1. These spectra were also used as a high-frequency extrapolation for the other compounds. From the reflectivity spectra, the optical conductivity was calculated employing Kramers-Kronig analysis.DresselGruner02 At low-frequencies the data were extrapolated by the Hagen-Rubens behavior, which was double-checked by the dc resistivity obtained from standard four-probe measurements (Fig. 3). The low-frequency extrapolation only very weakly affects the spectra in the measured range, i.e. the absolute values of conductivity.
III Results
In Figs. 4 and 5 the reflectivity and conductivity spectra of -(BEDT-TTF)2Cu[N(CN)2]BrxCl1-x (with , 40%, 73%, 85%, and 90%) are plotted for light polarized parallel to the direction at distinct temperatures from 300 K down to 20 K. Because there is no significant difference between the K and 5 K spectra, we omitted the latter. At ambient temperature, the optical properties only weakly depend on the Br-content (inset of Fig. 4b). As expected for semiconductors, the reflectivity is basically frequency independent at small frequencies, and hence the corresponding room-temperature conductivity is low; the reflectivity starts to decrease significantly above 3500 cm-1 and reaches a value close to zero in both polarizations around 5000 cm-1. The respective conductivity spectra show a broad absorption band centered between 2000 cm-1 and 3000 cm-1 which is well documented in literature for the -phase of BEDT-TTF salts in general. The strong absorption features observed in the mid-infrared around 400, 850, and 1400 cm-1 are totally symmetric vibrations of the BEDT-TTF molecule, activated by electron-molecular vibrational (emv) coupling (cf. Ref. Dressel04, and references therein), we will give a detailed analysis in Sec. IV.3.
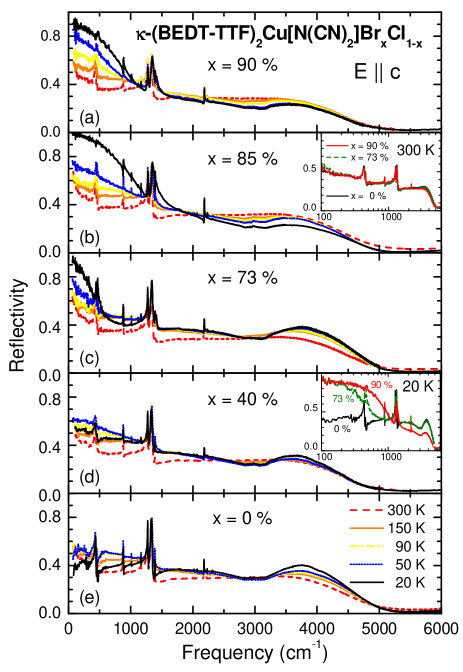
Significant changes of the optical spectra are observed when cooling the samples below K. The far-infrared reflectivity strongly increases for specimens with high Br content (Fig. 4), while the mid-infrared reflectivity is suppressed. Correspondingly, as seen in Fig. 5, a Drude-like contribution develops in the conductivity spectra of the samples with , 85%, and 90% at low temperatures. The latter compound exhibits a behavior similar to the pristine -(BEDT-TTF)2Cu[N(CN)2]Br salt.Eldridge91b The opposite is observed for the salts with low Br-content: the far-infrared reflectivity drops while it rises in the mid-infrared. The absolute values of reflectivity and conductivity are slightly enhanced compared to previously published results. Eldridge91b ; Kornelsen92 ; Eldridge96b ; VLA96 ; McGuire01 ; SAS04 This we attribute to our advanced in-situ gold-evaporation method for the reference measurement which also accounts for imperfections of the crystal surface.
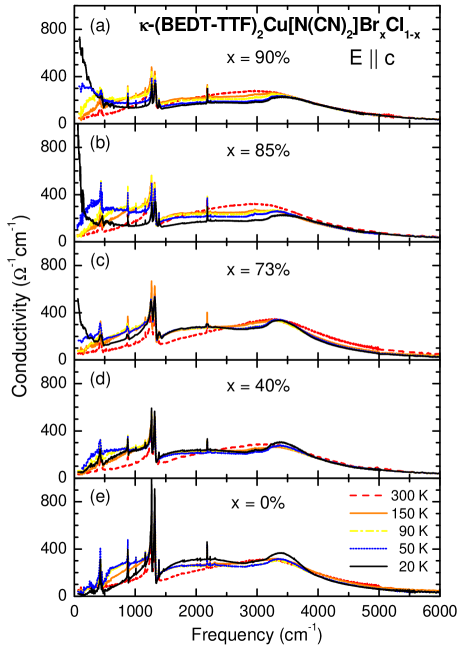
The reflectivity and conductivity for the perpendicular polarization () are shown in Figs. 6 and 7 for different Br concentrations and temperatures . The spectra exhibit basically the same features as the ones recorded along direction; except the shape of the mid-infrared absorption is different. As previously reported, for most other -salts, the maximum of the absorption band for the axis lies at higher frequencies. While at ambient temperature a distinction is difficult, at low temperatures it becomes obvious from both, reflectivity and conductivity data, that it consists of two components: in addition to the band around 2000 cm-1, a second narrower mode has its maximum around 3500 cm-1. This behavior is most pronounced for the pure Cl compound. Again, with increasing Br content a Drude contribution develops as the temperature is reduced below 50 K.
We want to point out that the accessible frequency range of our experiments is limited to cm-1 due to the small sample surfaces. Thus, we cannot detect the superconducting energy gap , which is expected around cm-1.
IV Discussion
Despite the above mentioned limitations, our data cover a very broad frequency range from 50 to 10 000 cm-1. Therefore, we are able not only to study the vibrational features and the mid-infrared absorption, but also to analyze the temperature and doping dependence of the Drude contribution in -(BEDT-TTF)2Cu[N(CN)2]BrxCl1-x. However, since there is no agreement in the literature on the interpretation of the mid-infrared absorption band which is important for analysis of the whole charge dynamics in these materials, we first address this part of the spectra. The contribution of the itinerant electrons will extensively be analyzed and discussed in Part II.
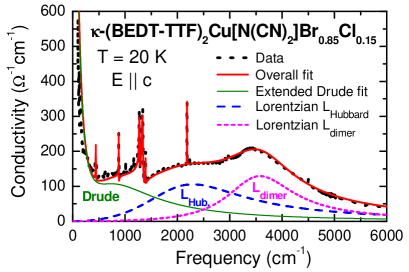
The common approach is to fit the spectra by the Drude-Lorentz model,DresselGruner02 ; Dressel04 because it helps to disentangle the contributions of conduction electrons, interband transitions and vibrational features. As an example, the optical conductivity along the -direction of the crystal with is displayed in Fig. 8 together with a fit by one Drude-like component and several Lorentzian oscillators; to further restrict the parameters, the R() and spectra were fitted simultaneously. This procedure was applied to the spectra taken in both polarization directions and at all temperatures and values of Br doping.
IV.1 Mid-Infrared band: overview of the different interpretations
In general, the most prominent feature in the optical conductivity spectra of -phase BEDT-TTF salts is the broad mid-infrared hump. It peaks around 2200 cm-1 for the polarization and at 3200 cm-1 in the direction, where it exhibits a more complicated double structure. Albeit it seems obvious – in particular when cooling down – that two contributions add up for this band, the explanations proposed over the years took into account only one single process. It was suggested that the mid-infrared peak is due to charge transfer inside the dimerSugano89 ; Eldridge91b ; Tamura91 ; Kornelsen92 ; Kornelsen92b or due to transitions between the Hubbard bands formed by the correlated conduction electrons.Rozenberg95 ; McKenzie98 ; SAS04
Eldridge and coworkers Eldridge91b ; Kornelsen92 first suggested that the mid-infrared peak is due to charge-transfer bands with the excitations confined to the dimers and the charge transfer occurring between adjacent molecules. The polarization dependence is explained by different interactions between neighboring dimers (Fig. 1a). The arguments were supported by electronic band-structure calculations of the -phase salts performed by Whangbo and collaborators on the basis of the tight-binding approximation.Jung89 ; Geiser91 The highest occupied band is half filled with only very little difference in bandwidth and density of states at the Fermi level when going from -(BEDT-TTF)2Cu[N(CN)2]Cl to -(BEDT-TTF)2Cu[N(CN)2]Br. Obviously this is a very rough approximation which can explain neither the semiconducting behavior at ambient temperature, nor a redistribution of the spectral weight from this mid-infrared maximum to the Drude-peak for compounds with high Br concentration on cooling (discussed in Part II), nor the different ground states of the compounds.
A more consistent picture was achieved when both components of the optical conductivity, the Drude-like contribution and the mid-infrared hump were explained in the framework of a half-filled two-dimensional system with strong electronic correlations.Kino96 ; Mori99 ; Seo04 The structure of the phase was mapped on an anisotropic triangular lattice, each site presenting one dimer as depicted in Fig. 1b. The interdimer overlap integrals define the hopping between the sites of a triangular half-filled lattice considered by theory, they are meV and meV.Kino96 ; Seo04 The intradimer overlap plays the role of the effective on-site Coulomb interaction .Kino96 ; Kanoda97 ; Mori99 Consequently, increases with dimerization: for the Cl-analog b1 is slightly higher which causes larger . Ab-initio calculations by Fortunelli and PainelliFortunelli97 give the value of eV for a dimer in -(BEDT-TTF)2Cu[N(CN)2]Br; this is in agreement with experiments.
It has been predicted by theory that the Mott-insulator transition in a two-dimensional lattice typically occurs when is comparable to the bandwidth . In the present case , implying that we are very close to the metal-insulator transition. increases when going from Br to Cl anions, i.e. moving from right to left in the phase diagram (Fig. 2) and leads to localization of the charge carriers.remark2 Following these considerations, recentlySAS04 the experimentally observed mid-infrared band around 3000 cm-1 was associated with the transition between the Hubbard bands at .
The application of dynamical mean-field theory to the metallic side of the phase diagram suggestsMcKenzie98 ; Merino00a that besides the mid-infrared band around , a quasiparticle peak at the Fermi level grows with temperature below , where is the overlap integral. Due to transitions between the coherent quasiparticle band and the Hubbard bands, a new peak is supposed to develop around for .
IV.2 Mid-Infrared band: our experimental results
Our present investigation of the substitution series -(BEDT-TTF)2Cu[N(CN)2]BrxCl1-x sheds new light on the above formulated controversy because all features were traced when going from the metallic to the insulating phase both by changing temperature and the relative correlation strength . This enabled us to disentangle the components coming from charge transfer inside the (BEDT-TTF)2 dimers and between the dimers. We propose that the intradimer transitions cause the high-frequency contribution Ldimer, while the band LHubbard at lower frequencies is ascribed to interdimer transitions, i.e., to the transitions between the Hubbard bands.
Generally, the band of the intradimer transition is expected to appear at higher frequencies compared to the transition between the dimers. It was already shown for molecular chains that the high-frequency band vanishes when the dimerization is reduced;Meneghetti91 calculations were also performed on a two-dimensional -like structure leading to similar conclusions.Visentini98 The same result is obtained by the cluster model,YAR96 when extending it to tetramers and hexamers; the electronic transitions summing up the intradimer and interdimer excitations shift to lower frequencies and get broader compared to the pure intradimer one.
In both reflectivity and conductivity spectra (Figs. 6 - 8) for light polarized parallel to the axis, two bands can be clearly distinguished: a narrow high-frequency peak Ldimer and a broad peak located at lower frequencies. Contrary, in -direction there is no clear separation visible between Ldimer and in the optical spectra (Figs. 4 and 5). Such an anisotropy in the mid-infrared range is well documented for these -salts.Dressel04 ; Drichko04 However, the detailed analysis based on the cluster model given below will show that despite the anisotropy both peaks are present in either orientations.
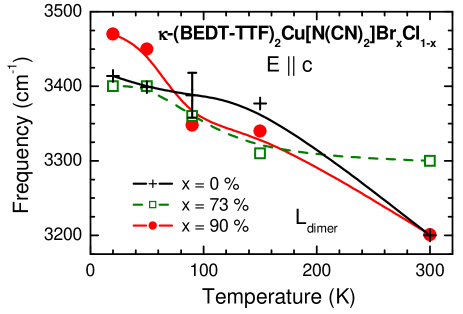
The temperature dependence of the Ldimer frequency () is plotted in Fig. 9 for different Br concentrations. Within the uncertainty of the Lorentz fit, at ambient temperature the position of the high-frequency oscillator Ldimer does not show a distinct dependence on the Br content along the axis; also the oscillator strength of this band does not vary substantially. In general there is an upward shift of approximately 100 to 200 cm-1 when going down to K. We attribute this blue shift to the thermal contraction of the single crystals which slightly enhances the intradimer transfer integral b1 (Fig. 1a), i.e. the intradimer overlap increasesMori99 . The difference between metallic and insulting compounds is seen at 50 K and lower: while the temperature dependent high-frequency shift of Ldimer is more enhanced upon cooling in the metallic samples with and 85%, it levels off for the insulating ones with low Br concentration. Obviously, the Ldimer oscillator frequency is not considerably affected by the opening of the Mott-Hubbard gap at K which results in an increase of the dc resistivity of several orders of magnitude.
The intradimer transition, i.e., a charge transfer between the two face-to-face arranged BEDT-TTF molecules is expected to be strongly coupled to the totally symmetric molecular vibrations. Thus an detailed analysis of the experimentally obtained temperature dependence of their spectra and a comparison to the theoretical predictions of the cluster model will be the key to a final assignment of the electronic features in the spectra.
IV.3 Vibrational features
The sharp absorption features in the frequency range between 400 cm-1 and 1600 cm-1 are known to be totally-symmetric vibrations activated by coupling with electronic excitations. In the course of numerous vibrational studies on the -phase BEDT-TTF salts, Eldridge’s groupKornelsen92b ; Eldridge95 ; Eldridge96b ; Eldridge97 and othersDRO94 ; McGuire01 presented a complete assignment of the totally-symmetric vibrations. Here we use the C2h symmetry assignment which takes a deformation of a BEDT-TTF molecule inside the crystal into account.remark3 In our work we could follow not only the temperature, but also the doping-dependence of these features, that improves our interpretation of the spectra.
The most prominent vibration involves a symmetric stretching of the C=C double bonds;remark6 at room temperatures it is observed at about 1240 cm-1 along the -axis and at 1280 cm-1 along the -axis in the spectra of the -(BEDT-TTF)2Cu[N(CN)2]BrxCl1-x. We estimate the center frequency of the band by fitting it with a Lorentzian, disregarding the anti-resonances due to the mode for a moment. As can be seen from Fig. 11a and c, with decreasing temperature ( K) the modes slightly shift to higher frequencies in about the same manner for all compounds. As is reduced this tendency enhances further for and 90%: the total shift amounts to approximately 45 cm-1 for , and less than 5 cm-1 in direction; the variation saturates at very low temperatures. For the insulating compounds with low Br content, the mode even reverses its temperature dependence below K and becomes softer. Except some gradual difference, the behavior is very similar for both orientations. Below 50 K, the mode becomes sharper in the insulating samples while it broadens and seems to be weaker for high Br content.
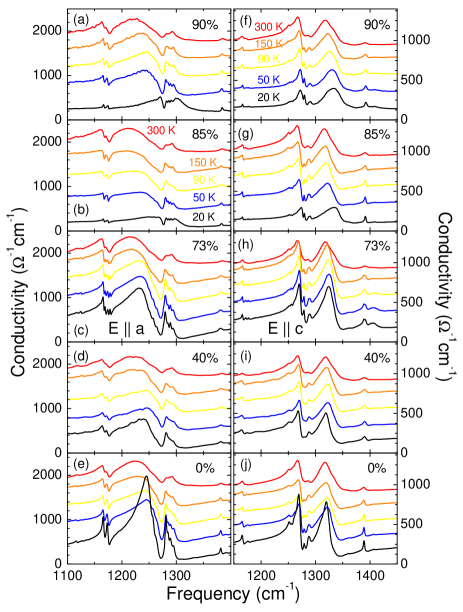
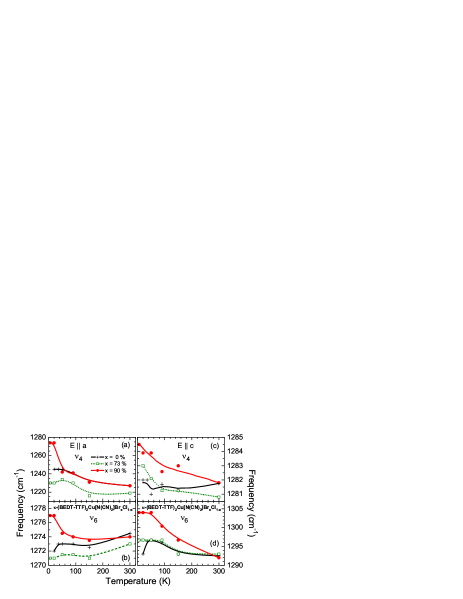
The frequency of the mode (vibration of the CH2 groups) overlaps with the broad emv-coupled band. In Fig. 10 the excitation is seen as an antiresonance around 1270 to 1280 cm-1 for and slightly higher for the perpendicular direction. At low temperatures, four bands of are resolved, originating from four distinct CH2 groups per unit cell. We follow the temperature dependence by choosing the minimum around 1273 cm-1. Again, for low Br content the mode gradually moves down in frequency with decreasing temperature, while it significantly shifts to higher values for and 90% as presented in Fig. 11c. The same temperature dependence of is observed parallel to (Fig. 11d). A similar temperature and Br-concentration dependence is seen for the peaks of the emv-coupled ‘ring-breathing’ mode of the BEDT-TTF moleculeWesolowshi05 at 870 cm-1 and 885 cm-1 and of the at about 430 cm-1. Accordingly, the peaks are pretty intense in the insulating state, and are less significant in the spectra for high Br concentration.
In contrast to the emv-coupled modes, the infrared active vibration of BEDT-TTF molecule detected around 1383 cm-1 (Fig. 10) and CN-stretch vibration of the anion layer observed around 2160 cm-1 do not depend on the Br-concentration and show no pronounced temperature dependence besides the expected hardening with cooling. Therefore, since the charge on the BEDT-TTF molecules is not redistributed in -(BEDT-TTF)2Cu[N(CN)2]BrxCl1-xwhen the samples are cooled down, the characteristic temperature dependence of the emv-coupled Ag modes has to be due to the electronic excitation to which they are coupled.
IV.4 Excitations localized on dimers: charge transfer and emv-coupled features
The cluster model of M.J. RiceRice76 and Delhaes and Yartsev Yartsev93 ; YAR96 describes the optical properties of molecular clusters with arbitrary geometry and equilibrium charge density distribution. The model describes optically activated charge transfer between the molecules in a cluster, the parameters defining this transition are transfer integral between the molecules and Coulomb repulsion of two electrons on one molecule. In addition, this model takes into account an activation of totally symmetric vibrations by this charge transfer in a cluster; the strength of this coupling is defined by the coupling constants , specific for each given molecular vibration. It gives a correlation between a charge transfer electronic transition and the emv-coupled features. The vibrational modes become infrared active by emv coupling to the charge-transfer excitation; and they are shifted down in frequency with respect to the corresponding Raman modes.Eldridge95 ; Eldridge96b ; Eldridge97 The shift and the intensity of the emv-coupled features depend on the coupling constants and on the position of the respective charge-transfer band. The model taking into account two perpendicular dimers of BEDT-TTF molecules successfully describes the mid-infrared peak and emv-coupled features in the room-temperature spectra of the -phase salts,Vlasova92 ; YAR96 while it does not account for the metallic behavior; thus it is not able to mimic the appearance of a Drude-peak in the compounds with high Br content.
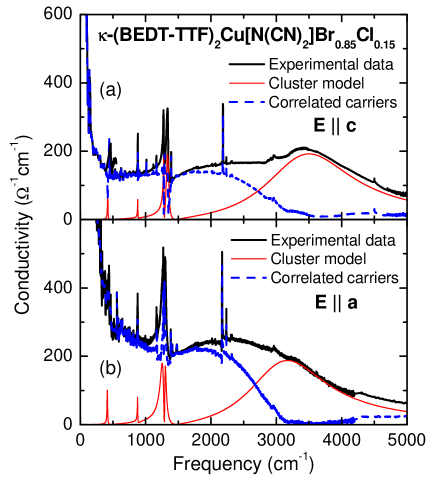
In this work we use the simplest dimer model to describe the emv-coupled features present also in the metallic phase, and to verify the assignment of the mid-infrared peak Ldimer to the interdimer charge transfer. As an example, in Fig. 12a we show a fit by the dimer model of the 85 % Br compound spectra. For the dimer model with eV and transfer integral term eV can reasonably well predict both the position of the high-frequency electronic maximum Ldimer and of the emv-coupled features. The value of the transfer integral energy is somewhat lower than those received by the Hückel method: eV.Mori99 ; Seo04 Taking into account the very different approaches of these methods, the agreement is quite good. The differential spectrum of the experimentally obtained conductivity and the calculations by the dimer model shows that the intradimer transition is responsible for nearly all the intensity of the emv-coupled features. With other words, in the low-temperature metallic state the intradimer transition interacts strongly with the totally symmetric vibrations, while this process is less important for the charge transfer between the dimers.
In order to identify the intradimer transition band for polarization , we start with the respective parameters obtained for the . Only the position of the intradimer charge transfer is varied by changing the transfer integral b1 until the positions of emv-coupled features, which are considerably softer along axis, match the experiment. Consequently, the position of the intradimer transition follows these emv-coupled vibrations. The fit with eV suggests that the Ldimer has its maximum at about 2900 cm-1 in the direction, compared to 3300 cm-1 found for .
For a further analysis of the data focused on itinerant charge carriers, we subtract the results of the cluster-model calculations from the experimental data. As seen in Fig. 12, the remaining intensity of the emv-coupled vibrational modes is small; this confirms that they are only very weakly coupled to charge carriers which are not localized on the dimers. Interestingly, this is only true for the metallic samples with high Br content (85% and 90%). Once we approach the insulating side of the phase diagram (low Br concentration), a charge transfer only in a dimer does not account for all the intensity of the emv-coupled features anymore. These spectra are much closer to those proposed by the tetramer model,Vlasova92 indicating that once the inter-dimer excitations get localized they are also coupled to the totally-symmetric vibrations of BEDT-TTF molecule.
IV.5 Anisotropy of the spectra
One of the striking features of the -phase spectra is the anisotropy, which from the first glance one would not expect on an orthorhombic unit cellremark7 with two crystallographically identical dimers and an angle between the optical axes and the dimers close to 45 degrees. This anisotropy involves the intradimer transition, and above we showed that the cluster model gives a good explanation for the anisotropy in the vibrational features.
It should be noted that the distance between the dimers is different in and direction, with some preference along the axis, as depicted in Fig. 1. In addition, the molecules are not standing upright on the () plane, but considerably tilted in direction (in an alternating fashion in such a way that adjacent layers form a herring-bone pattern).Williams92 The higher reflectivity observed in the E a polarization in these compounds suggests that a projection of the dipole moment for all the electronic transitions onto this axis is higher.
An explanation for the difference in position and intensity of the intradimer charge transfer band Ldimer observed parallel to and axes might be given by a so-called Davydov splitting.Davidov71 . In the present case of the -salts, the dimers are taken as the principal unit, i.e. a ‘big molecule’ with one hole and spin residing on it. In general, if the unit cell possesses a center of symmetry and two identical molecules in the cell, a Davydov splitting of the intra-molecular electronic transitions between the upper molecular orbitals (intra-molecular excitons, Frenkel excitons) is observed.Davidov71 In this case two bands which are distinct in position and intensity are expected parallel to the symmetry axes of the unit cell. Applied to the present case, the electronic spectrum exhibits two distinct bands for the two polarizations parallel to the symmetry axes of the unit cell. Thus, the anisotropy of the intradimer transition can be considered as a Davydov splitting of the dimer excitation. Indeed, the less symmetrical (monoclinic) -(BEDT-TTF)2Hg(SCN) (=Cl, Br) show less anisotropy of the spectraVlasova97 than the presented orthorhombic compounds.
IV.6 Allocating the transition between the Hubbard bands
From the analysis presented above, we conclude that the lower-frequency contribution LHubbard to the mid-infrared band originates from excitations across the Mott-Hubbard gap which allows us to determine the effective Coulomb repulsion to be approximately 2200 cm-1. This assignment is supported by comparing our data to spectra of the superconductor -(BEDT-TSeF)4Hg2.89Br8. The replacement of the four inner sulphur atoms with selenium reduces the on-site Coulomb repulsion but increases the transfer integrals to neighboring molecules. Therefore, the BEDT-TSeF-based analogs are much closer to the normal metallic state; the contributions of itinerant and localized charge carriers are well separated in the optical spectra. It has clearly been observedDrichko04 that with decreasing temperatures the contribution of the electrons in the conduction band (Drude-peak and transitions between Hubbard bands) shifts to lower frequencies while there is a blue shift of the excitations of the localized charge carriers, similar to the metallic compounds studied in this work.
Calculations by Merino and McKenzieMerino00b reveal that in strongly correlated metals the coupling between electrons and phonons leads to a non-monotonic temperature dependence of the vibrational modes near the coherence temperature . The shift is most pronounced (up to 5%) for phonons in the energy range comparable to , and becomes weaker for larger or smaller frequencies. Raman measurements perfectly agree with these predictions.Lin98 Evidently, the situation is more complicated for infrared data, as the vibrations are activated only by emv-coupling and influence in frequency and intensity by the charge excitations within the dimers. Nevertheless, this electron-phonon coupling might be an explanation for a softening of and below K for the compounds -(BEDT-TTF)2Cu[N(CN)2]BrxCl1-x with and 40% where the electronic correlations are strongest. A close inspection reveals that the higher frequency mode exhibits a similar behavior for the insulating samples with low Br content, but weaker; while no change is observed for the far-infrared vibration . This also suggests that the effective Coulomb repulsion is of the order of 2000 to 2500 cm-1.
V Conclusion
Our comprehensive analysis of the temperature- and Br-concentration dependence of mid-infrared and emv-coupled features in -(BEDT-TTF)2Cu[N(CN)2]BrxCl1-x allows us to distinguish two contributions in the mid-infrared part of the spectra. This interpretation is supported by the calculations which describe a charge transfer in a dimer and its coupling to the totally symmetric vibrations of BEDT-TTF molecule. The higher frequency Ldimer band (3300 cm-1 for the polarization and presumably around 2900 cm-1 for ) originates from the charge transfer between the BEDT-TTF molecules in dimers. This charge-transfer within the dimers is coupled to the intramolecular vibrations of BEDT-TTF and is responsible for the major part of the emv-coupled features intensity for the metallic compounds, while in the insulating materials the lower-frequency contribution is presumably also coupled with vibrations. The lower-frequency contribution to the mid-infrared band LHubbard located at 2200 cm-1 is isotropic and assigned to transition between two Hubbard bands which form due to strong electronic correlations. In Part II the dynamical properties of the itinerant charge carriers will be analyzed and discussed in detail, including extensive calculations by dynamical mean-field-theory.
VI Acknowledgments
The authors are grateful to Alain Barreau for his help at the microscopic characterization of the sample concentrations. Belal Salameh performed the dc measurements. We acknowledge the helpful discussions with Jaime Merino and Ross McKenzie, who initiated the study many years ago, and A. Girlando, M. Masino, and A. Painelli. The project was partially supported by the Deutsche Forschungsgemeinschaft (DFG). ND is grateful to the Alexander von Humboldt-Foundation for the continuous support. B.P., V.S. and R.V. thank V. Yartsev for useful discussions and the algorithm of calculations by a cluster model.
References
- (1) D. Jérome, in: Organic Conductors, edited by J.-P. Farges (Marcel Dekker, New York, 1994), p. 405.
- (2) T. Ishiguro, K. Yamaji, and G. Saito, Organic Superconductors, 2nd edition (Springer-Verlag, Berlin, 1998).
- (3) R.H. McKenzie, Science, 278, 821 (1997).
- (4) H. Seo, C. Hotta, H. Fukuyama, Chem. Rev. 104, 5005 (2004).
- (5) M. Dressel and N. Drichko, Chem. Rev. 104, 5689 (2004).
- (6) T. Mori, H. Mori, and S. Tanaka, Bull. Chem. Soc. Jpn. 72, 179 (1999).
- (7) By now, the observations are not completely understood: the coupling between the layers is certainly crucial, however, simple volume effects cannot explain the behavior.
- (8) A. Georges, G. Kotliar, W. Krauth, and M.J. Rozenberg, Rev. Mod. Phys. 68, 13 (1996).
- (9) J. Merino and R. H. McKenzie, Phys. Rev. B 61, 7996 (2000).
- (10) M. Lang and J. Müller, Organic Superconductors, in: The Physics of Superconductors, Vol. 2, edited by K.H. Bennemann and J.B. Ketterson (Springer-Verlag, Berlin, 2004), p. 453.
- (11) K. Miyagawa, A. Kawamoto, and K. Kanoda, Phys. Rev. Lett. 89, 017003 (2002).
- (12) S. Lefebvre, P. Wzietek, S. Brown, C. Bourbonnais, D. Jérome, C. Meźière, M. Fourmigué, and P. Batail, Phys. Rev. Lett. 85, 5420 (2000).
- (13) P. Limelette, P. Wzietek, S. Florens, A. Georges, T.A. Costi, C. Pasquier, D. Jerome, C. Meziere, and P. Batail, Phys. Rev. Lett. 91, 016401 (2003).
- (14) F. Kagawa, T. Itou, K. Miyagawa, and K. Kanoda, Phys. Rev. B 69, 064511 (2004); F. Kagawa, T. Itou, K. Miyagawa, and K. Kanoda, Phys. Rev. Lett. 93, 127001 (2004); F. Kagawa, K. Miyagawa, and K. Kanoda, Nature 436, 534 (2005).
- (15) J. E. Eldridge, K. Kornelsen, H. H. Wang, J. M. Williams, A. V. D. Crouch, and D. M. Watkins, Solid State Commun. 79, 583 (1991).
- (16) M. Tamura, H. Tajima, K. Yakushi, H. Kuroda, A. Kobayashi, R. Kato, and H. Kobayashi, J. Phys. Soc. Jpn. 60, 3861 (1991).
- (17) K. Kornelsen, J. E. Eldridge, H. H. Wang, H. A. Charlier, and J. M. Williams, Solid State Commun. 81, 343 (1992).
- (18) J.E. Eldridge, Y. Xie, H.H. Wang, J.M. Williams, A.M. Kini, and J.A. Schlueter, Spectrochim. Acta A 52, 45 (1996); idem, Mol. Cryst. Liq. Cryst. 284, 97 (1996).
- (19) R.M. Vlasova, O.O. Drozdova, V.N. Semkin, N.D. Kushch, and E.B. Yagubskii, Phys. Solid State 38, 481 (1996).
- (20) J.J. McGuire, T. Rõõm, A. Pronin, T. Timusk, J.A. Schlueter, M.E. Kelly, and A.M. Kini, Phys. Rev. B 64, 094503 (2001)
- (21) T. Sasaki, I. Ito, N. Yoneyama, N. Kobayashi, N. Hanasaki, H. Tajima, T. Ito, and Y. Iwasa, Phys. Rev. B 69, 064508 (2004).
- (22) The optical study of an alloy -(BEDT-TTF)2Cu[N(CN)2]Br0.5Cl0.5 was performed in mid-infrared and could not give an information about presence or absence of a Drude-peak.
- (23) R.M. Vlasova, O.O. Drozdova, V.N. Semkin, N.D. Kushch, and E.B. Yagubskii, Phys. Solid State 35, 408 (1993).
- (24) O.O. Drozdova, V.N. Semkin, R.M. Vlasova, N.D. Kushch, and E.B. Yagubskii, Synthetic Metals 64, 17 (1994).
- (25) B.V. Petrov, V.N. Semkin, R.M. Vlasova, V.M. Yartsev, N.D. Kushch, and A. Graja, in: Molecular Low-Dimensional and Nanostructured Materials for Advanced Applications, edited by A. Graja et al. (Kluwer Academic Publ., Dordrecht, 2002), p. 259.
- (26) K.D. Troung, B. Danilovic, D. Achkir, S. Jandl, and M. Poirier, Synth. Met. 85, 1577 (1997).
- (27) M. Dumm, D. Faltermeier, N. Drichko, M. Dressel, C. Meziere, P. Batail, J. Merino, and R. McKenzie, to be published
- (28) D. Schweitzer, private communication.
- (29) The small size of the crystals limited our possibility of low-frequency measurements. In the case of the % sample, the crystal was so tiny, that the measurements in the FIR range were only possible without a polarizer due to the weak signal. Since the anisotropy of the spectra in the FIR range is low, it was possible to use the data for both polarizations.
- (30) The pure compound -(BEDT-TTF)2Cu[N(CN)2]Cl follows the rise in down to about 30 K, at lower temperatures the resistivity levels off at a value of approximately cm and even shows a slight drop around K. This behavior is well documented in literatureWilliams90 ; Ito96 ; Kobayashi91 and associated with traces of superconductivity induced by internal stress or surface effects. Similar effects are seen in samples with very low Br content .Sushko93
- (31) J.M. Williams, A.M. Kini, H.H. Wang, K.D. Carlson, U. Geiser, L.K. Montgomery, G.J. Pyrka, D.M. Watkins, J.M. Komers, S.J. Boryschuk, A.V. Strieby Crouch, W.K. Kwok, J.E. Schierber, D.L. Overmyer, D. Yung, and M.H. Whangbo, Inorg. Chem. 29, 3271 (1990); H.H. Wang, K.D. Carlson, U. Geiser, A.M. Kini, A.J. Schultz, J.M. Williams, L.K. Montgomery, W.K. Kwok, U. Welp, K.G. Vandervoort, S.J. Boryschuk, A.V. Strieby Crouch, J.M. Komers, D.M. Watkins, J.E. Schierber, D.L. Overmyer, D. Yung, J.J. Novoa, and M.H. Whangbo, Synth. Met. 41-43, 1983 (1991).
- (32) H. Ito, T. Ishiguro, M. Kubota, and G. Saito, J. Phys. Soc. Jpn. 65, 2987 (1996).
- (33) H. Kobayashi, A. Miyamoto, T. Naito, R. Kato, A. Kobayashi, and J.M. Williams, Chem. Lett. 1997 (1991).
- (34) V.A. Bondarenko, Yu.V. Sushko, V.I. Barchuk, V.S. Yefanov, V.V. Dyakin, M.A. Tanatar, N.D. Kushch, and E.B. Yagubskii, Synth. Met. 56, 2386 (1993); Yu.V. Sushko, K. Andres, N.D. Kusch, and E.B. Yagubskii, Solid State Commun. 87, 589 (1993); Yu.V. Sushko, T. Ishiguro, K. Andres, S. Horiuchi, G. Saito, N.D. Kushch, and E.B. Yagubskii, J. Supercond. 7, 937 (1994); H. Posselt, H. Müller, K. Andres, Yu.V. Sushko, and G. Saito, Synth. Met. 70, 917 (1995).
- (35) C.C. Homes, M. Reedyk, D.A. Cradles, and T. Timusk, Applied Optics 32, 2976 (1993).
- (36) M. Dressel and G. Grüner, Electrodynamics of Solids (Cambridge University Press, Cambridge, 2002).
- (37) K. Kornelsen, J. E. Eldridge, H. H. Wang, and J. M. Williams, Phys. Rev. B 44, 5235 (1992).
- (38) J.E. Eldridge, C.C. Homes, H.H. Wang, A.M. Kini, and J.M. Williams, Spectrochim. Acta A 51, 947 (1995)
- (39) J.E. Eldridge, Y. Xie, Y. Lin, C.C. Homes, H.H. Wang, J.M. Williams, A.M. Kini, and J.A. Schlueter, Spectrochim. Acta A 53, 565 (1997)
- (40) Previously, the assignment of the modes was done assuming symmetry of the BEDT-TTF molecule (plane BEDT-TTF molecule).Kozlov87 ; Kornelsen92 ; Eldridge95 ; Eldridge96b ; Eldridge97 ; Dressel04 By now the general agreement is that the molecules in -(BEDT-TTF)2Cu(NCS)2 only have due to the twisted ethylene groups Meneghetti86 ; Girlando04 ; Williams92 leading to 19 A1 totally symmetric modes. For the -(BEDT-TTF)2Cu[N(CN)2]Br and -(BEDT-TTF)2Cu[N(CN)2]Cl-family the molecules are eclipsed and exhibit only symmetry, as recently pointed out in Ref. Wesolowshi05, .
- (41) M.E. Kozlov, P.I. Pokhodnia, and A.A. Yurchenko, Spectrochim. Acta A 43, 323 (1987); M.E. Kozlov, P.I. Pokhodnia, and A.A. Yurchenko, Spectrochim. Acta A 45, 437 (1989).
- (42) M. Meneghetti, R. Bozio, and C. Pecile. J. Phys. I (France) 47, 1377 (1986); Synth. Met. 19, 143 (1987).
- (43) A. Girlando, M. Masino, A. Brillante, R.G. Della Valle, and E. Venuti, to be published in: Horizons in Superconductivity Research (Nova Science Publisheres, New York, 2004).
- (44) J. M. Williams, J. R. Ferraro, R. J. Thorn, K. D. Carlson, U. Geiser, H. H. Wang, A. M. Kini, and M. H. Whangbo, Organic Superconductors (Prentice Hall, Englewood Cliffs NJ, 1992).
- (45) R. Wesolowski, J.T. Haraldsen, J. Cao, J.L. Musfeldt, I. Olejniczak, J. Choi, Y.J. Wang, and J.A. Schlueter, Phys. Rev. B 71, 214514 (2005).
- (46) T. Sugano, H. Hayashi, M. Kinoshita, and K. Nishikida, Phys. Rev. B 39, 11387 (1989).
- (47) M.J. Rozenberg, G. Kotliar, H. Kajueter, G.A. Thomas, D.H. Rapkine, J.M. Honig, and P. Metcalf, Phys. Rev. Lett. 75, 105 (1995); M.J. Rozenberg, G. Kotliar, H. Kajueter, Phys. Rev. B 54, 8452 (1996).
- (48) R.H. McKenzie, Comments Cond. Mat. 18, 309 (1998).
- (49) D. Jung, M. Evain, J.J. Novoa, M.H. Whangbo, M.A. Beno, A.M. Kini, A.J. Schultz, J.M. Williams and P.J. Nigrey, Inorg. Chem. 28, 4516 (1989).
- (50) U. Geiser, A.J. Schultz, H.H. Wang, D.M. Watkins, D.L. Stupka, J.M. Williams, J.E. Schirber, D.L. Overmyer, D. Jung, J.J. Novoa and M.H. Whangbo, Physica C174, 475 (1991).
- (51) H. Kino and H. Fukuyama, J. Phys. Soc. Jpn. 64, 2726 (1995); ibid. 64, 4523 (1995); ibid. 65, 2158 (1996).
- (52) K. Kanoda, Hyperfine Interact. 104, 235 (1997).
- (53) A. Fortunelli and A. Painelli, Phys. Rev. B 55, 16088 (1997).
- (54) By comparing the effects of ‘chemical’ and hydrostatic pressure, Mori et al.Mori99 point out that the application of the hydrostatic pressure (but also thermal contraction) to the Cl compound reduces the b1/p ratio, leading a less correlated state.
- (55) N. Drichko, B. Petrov, V.N. Semkin, R.M. Vlasova, O.A. Bogdanova, E.I. Zhilyaeva, R.N. Lyuboskaya, I. Olejniczak, H. Kobayashi, and A. Kobayashi, J. Phys. IV (France) 114, 305 (2004); R.M. Vlasova, N.V. Drichko, B.V. Petrov, V.N. Semkin, E.I. Zhilyaeva, R.N. Lyuboskaya, I. Olejniczak, A. Kobayashi, and H. Kobayashi, Phys. Solid State 46, 1985 (2004).
- (56) As discussed in the following paragraph, the mode appears as a double peak due to the antiresonance. We fit the complete feature by a Lorentzian and choose the center frequency, while commonly the upper peak is listed as the frequency.
- (57) M.J. Rice, Phys. Rev. Lett. 37, 36 (1976).
- (58) V.M Yartsev , O.O. Drozdova, V.N. Semkin and R.M. Vlasova, J. Phys. I (France) 6, 1673 (1996); V.M. Yartsev, in: Materials and Measurements in Molecular Electronics, ed. by K. Kajimura and S. Kanoda (Springer-Verlag, Berlin 1996), p. 189; V. M. Yartsev and A. Graja, Int. Journ. of Mod. Phys. B, 12, 1643 (1998).
- (59) Delhaes P., Yartsev V.M., Advances in Spectroscopy, 22, R.J.H. Clark, R.E. Hester Eds. John Wiley and Sons, 1993 , 199. V. M. Yartsev, O. Fichet, J.-P. Borgion and P. Delhaes. J. Phys. II France 3, 647 (1993)
- (60) M. Meneghetti, Phys. Rev. B 44, 8554 (1991)
- (61) G. Visentini, M. Masino, C. Bellitto, and A. Girlando, Phys. Rev. B 58, 9460 (1998).
- (62) R.M. Vlasova, S.Ya. Priev, V.N. Semkin, R.N. Lyubobskaya, E.I. Zhilyaeva, E.B. Yagubskii, and V.M. Yarsev, Synth. Met. 48, 129 (1992)
- (63) The dihedral angle is about 92∘ which makes the charge transfer between the dimer contribute stronger in the direction.
- (64) A.S. Davydov, Theory of Molecular Excitons (Plenum, New York, 1971)
- (65) R.M. Vlasova, N.V. Drichko, O.O. Drozdova, and R.N. Lyubovskaya, Phys. Solid State 39, 1165 (1997).
- (66) J. Merino and R. H. McKenzie, Phys. Rev. B 62, 16442 (2000).
- (67) Y. Lin, J.E. Eldridge, H.H. Wang, A.M. Kini, M.E. Kelly, J.M. Williams, and J.A. Schlueter, Phys. Rev. B 58, R599 (1998).