Time-dependent universal conductance fluctuations in mesoscopic Au wires: implications
Abstract
In cold, mesoscopic conductors, two-level fluctuators lead to time-dependent universal conductance fluctuations (TDUCF) manifested as noise. In Au nanowires, we measure the magnetic field dependence of TDUCF, weak localization (WL), and magnetic field-driven (MF) UCF before and after treatments that alter magnetic scattering and passivate surface fluctuators. Inconsistencies between and strongly suggest either that the theory of these mesoscopic phenomena in weakly disordered, highly pure Au is incomplete, or that the assumption that the TDUCF frequency dependence remains to very high frequencies is incorrect. In the latter case, TDUCF in excess of expectations may have implications for decoherence in solid-state qubits.
pacs:
73.23.-b,73.50.-h,72.70.+m,73.20.FzTwo-level systems (TLS) are ubiquitous localized excitations in disordered solids, and can profoundly affect thermodynamic, dielectric, and acoustic propertiesEsquinazibook . In mesoscale metals, scattering of phase coherent conduction electrons by TLS results in time-dependent (TD) universal conductance fluctuations (UCF)BirgePRL89 . Because of the TLS distribution, TDUCF typically have a measured frequency dependence. The interplay of TLS and conduction electrons may be relevant to correlated electronic statesRalphPhysRevL92 ; RalphPhysRevL94 and dephasingZawadowskiPRL99 ; ImryEuroPhysL99 ; AfoninPRB02 . Interest has recently been renewed due to the importance of noise in limiting coherence in candidate solid-state qubitsPaladinoPRL02 ; HarlingenPhysRevB04 ; KuPhysRevL05 ; SchnirmanPhysRevL05 ; GalperinPRL06 .
Electronic quantum interference produces other phenomena used to investigate decoherence, including weak localization (WL) magnetoresistanceBergmannPhysRep84 , and UCF as a function of magnetic field (MFUCF)WebbPRL85 ; SkocpolPRL86 ; DebrayPRL89 ; MaillyJP92 . Analysis of WL and TDUCF as a function of magnetic field is expected to give identical coherence lengthsAleinerPRB02 , , if electron-electron scattering is the only small-energy-transfer process, as expected in clean normal metals at low temperatures. Even at temperatures where electron-phonon scattering is relevant, equality between the WL and TDUCF-inferred coherence lengths is still expected. The temperature at which electron-phonon scattering becomes important is clearly visible in a log-log plot of coherence length versus temperature. As temperature is increased, the slope of this curve will become more negative (from to ) indicating a crossover from electron-electron dominated dephasing to electron-phonon dephasing. Comparisons between and in AuPd have shown strong agreementTrionfiPRB04 , while comparisons in clean, weakly disordered Ag films and wires have shown an unexpected disagreement below 10 KHoadleyPRB99 ; TrionfiPRB05 , when electron-electron decoherence begins to dominate electron-phonon scattering.
We have suggestedTrionfiPRB05 that this apparent disagreement results from an analysis based on an incorrect assessment that the TDUCF are unsaturated - that is, that TLS-induced conductance changes within a coherent volume are much smaller than . The saturated or unsaturated character of TDUCF depends on the microscopic nature of the TLS, and determines which expression is used to infer from the field dependence of the noiseStonePRB89 . Without detailed microscopic knowledge of the TLS in a given material, one cannot know a priori whether the TDUCF will be saturated or unsaturated. Since the TLS are assumed to have a broad distribution of energy splittings and relaxation times, they likely also have a broad distribution of impacts on the conductance. The longer the coherence length, the more of the TLS distribution is sampled within a single coherent volume.
Previously, saturation has been assessed by a simple consistency checkBirgePRB90 : How many decades of frequency would be necessary for the integrated TDUCF noise power, , to equal the variance, , of the MFUCF? Here is the measured voltage noise power, is the sample resistance, and is the measuring current. If a required bandwidth far in excess of the 20 decades reasonable for TLSFengBook91 is found (as it has been in Refs. BirgePRB90 ; HoadleyPRB99 ; TrionfiPRB04 ; TrionfiPRB05 , for example), this implies unsaturated TDUCF noise.
In this paper, we show that the assumption of unsaturated TDUCF noise is inconsistent with WL data and systematic measurements based on tuning paramagnetic impurity and TLS concentrations. Either the theory of these mesoscopic phenomena in pure, weakly disordered metals is incomplete, or there is a flawed assumption in the consistency check described above. We suggest that the most likely flaw is that the TLS ensemble has a power spectrum that deviates from the assumed, extrapolated distribution. Any excess fluctuations at high frequencies may have implications for decoherence of solid state qubits. We compare and , and and in quasi-1D Au nanowires, in two sets of experiments. First, we tune by systematically varying the concentration of paramagnetic impurities at the Au interface in repeated measurements on a single sample. Second, we systematically modify the TLS distribution by surface passivation of the Au via a self assembled monolayer (SAM) of alkanethiol molecules. Analysis of the data before and after these modifications shows the apparent disagreement between and results from incorrectly fitting the TDUCF versus magnetic field data using the unsaturated crossover function.
I Fabrication and measurements
All samples were patterned on undoped GaAs by electron beam lithography. High purity (99.9999%) Au was deposited using an electron beam evaporator. Samples ranged from 60-80 nm in width and were all roughly 15 nm thick. Each current or voltage lead is 1 m wide, and the leads are spaced 20 m apart edge-to-edge. There are a total of seven leads branching off from each wire. An anomalous paramagnetic impurity effect was seen while using Ti as an adhesion layer. We used this deliberately in some samples to lower the coherence length via a (99.995%) Ti adhesion layer of 1.5 nm. All other samples were made with no adhesion layer. Samples were placed in a 4He cryostat and all measurements were performed between 2 and 14 K using standard lock-in techniquesTrionfiPRB05 . To limit additional averaging associated to the drive current, TDUCF and MFUCF measurements were always made at the same currents. An ac five-terminal bridge measurementScofieldRevSciInst87 ; TrionfiPRB04 is employed for TDUCF and MFUCF measurements.
| Sample | [nm] | [nm] | [m] | [m] |
|---|---|---|---|---|
| A | 80 | 15 | 7.76 | 6.03 |
| B | 70 | 15 | 6.87 | 6.32 |
| C | 75 | 15 | 8.31 | 9.26 |
| D | 85 | 15 | 8.31 | 9.26 |
The pertinent sample parameters are all given in Table 1. The samples were all measured in the same manner except for the post-annealing sample, A. Due to a failed lead, the measurement scheme after annealing was done with 83 m between the voltage leads instead of 41 m. In order to fairly compare the noise power before and after the annealing process, the length difference of the sample needed to be accounted for. As shown in Ref. FengPRL86 , the normalized noise power . In order to correct the post-annealing noise power, the post-annealing values were multiplied by 83/41. With the parameters in the table, typical two-segment lengths probed by the TDUCF and MFUCF measurements have resistances of around 2.5 k. In all samples the thermal length (, where is the diffusion constant) is much smaller than the inferred values.
Samples using the Ti adhesion layer were placed in the evacuated sample space of the cryostat within 2 hours of metal deposition. After finishing the measurements, the samples were allowed to anneal at room temperature in ambient lab conditions for at least a week. The measurements were then repeated. The pure Au samples to be treated with a SAM were allowed to anneal at room temperature for a minimum of a week before they were placed in the cryostat and measured. In this way the pure Au samples are allowed to anneal prior to any measurements. We have found that this initial annealing of pure Au samples alone slightly reduces the resistivity relative to the pre-annealing value, but induces no other changes; furthermore, subsequent annealing produces minimal changes even on the timescale of several days. Changes seen after self-assembly of the SAM are therefore due to the SAM, rather than simply letting the samples sit a little longer. The pure Au samples were then soaked in a 1 mM solution of dodecanethiol (CH3(CH2)11SH) in ethanol for 48 hours, and returned to the cryostat to repeat all measurements.
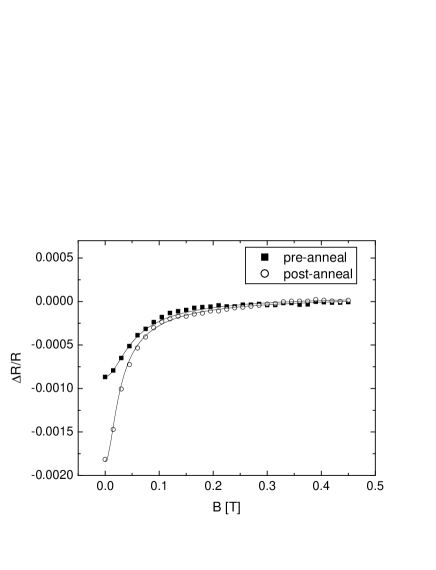
The WL magnetoresistance curves all showed strong antilocalization, consistent with the large spin-orbit scattering of Au. Two magnetoresistance curves are shown in Figure 1. The two curves are from sample A at 2 K before and after annealing. Magnetoresistance curves in the SAM treated samples all looked similar in size and shape to the post-annealed result of sample A.
Coherence lengths were inferred from the WL magnetoresistance usingPierrePRB03 :
| (1) | |||||
The value in this equation is defined as while is the spin-orbit scattering length, is the sample width, and . Both and are left as free parameters while fitting.
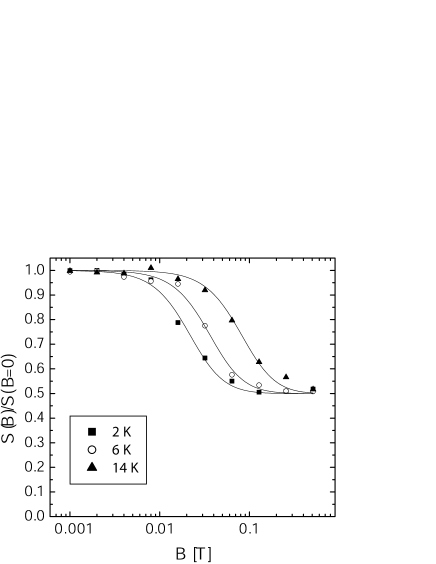
At each temperature the TDUCF are well described over the measured frequency range by a frequency dependence of the noise power. Examples of raw data for this in Sample A are shown below in Fig. 4. The coefficient of the dependence can be measured as a function of magnetic field at each temperature. Figure 2 shows the typical field dependence for Sample C. As expected from theoretical considerationsStonePRB89 , the noise drops by a factor of two over a field scale that depends on the coherence length, . The underlying physics is that the breaking of time-reversal symmetry by the external field suppresses the Cooperon contribution to the TDUCF, while the diffuson contribution is unaffected.
Whether the TDUCF are saturated or unsaturated (as discussed above, this depends on the detailed microscopic nature of the fluctuators) determines the functional form used to infer quantitatively from the data shown in Fig. 2. When assuming unsaturated TDUCF, we used an approximate crossover functionBeenakkerPRB88 of the form:
| (2) |
where
| (3) |
and
| (4) |
The function is the derivative with respect to the coherence time of the autocorrelation function of the magnetofingerprint, taken when the TDUCF are unsaturatedStonePRB89 . To infer from the saturated crossover function, is used instead of the derivative. Only was kept as a free parameter during fitting, with and used from the WL fits. Although the saturated and unsaturated fitting functions give very different coherence lengths when fit to TDUCF vs. B data, the graphical forms of the two functions are almost indistinguishable by eye. This makes it difficult to determine whether a system is saturated or unsaturated directly from TDUCF vs. B data.
The drive currents required to measure the TDUCF and its field dependence are unfortunately much larger than those needed to measure the WL magnetoresistance. Concerns about Joule heating and adequate thermal sinking of the electrons preclude extending the temperature range of the TDUCF measurements down to dilution refrigerator temperatures without some significant change in either sample preparation or measurement technique.
II Tunable magnetic impurity concentrations
Figure 3 shows coherence lengths inferred from both WL and TDUCF data in a sample with a Ti adhesion layer. The data collected before annealing show quite clearly that when unsaturated TDUCF are assumed. Pre-annealing, is much below the Nyquist length, consistent with spin-flip scattering (from the Ti layer) as the dominant dephasing mechanism at low temperatures. This is reinforced by the inset in Fig. 4, showing an upturn in noise power at high fields and low temperatures attributed to Zeeman splitting of the paramagnetic impurities. After annealing in air, is much increased, due to an apparent reduction in the paramagnetic impurity concentration in the sample. This is confirmed by the reduced size of the upturn in the inset of Fig. 4, post-annealing. As we have discussed elsewhereTrionfiAPL06 , the paramagnetic scattering sites are related to the oxygen stoichiometry of the underlying adhesion layer, which is generally TiOx, with .
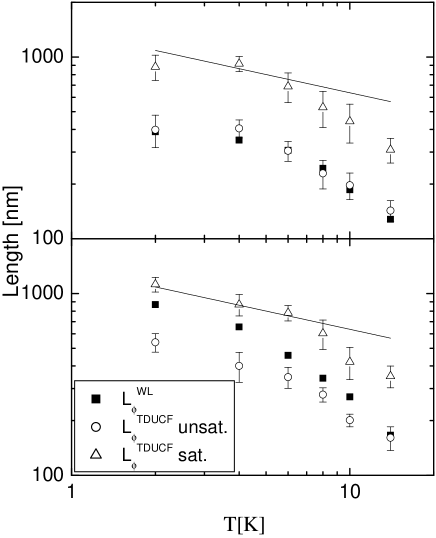
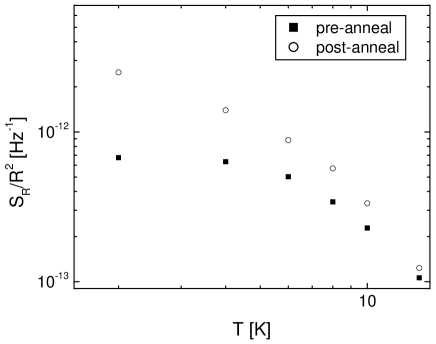
The temperature dependence of the magnitude of mirrors the data, as shown more clearly in Fig. 5. Note the saturation of noise power at low temperatures. This indicates that the coherence length is truly saturated (due to spin-flip scattering). It is important to note that the noise power vs. temperature can be a very subtle measurement. Due to the signal-to-noise challenges in measuring the resistance fluctuations, the noise power is measured with a different drive current at each temperature. Energy averaging affects associated with the drive current TrionfiPRB05 can suppress the magnitude of the noise without affecting the normalized field-dependence of the noise. This has also been demonstrated by Birge et al.HoadleyPRB99 . Because of this, comparing the magnitude of the noise power at different temperatures should be done with care, while the inferred coherence lengths (which depend instead on the magnetic field dependence) are much more robust. However, the qualitative picture is still useful. It should also be noted that drive currents were unchanged pre and post treatment (i.e. the noise power at 2 K was measured with the same drive current before and after annealing).
The ability to tune the spin-flip scattering rate systematically in a single sample through annealing allows us to see the effect of a varying . After annealing, and the unsaturated (inferred from the TDUCF field dependence) no longer agree below 14 K. Such a disagreement was reported previouslyHoadleyPRB99 ; TrionfiPRB05 in Ag, and we suggestedTrionfiPRB05 that this was due to a crossover from unsaturated to saturated TDUCF with decreasing temperature (and correspondingly increasing ). In Fig. 3, the likely explanation is that the true increased with annealing, pushing the TDUCF farther into the saturated regime and rendering invalid the values obtained from the unsaturated crossover function. The unlikely alternative is that the coherence physics without spin-flip scattering affects WL and TDUCF differently, but large spin-flip scattering washes out this difference.
The former interpretation is further supported by the data in Fig. 5, as well as that in Fig. 4 which shows the normalized resistance noise power, , measured at 2 K before and after annealing. The data have been normalized to account for a change in lead configuration after annealing. Clearly the post-annealing noise is much larger. This increase cannot be accounted for by changes in the resistivity (post-anneal resistivity is less than pre-annealing by roughly 10%) or .
There are only two possible explanations for this increase in noise. We could accept the unsaturated values of in Figure 3 both pre- and post-annealing (the unlikely scenario above), in which case the larger noise implies a factor of four increase in the TLS concentration in the sample upon annealing. This is unreasonable, particularly in light of the decreased resistivity after annealing attributed to increasing the grain size of the Au. The more likely possibility is that annealing may have lowered the TLS concentration while simultaneously increasing the true . The increased TDUCF amplitude then results from reduced ensemble averaging as decreases. Another observation that supports this idea is that the unsaturated in post-annealed samples becomes a closer match to as the temperature is increased. Much like the increased spin-flip scattering lowered the coherence length, as electron-phonon scattering begins to contribute to dephasing, the coherence length of the system becomes much smaller, which would lead to a sample further into the unsaturated TDUCF regime.
III Surface passivation
Having seen the results of systematically tuning , we consider the complementary experiment, leaving fixed and tuning the TLS density. We performed measurements on three pure Au samples (B, C, D), both before and after assembly of dodecanethiol. The idea behind this series of measurements is to use the self-assembled alkane chains to restrict the movement of atoms on the wire surfaces. If some of the TLS are due to these surface atoms, then one would expect this SAM to alter the TLS distribution accordingly.
It is important to be sure that the changes observed in these SAM experiments are truly due to the SAM, and not just the result of further annealing. In the case of Au on GaAs, annealing can cause both the grain size to increase as well as the Au to wet the GaAs causing width and thickness changes to Au wire. Therefore several precautions have been taken. First, prior to any measurement those samples have been allowed to anneal at room temperature for at least one week. This has been observed in the past to be a point beyond which further room temperature annealing has essentially no effect on the resistivity. Since the self-assembly process takes place over 48 hours, we have also compared with the effects of simply letting the samples sit for that period of time in methanol rather than a SAM solution. The effects shown below only happen as a result of SAM assembly, and are qualitatively and quantitatively consistent across the three samples. The WL measurements pre- and post-assembly also provide a means to check against size changes to the wire. At 2 K, the WL fits always indicated small () changes in the wire width upon annealing, with no systematic increase or decrease in size.
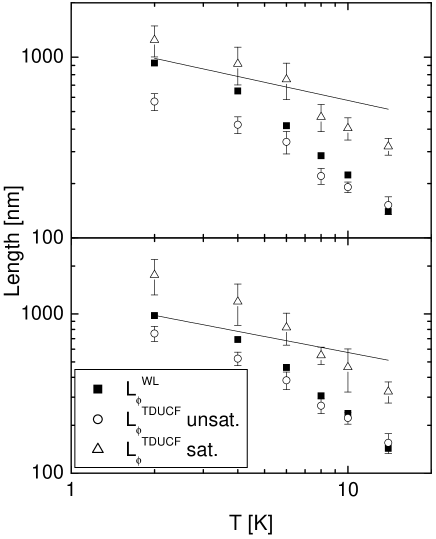
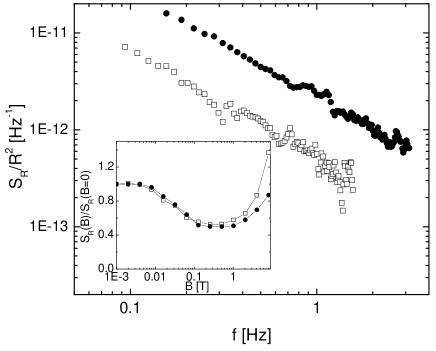
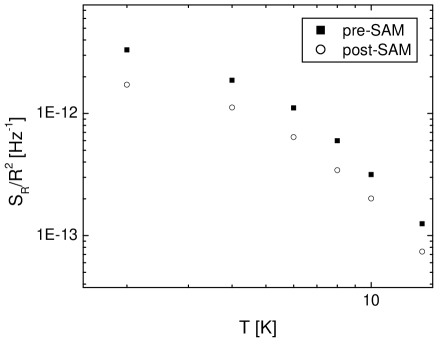
Table 1 shows that the self-assembly process has no particular systematic effect on resistivity. In two out of the three samples, actually increases upon formation of the SAM. Correcting for these slight changes in , Figure 6 shows data in one such sample; all three showed similar results. There was no change in due to SAM formation. The noise power remained over the whole bandwidth, and its measured magnitude decreased by a factor of over the whole temperature range, with little change in the form of the temperature dependence, as shown in Fig. 7 for the noise at zero field.
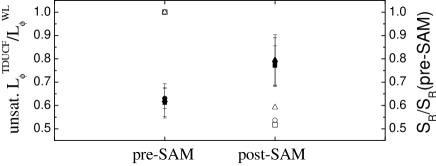
When the field dependence of the TDUCF is examined both before and after self-assembly, there is an apparent increase in unsaturated due to the SAM. That is, the field scale over which the noise power is reduced by a factor of two as in Fig. 2 becomes smaller. When the noise power vs. field is fit using the unsaturated functional form of Eqs. (2,3), the inferred increases. For example, the 2 K point shown in Fig. 6 goes from nm before self-assembly to nm after self-assembly. While the error bars are not insignificant, this change exceeds the error bar on the pre-SAM point by nearly a factor of three.
This systematic change is seen in all three samples when comparing pre- and post-SAM noise field dependence. Figure 8 shows the noise power at 2 K before and after dodecanethiol exposure for all three samples tested, as well as the ratio of the unsaturated to the at 2 K before and after the SAM assembly.
In order to accept the unsaturated data as correct (that is, as truly indicating an increase in coherence length while the noise magnitude itself is reduced), the SAM would need to simultaneously reduce the TLS concentration contributing to the TDUCF as well as reduce some mysterious scattering rate that affects WL and UCF differently. We believe that the more likely explanation is that as the SAM passivates TLS on the sample surface, the TDUCF move deeper into the unsaturated regime and the unsaturated crossover function becomes a better fit to the data.
The relatively large error bars on the coherence length ratios reflect the unsaturated fitting function’s systematic inability to thread all the data points in the curve. This inability can most likely be attributed to the fact that the unsaturated fitting function is not the correct functional form of the data being analyzed. For completeness, a similar comparison with the saturated resulted in the same qualitative situation of high precision in the data points with large error bars. A analysis indicates similar “goodness of fit” for both unsaturated and saturated functional forms of the field dependence.

For later comparison with the 2 K TDUCF data, we also measured MFUCF at 2 K on these same samples. Figure 9 shows a comparison of the MFUCF “magnetofingerprint” on sample B before and after SAM assembly. The WL magnetoresistance is eliminated by using the 5 terminal measurement scheme. Note the symmetry of the two curves about zero; this demonstrates that the apparent noise is indeed MFUCF. Reproducibility of each curve was checked to confirm that the fluctuations were actually a magnetofingerprint signature.
IV Discussion
We have seen in the two sets of experiments above that the coherence lengths inferred from the TDUCF field dependence assuming unsaturated TDUCF are very constraining. In the Ti adhesion layer case, the coherence lengths are initially relatively short due to magnetic scattering from the adhesion layer. In this limit and are in good agreement with no adjustable parameters, similar to the results of previous experiments on “dirty” samples with comparatively short coherence lengthsTrionfiPRB04 . Annealing in air reduces magnetic scattering, resulting in longer values of post-annealing. This is reflected by an increase in noise power magnitude, and a qualitative and quantitative change in the noise power temperature dependence, all consistent with an increased coherence length. However, the field scale of the noise power crossover is hardly changed. Assuming unsaturated TDUCF, one then finds that the inferred no longer agrees at all with , even though the material is now cleaner.
Similarly, SAM treatment reduces the TDUCF magnitude significantly, as shown in Fig. 7, and is unchanged after self-assembly, as is the temperature dependence of the noise power. However, there is a statistically significant increase in inferred from the noise field dependence when unsaturated TDUCF are assumed. Simultaneously increasing while decreasing noise magnitude is difficult to understand from ensemble averaging considerations.
If the assumption of unsaturated TDUCF is what leads to this difficult situation, it is important to check the validity of that assumption. The MFUCF data shown in Fig. 9 allow us to use the approach of Birge et al.BirgePRB90 to check the consistency of this assumption. Before SAM exposure, , and after SAM assembly, . Similarly, the variance in the MFUCF conductance at 2 K before the assembly . After assembly, . Clearly the amplitude of the MFUCF is essentially unaffected by the SAM, like .
Converting from the normalized 2 K noise power plotted in Fig. 7, . Similarly, . Assuming that the frequency dependence of the noise seen over our limited bandwidth extends to much higher frequencies, as is commonly done, one can estimate the necessary noise bandwidth if the TDUCF are saturated - that is, the bandwidth required for the TDUCF contribution to be the same magnitude as the MFUCF:
| (5) |
Plugging in, pre-SAM, . Post-SAM, . Since the physically reasonable bandwidth of two-level systems ends at frequencies comparable to the elastic scattering rate of the electrons ( Hz), it is unphysical to think about 161 or 296 frequency decades of TDUCF. Both of these are far in excess of the physically reasonable 20 decades suggestedBirgePRB90 as a rough criterion of saturated TDUCF. Therefore, in the conventional analysis, one would conclude that the measured TDUCF are unsaturated.
There are two clear possibilities: (a) The saturated/unsaturated explanation of the data is somehow in error, requiring TDUCF and WL in clean materials to be affected differently by common dephasing mechanisms. In other words the theory of these mesoscopic phenomena in clean materials is incomplete. (b) Some assumption of the consistency check is flawed. We think that this is the more likely possibility. We typically measure the TDUCF noise spectrum up to a few Hz. Although the spectrum is between 100 mHz and 6 Hz in these samples, and up to 100 Hz in other workBirgePRL89 ; BirgePRB90 ; HoadleyPRB99 , the consistency check assumes behavior to arbitrarily high frequencies.
A natural explanation for the failure of this consistency check would be extra TLS spectral weight above the extrapolated magnitude at higher frequencies. Could such excess noise be detected? Conservatively, suppose that the entire variance from the MFUCF is made up by TDUCF that are white with respect to frequency up to Hz. This would be a worst-case scenario for detectability. An estimated white noise from these excess fluctuations would then be . At a measuring current pushing the limits of self-heating, this would correspond to a voltage noise of . This is approximately nine orders of magnitude smaller than the Johnson noise from such a resistor at 2 K. Therefore, direct detection of the posited excess noise would be unfeasible unless the fluctuators limit the excess noise to a particular region of frequency space.
However, it is possible that this excess noise may be detectable at lower temperatures and through its effects on other sensitive degrees of freedom. The possibility that the TLS-induced noise power has a significant non- component at high frequencies has far-reaching implications to the quantum computing community. The internal noise sources, i.e. TLS, can be the dominant dephasing mechanism in a qubit when all other external mechanisms are filtered out GalperinPRL06 . A non- noise power spectrum due to the TLS found in normal metals could therefore result in an unexpected effect on the dephasing of qubits. Indeed, this may be the best way to probe for further signatures of such noise.
We have performed two sets of experiments that examine the relationship between and . In some samples we have systematically reduced spin-flip scattering, and find increased , increased TDUCF magnitude, and increased disagreement with extracted assuming unsaturated fluctuations. In other samples we have passivated surface fluctuators using a self-assembled monolayer, and find unchanged , decreased TDUCF magnitude, and better agreement with unsaturated . These results imply that apparent disagreement between and likely results from a crossover from unsaturated toward saturated fluctuations as .
On the one hand it is fortunate that such a crossover occurs in an accessible temperature range for these experiments. The currents required for the TDUCF measurements and the resulting Ohmic heating make it extremely difficult to extend these low frequency noise measurements to dilution refrigerator temperatures. On the other hand, the fact that deviations between and have been observed in this temperature range for almost fifteen yearsMcConvillePRB93 was already an indicator that interesting physics was taking place in the accessible regime. A simple comparison of integrated TDUCF and MFUCF magnitudes fails to indicate such a crossover, suggesting that the assumptions underlying that comparison are flawed. We suggest that the distribution of relaxation times for the TLS in Au may have extra weight in excess of expectations at frequencies higher than the measuring bandwidth of our experiments. This extra high frequency noise, should it exist, could have a strong impact on solid-state qubits, and should be a focus of further research in electronic phase coherence.
The authors thank N.O. Birge for his helpful advice concerning noise measurements, and I.L. Aleiner and A.D. Stone for discussions of the theory. This work was supported by the David and Lucille Packard Foundation and DOE Grant No. DE-FG03-01ER45946/A001.
References
- (1) Tunneling Systems in Amorphous and Crystalline Solids, edited by P. Esquinazi (Springer-Verlag, Berlin, 1998).
- (2) N. O. Birge, B. Golding, and W. H. Haemmerle, Phys. Rev. Lett. 62, 195 (1989).
- (3) D.C. Ralph, R.A. Buhrman, Phys. Rev. Lett. 69, 2118 (1992).
- (4) D.C. Ralph, A.W.W. Ludwig, J. von Delft, and R.A. Buhrman, Phys. Rev. Lett. 72, 1064 (1994).
- (5) A. Zawadowski, J. von Delft, and D.C. Ralph, Phys. Rev. Lett. 83, 2632 (1999).
- (6) Y. Imry, H. Fukuyama, and P. Schwab, Europhys. Lett. 47, 608 (1999).
- (7) V.V. Afonin, J. Bergli, Y.M. Galperin, V.L. Gurevich, and V.I. Kozub, Phys. Rev. B 66, 165326 (2002).
- (8) E. Paladino, L. Faoro, G. Falci, and R. Fazio, Phys. Rev. Lett. 88, 228304 (2002).
- (9) D.J. Van Harlingen, T.L. Robertson, B.L.T. Plourde, P.A. Reichardt, T. A. Crane, and J. Clarke, Phys. Rev. B 70, 064517 (2004).
- (10) L.-C. Ku and C.C. Yu, Phys. Rev. B 72, 024526 (2005).
- (11) A. Shnirman, G. Schön, I. Martin, and Y. Makhlin, Phys. Rev. Lett. 94, 127002 (2005).
- (12) Y.M. Galperin, B.L. Altshuler, J. Bergli, and D.V. Shantsev, Phys. Rev. Lett. 96, 097009 (2006).
- (13) G. Bergmann, Phys. Rep. 107, 1 (1984).
- (14) R. A. Webb, S. Washburn, C. P. Umbach, and R. B. Laibowitz, Phys. Rev. Lett. 54, 2696 (1985).
- (15) W. J. Skocpol, P. M. Mankiewich, R. E. Howard, L. D. Jackel, D. M. Tennant, and A. D. Stone, Phys. Rev. Lett. 56, 2865 (1986).
- (16) P. Debray, J.-L. Pichard, J. Vicente, and P.N. Tung, Phys. Rev. Lett. 63, 2264 (1989).
- (17) D. Mailly and M. Sanquer, J. Phys. I France 2, 357 (1992).
- (18) I. L. Aleiner and Ya. M. Blanter, Phys. Rev. B 65, 115317 (2002).
- (19) A. Trionfi, S. Lee, and D. Natelson, Phys. Rev. B 70, 041304(R) (2004).
- (20) D. Hoadley, P. McConville, and N. O. Birge, Phys. Rev. B 60, 5617 (1999).
- (21) A. Trionfi, S. Lee, and D. Natelson, Phys. Rev. B 72, 035407 (2005).
- (22) A. D. Stone, Phys. Rev. B 39, 10736 (1989).
- (23) N. O. Birge, B. Golding, W. H. Haemmerle, Phys. Rev. B 42, 2735 (1990).
- (24) S. Feng, in Mesoscopic Phenomena in Solids, edited by B. L. Altshuler, P. A. Lee, and R. A. Webb (Elsevier, New York, 1991), p. 114.
- (25) J.H. Scofield, Rev. Sci. Instr. 58, 985 (1987).
- (26) S. Feng, P. A. Lee, and A. D. Stone, Phys. Rev. Lett. 56, 1960 (1986).
- (27) F. Pierre, A. B. Gougam, A. Anthore, H. Pothier, D. Esteve, and N. O. Birge, Phys. Rev. B 68, 085413 (2003).
- (28) C. W. J. Beenakker and H. van Houten, Phys. Rev. B 37, R6544 (1988).
- (29) A. Trionfi, S. Lee, and D. Natelson, Appl. Phys. Lett. 89, 262104 (2006).
- (30) P. McConville and N. O. Birge, Phys. Rev. B 47, 16667 (1993).