Probing multiferroicity and spin-spin interactions via dielectric measurements on Y-doped HoMnO3 in high magnetic fields
Abstract
The magnetic field dependent phase diagram of the ferroelectric material has been investigated for x = 0, 0.6, and 0.8 for fields directed along both the ab in-plane and c-axis basal plane directions. Dielectric measurements are used to map out the re-entrant temperature-magnetic field phase transitions which involve in-plane Mn spin rotations in the antiferromagnetic state below the Nel temperature. We show through the alloy study that the Ho sublattice plays a major role in all transitions, and that the phase diagram for is dependent on magnetic field direction. We describe this behavior in terms of the interaction of the Ho sublattice spin system with the underlying, robust antiferromagnetic triangular lattice, where the Ho-Y spin interactions are highly sensitive to concentration and field direction.
pacs:
75.47.Lx,77.80.-e, 77.22.-d, 66.70.+f, 65.40.DeThe rare-earth hexagonal materials (R=Ho, Lu, Y) have attracted considerable recent attention due to the uncommon coexistence of coupled ferroelectric and antiferromagnetic orderings.fiebig1 Exemplary in the understanding of this family of compounds is ,which has a ferroelectric transition at K.bertaut This gives rise to a small distortion of the two dimensional networks of triangular (S=2) ions out of the basal plane. In principle, the Mn-Mn spin interactions are highly frustrated, but this lattice distortion relieves some of the frustration, and results in an antiferromagnetic ordering at 70 K with a 120 degree spin structure.huang Hence, the ferroelectric and magnetic order can coexist with a strong coupling between the two disparate phenomena.hill
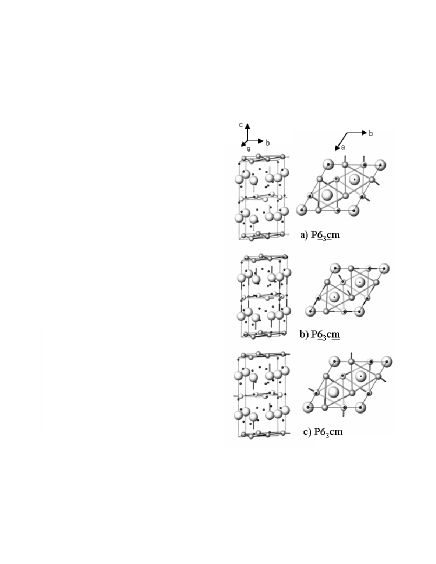
The compound , where the nonmagnetic ions have been replaced with , is a more complex system due to the addition interaction of spins.fiebig1 Although the ferroelectric temperature does not change significantly from , there are a series of lower temperature magnetic transitions.coeure The spins order antiferromagnetically at fiebig2 and in Fig. 1, a description of the spin configurations with decreasing temperature below is presented. Here there is a subsequent spin reorientation transition at 40 K(), which is accompanied by a small moment forming on the Ho site.vajk ; lorenz ; munoz ; lonkai ; fiebig3 The Ho spins themselves order completely at =5 K, where a second Mn spin reorientation occurs.lottermoser The complete magnetic structure is still a matter of debate, but recent measurements have shown that at , the Mn spins are in a 120 degree antiferromagnetic structure, at there is a 90 degree rotation of these spins accompanied by a partial ordering of the Ho spins along the c-direction, and at , there is a final reorientation of Mn spins in the basal plane, with a complete AF ordering of the Ho spins.fiebig1 ; vajk At temperatures at and below , recent measurements on flux grown single crystals have shown that additional phases appear as a function of magnetic field.fiebig4 ; yen
The coupling of the ferroelectric and magnetic order parameters to the lattice result in a high sensitivity of a number of different probes, including dielectric effects, to the mapping of the magnetic phases.lee ; cruz ; litvinlorentPRL ; katsufuji In the present work, we focus on dielectric measurements to explore the relative effects of Ho, Y, Mn, and Ga in the alloy series and . The emphasis is on the anisotropic high magnetic field properties of image furnace grown single crystals in the temperature range .
I EXPERIMENTAL
Single crystals of , (x=0; 0.6; 0.8) and (y=0.1) were grown by a traveling-solvent-floating zone (TSFZ) techniquehdzhou . Samples with typical dimensions were oriented, cut and polished for dielectric measurements with parallel plate silver electrodes normal to the c direction. A standard ac capacitance bridge method was employed where the rms electric field amplitude applied between plates in c direction was 50 V/cm, substantially less than the V/cm field used to stabilize the polarized Ho state.fiebig3 The real (capacitative - C) and loss (dissipative - D) signals were measured at 100 kHz vs. temperature in both low field superconducting and high field resistive magnets at the National High Magnetic Field Laboratory. In all cases presented here the ac electrical field was parallel to the axis. The magnetic field anisotropy was measured simultaneously for two samples of each Y concentration, cut from the same crystal to compare directly anisotropic effects of magnetic field in ab plane and direction. To avoid strong torque effects, care was taken to affix the samples to avoid movement in high magnetic fields.
II RESULTS
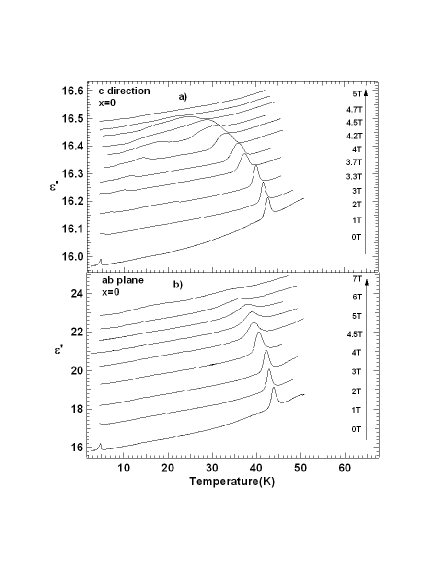
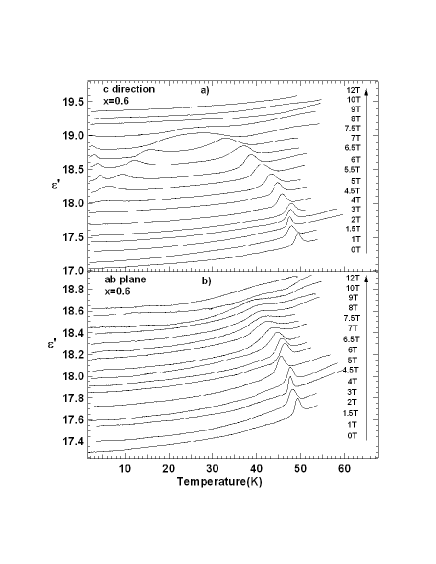
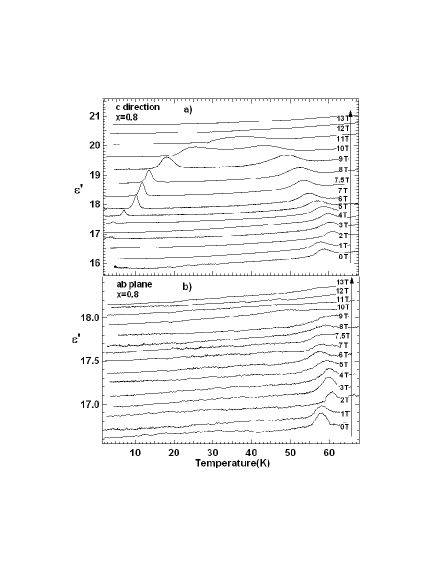
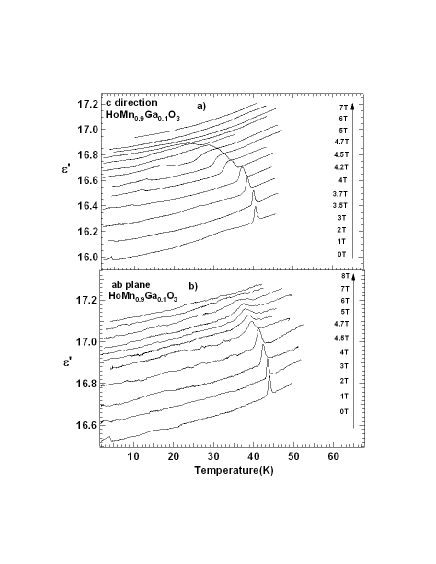
The transitions where Mn spin rotations occur can be observed by a number of different methods, including magnetization, ac magnetic susceptibility and specific heatlorenz , neutron scatteringlonkai ; vajk , lattice constantyen , thermal conductivitysharma and due to the ferroelectric and magnetic coupling, dielectric measurementsyen ; litvinlorentPRL . Dielectric studies, the focus of the present work, are particularly useful for the mapping of the temperature dependent magnetic phases. Our results for the two field orientations, B//c and B//ab are shown in Figs. 2 - 4 for and in Fig. 5 for . All data show the signature (peak in the dielectric constant) and field dependence of the higher temperature transition, and the lower temperature transition is also evident in some cases. (Our data do not extend to lower temperatures where additional phasesfiebig4 ; yen are observed.) Our measured value of dielectric constant for all samples was approximately 16, in agreement with other studiesyen ; cruz ; litvinlorentPRL .
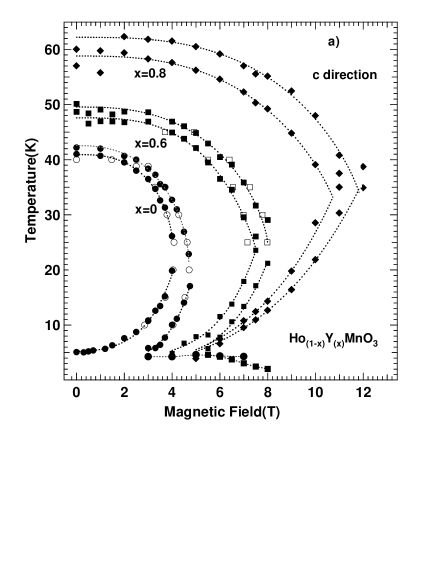
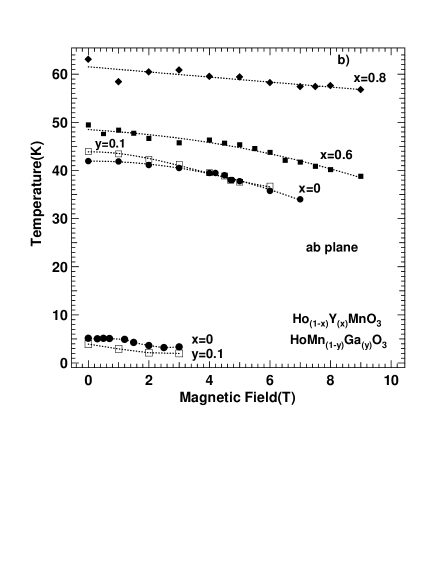
In Fig. 6 (for B//c) and Fig. 7 (for B//ab) we summarize the field and temperature dependent dielectric peak signatures observed for all samples and field directions. The most prominent features are the and phase boundaries. We focus first on the (i.e. x = 0) phase diagram in Fig. 6, where the full width-half maxima of the dielectric peaks have been used to determine the widths of the transitions. The data show overall agreement with previous determinations of the B//c “re-entrant” phase diagramlitvinlorentPRL . In the Fig. 7, referring first to the x= 0 data phase diagram for the B//ab-plane data, we find that the slope /d(B//ab) is significantly less, that persists to significantly higher fields, and that the re-entrant character of the phase diagram is nearly gone.(In Fig. 7 only the peak values for and are plotted)
Turning next to the doping study, we find that for B//c (Fig. 6) increases with increasing Y concentration, and that in general the re-entrant phase boundaries expand in both their range of temperature and field. For B//ab, /d(B//ab) decreases with increasing Y concentration, and for x = 0.6 and 0.8, the lower transition normally attributed to vanishes, and the re-entrant phase boundary is gone. For which represents a small non-magnetic substitution of Ga on the Mn site, we found that Ga (y=0.1) increases and decreases ( Fig. 7) expanding phase region.
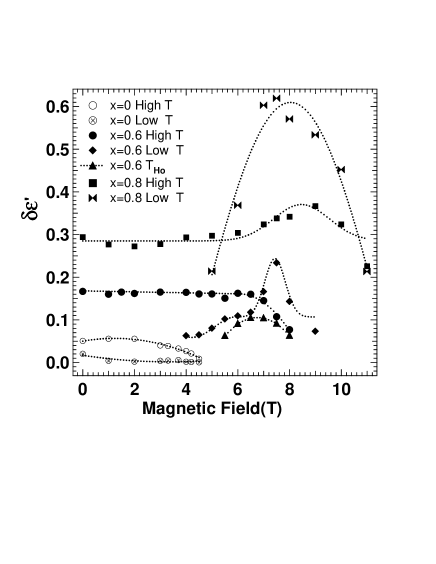
There are some other aspects of the data that are noteworthy. The widths of the peaks in the phase diagram have been interpreted as representing an intermediate “INT” phase by Lorenz et al. lorenz . Not only the widths, but the amplitudes of the peaks in the dielectric response at the transitions exhibit a significant dependence on temperature, field, and Y concentration. In Fig. 8 we summarize the behavior of the the peak heights vs. their loci in magnetic field and temperature for the different alloy samples. Most notably, the peak heights are generally non-monotonic with field and temperature, and show pronounced maxima for the more concentrated Y samples. The field/temperature dependence of the transition widths (not plotted, but evident by examination of the T-B widths of the re-entrant phase boundaries in Fig. 6), also show a dependence on Y concentration, temperature, and magnetic field.
III DISCUSSION:
The main results of the present work are that: (1) Holmium plays a major role in all aspects of the low temperature-magnetic phase diagram of ; (2) in-plane magnetic field greatly affects the influence of Holmium on the spin rotation transitions; (3) and, for increasing Y concentration in , the transition approaches and the phase region, which is the same symmetry that is observed in pure below fiebig3 , expands in both temperature and magnetic field range. Our results, as represented in Figs. 7 and 8, show that for either/or in-plane magnetic field and reduced Ho concentration, the lower temperature re-entrant phase boundary is removed. Only in the case for x = 0 is evident for B//ab. Below we discuss the behavior of the dielectric constant at , and the significance of the alloy and field direction studies in turn.
III.1 Dielectric response at
The origin of the spin rotation is due to the presence of the Ho spin sublattice, where the tendency of the Ho to form magnetic order is accompanied by in-plane adjustments of the original native cm symmetry of the pure triangular lattice AFM order below . The dielectric measurements show an increase in dielectric constant as the re-entrant phase boundaries are crossed between the and cm symmetries. Following the arguments of Lorenz et al. lorenz it is expected that a lower symmetry Mn spin configuration is present as the spins rotate from one configuration to the other. This intermediate state causes the dielectric constant to increase; indicating additional spin-lattice strain effects are present during the transition. However, the dielectric constant is nearly the same in either of the adjacent and cm phases. Although theoretical progress has been made in describing the electric polarization susceptibility change at due to coupling between AFM and ferroelectric orderingzhong , a similar description for the transition has not yet been treated. It is reasonable to expect, however, that the change in the dielectric constant is mainly coupled to the term in the magnetoelectric coupling Hamiltoniankatsufuji . Here and are the Mn spins on nearest neighbor sites, and hence for any rotation away from either of the two ground state spin orientations, the free energy will increase. The transition across the boundary therefore is similar to a two level system with an energy barrier associated with the intermediate state. The field and temperature dependence of the peaks in the dielectric constant shown in Fig. 8 should provide guidance for future theoretical work to describe the behavior of the dielectric signal as the boundaries are crossed.
III.2 Significance of the doping studies
As discussed above, the increase in Y (decrease in Ho) concentration increases the region of the phase which is also the symmetry of pure below . By reducing the Ho concentration, it also takes higher B//c magnetic fields to induce the P phase. Given the nature of the sublattice spin structure, it is not clear how reducing the Ho concentration increases the magnetic field at which the sublattice magnetic order returns the cm configuration. At x=0.8, the maximum field required to suppress ordering is approximately 10 T, compared to the x=0 case where the maximum field is about 4 T. This may be understood with the observation that it is the Ho moments, partially oriented along the c-direction, which cause the spin reorientation transition. The addition of a magnetic field would presumably order the remaining Ho moments, and with this internal field induce a transition within the Mn layer to a paramagnetic state(through the introduction of spin-flip transitions out of the basal plane). Reducing the Ho spin concentration would reduce this internal field, and thus the magnetic phase survives to higher applied fields. Recent neutron scattering results have shown that the anisotropy of the spin wave spectrum at low temperatures increases greatly due to the presence of ordered Holmium, and drives the spin reorientation transition.vajk Ga (y=0.1) doping reduces antiferromagnetic ordering of Mn sublattice and the consequences are the increase of and the decrease of . The slight decrease in Ho ordering temperature is one more indication of mutual Ho-Mn interactions that drive the spin reorientation and the rare earth ordering.
The rare earth ordering (i.e. ) is also suppressed with decreasing Ho concentration, and this seems natural since the rare earth nearest neighbor interactions will be reduced. Due to the limit of our investigation, we did not explore the complicated low-T phase diagram for reported by other research groups.fiebig4 ; lorenz We note that our spin reorientation temperature for is higher than those reported in these previous studies ( = 42 K vs. 33 K),where crystals were flux grown. In the present case we used single crystals, grown by the floating zone method, and this may account for the higher values. We do however confirm the phase line near 5 K due to the rare earth Ho ordering, and also the apparent widening of the ”INT” region at low temperatures. This is within a region of phase space where neutron experiments see a continuous change in magnetic Bragg peak intensity(ie. as the spins change orientation from one orientation to the next).fiebig1 ; vajk The hysteresis noted for below 5 K in fields between 0.5 T and 2 T could be due to domain effects rather than true magnetic transitions.
III.3 Significance of the magnetic field direction
The Mn spins within the ab plane are severely frustrated, large fields are needed to decouple them. Hence it is unlikely that in the range of magnetic field studied here the Mn spins were re-aligned solely due to the external field. Rather, it is most likely the magnetic field interaction with the Ho spin system, which is further coupled to the Mn spins, which drives the transitions. Since the Ho magnetic sublattice spin orientations are along the c-axis, a magnetic field applied in the ab plane will involve various types of antiferromagnetic polarization effects (spin flop, spin flip). Whereas for B//c the re-entrant phases are still present, it is evident from Fig. 7 that for B//ab, the re-entrance of the cm phase at temperatures below the first transition is completely suppressed. Hence for B//ab, the interaction of the magnetic field with the Ho system must be considerably stronger. In Fig. 7 the phase line for x = 0 near 5 K is , which is suppressed for increasing field, and above 3 T, there is no discernable transition at . This gives a rough estimate of the interactions between the Ho moments,which suggests an energy scale of about 1.8 meV (using J=8). This is remarkably close to the first crystal field level of Ho as determined by neutron scattering(1.5(1) meV), providing a mechanism for inducing spin flip transitions for the Ising-like Ho moments.vajk
IV SUMMARY AND CONCLUSIONS:
We have shown that by modifying the influence of the Ho sublattice by either non-magnetic substitution for Ho, or with in-plane magnetic fields, the mechanism that favors the Pcm state is suppressed and the characteristic of the pure system emerges. To fully understand these effects, a microscopic model is needed which includes a description of how the magnetic field (applied in different directions) affects the correlated Ho and Mn spin sublattices. Further experimental work to characterize the nature of the spin systems vs. magnetic field direction and alloy control, particularly neutron scattering and second harmonic generation studies, would be very useful to better understand these complex interacting spin systems.
Acknowledgements.
This research was sponsored by the National Nuclear Security Administration under the Stewardship Science Academic Alliances program through DOE Research Grant # DE-FG03-03NA00066 (EJ), NSF Grant #’s DMR0203532 and DMR0602859 (JSB), and the NHMFL is supported by contractual agreement between the National Science Foundation through NSF Grant # DMR0449569 and the State of Florida.References
- (1) See for example M. Fiebig, T. Lottermoser, D. Frohlich, A. V. Goitsev, and R. V. Pisarev, Nature 419, 818 (2002).
- (2) F. Bertaut, P. Fang, and P. Forrat, Comptes Rendus Hebdomadaires Des Seances de L’Academie des Sciences 256, 1958 (1963).
- (3) Z. J. Huang, Y. Cao, Y. Y. Sun, Y. Y. Xue, and C. W. Chu, Phys. Rev. B. 56, 2623 (1997).
- (4) N. A. Hill, J. Phys. Chem. B 104, 6694 (2000).
- (5) P. Coeur , P. Guinet, J. C. Peuzin, G. Buisson, and E. F. Bertaut, Proceedings of the International Meeting on Ferroelectricity, edited by V. Dvor k, A. Fouskov , and P. Glogar (Institue of Physics of the Czechoslovak Academy of Science, Prague 1966) Vol. 1, pp. 332-340.
- (6) M. Fiebig, Th. Lottermoser, and R. V. Pisarev, J. Appl. Phys. 93, 8194 (2003).
- (7) O. P. Vajk, M. Kenzelmann, J. W. Lynn, S. B. Kim, S. W. Cheong, Phys. Rev. Lett. 94, 087601 (2005).
- (8) B. Lorenz, F. Yen, M. M. Gospodinov, and C. W. Chu, Phys. Rev. B. 71, 014438 (2005).
- (9) A. Mu oz, J. A. Alonso, M. J. Mart nez-Lope, M. T. Cas is, J. L. Mart nez, and M. T. Fern ndez-D az, Chem. Mater. 13, 1497 (2001).
- (10) Th. Lonkai, D. Hohlwein, J. Ihringer, and W. Prandl, Appl. Phys. A: Mater. Sci. Process. 74, 843 (2002).
- (11) M. Fiebig, D. Fröhlich, K. Kohn, St. Leute, Th. Lottermoser, V. V. Pavlov, and R. V. Pisarev, Phys. Rev. Lett. 84, 5620 (2000).
- (12) Th. Lottermoser, Th. Lonkai, U. Amann, D. Hohlwein, J. Ihringer, and M. Fiebig, Nature 430, 541 (2004).
- (13) M. Fiebig, C. Degenhardt, and R. V. Pisarev, J. Appl. Phys. 91, 8867 (2002)
- (14) F. Yen, C. R. dela Cruz, B. Lorenz, Y. Y. Sun, Y. Q. Wang, M. M. Gospodinov, and C. W. Chu, Phys. Rev. B, 71, 180407(R) (2005).
- (15) Seongsu Lee, A. Pirogov, Jung Hoon Han, J. -G. Park, A. Hoshikawa, and T. Kamiyama, Phys. Rev. B, 71, 180413(R) (2005).
- (16) C. R. dela Cruz, F. Yen, B. Lorenz, Y. Q. Wang, Y. Y. Sun, M. M. Gospodinov, and C. W. Chu, Phys. Rev. B, 71, 060407(R) (2005).
- (17) B. Lorenz, A. P. Litvinchuk, M. M. Gospodinov, C. W. Chu, Phys. Rev. Lett. 92, 087204 (2004).
- (18) T. Katsufuji, S. Mori, M. Masaki, Y. Moritomo, N. Yamamoto, H. Takagi, Phys. Rev. B 64, 104419 (2001).
- (19) H. D. Zhou, J. C. Denyszyn, J. B. Goodenough, Phys. Rev. B 72, 224401 (2005)
- (20) P. A. Sharma, J. S. Ahn, N. Hur, S. Park, Sung Baek Kim, Seongsu Lee, J.-G. Park, S. Guha, and S-W. Cheong, Phys. Rev. Lett. 93, 177202 (2004)
- (21) C. G. Zhong and Q. Jiang, J. Phys. Condens. Matter 14, 8605(2002)