Coincidence detection of inharmonic pulses in a nonlinear crystal
Abstract
Two trains of light pulses at periods that are equally shifted from the harmonics of a missing fundamental, are combined in a nonlinear crystal. As a result of a noncollinear phase matched second order nonlinear generation, a new train of pulses is obtained. When the temporal width of the input pulses is large, the frequency of the resulting pulse train follows the observations from classical experiments on the perception of virtual pitch by the brain. On the other hand, when the width of the input pulses is small, the generated pulse train exhibits much lower frequencies, analogous to those observed in the motor neural system. Our experimental set up allows us to explore, systematically and continuously, the transition between these two regimes, while at the same time demonstrate that coincidence detection in quadratic nonlinear systems has functionalities similar to those observed in the nervous system.
One of the most remarkable features of nonlinear systems is their ability to process complex input signals. A classical example is the perception of virtual pitch by the brain. In that context, it is well known helmholtz85 that a missing fundamental tone can be perceived upon exposure to only some of its harmonics. Psycophysical experiments by Schouten et al. schouten62 showed that when a set of consecutive harmonics were equally shifted in frequency, it was not the frequency difference (i.e. the original fundamental) that was perceived. Instead, the perceived pitch varied linearly with the frequency shift. Specifically, in the presence of input tones of frequencies
| (1) |
where is the missing fundamental frequency, is an integer and is the frequency detuning which makes the input frequencies to be inharmonic. Under these conditions, the perceived pitch was seen to be given by a frequency that matches the following expression:
| (2) |
Recently, Chialvo et al. chialvo02 proposed a simple and elegant mechanism that accounts for this response, involving a linear superposition of the input harmonics and a nonlinear noisy detection of the frequency (2) via a threshold. The mechanism, subsequently named ghost resonance, has been experimentally verified in lasers buldu03 ; buldu05 ; sande05 and in electronic circuits calvo05 .
Experimental results using magnetoencephalographic measurements pantev96 showed that the missing fundamental illusion also arises when the harmonic inputs are presented binaurally, i.e. different harmonics are applied to the each of the two ears. The mechanism of Chialvo et al. chialvo02 was extended to that situation by modeling separate neuronal pathways that detected two different input harmonics balenzuela05 . That study showed that in the context of distributed inputs, the mechanism of ghost resonance heavily relies of the coincidence detection of synaptic pulse trains (transduced by the input neurons that receive the input harmonic signals) by an integrating neuron. An experimental realization of this effect in a real neurophysiological setup has been recently performed manjarrez06 . That experiment has shown that when the input trains are inharmonic (i.e. frequency shifted with respect to the original harmonics), the processing neuronal pool responds at frequencies much lower that those expected from expression (2). Subsequent experiments with nonlinear electronic circuits lopera06 indicate that the difference in the response is due to the small width of the pulses acting upon the integrating neuron, in contrast with the larger width presumably associated with acoustic neuronal pathways.
In this paper, we use an utterly different experimental setup to address the question of the influence of the input pulse width on the ghost resonance response. This allows us to: (i) perform systematic measurements for continuously varying pulse widths, with high controllability and reproducibility, (ii) ascertain the generality of the phenomenon reported, which is seen to arise in any system that operates via coincidence detection upon thresholding, and (iii) suggest a possible functional role of this phenomenon in nonlinear photonic devices, with potential applications in all-optical signal processing.
The experimental setup is shown in Fig. 1. A 76 MHz train of 130 fs pulses, produced by a Ti-sapphire laser at a wavelength of 800 nm, was divided in two beams using a 50/50 beamsplitter. These two beams are recombined in a BBO crystal cut for noncollinear phase matching, which generates second-harmonic light at a wavelength of 400 nm when both beams are present simultaneously in the crystal. The coincidence of the short laser pulses is obtained using a movable translation stage, as shown in Fig. 1. Both beams are chopped using electro-mechanical shutters S1 and S2 at frequencies and , respectively. The computerized chopping mechanism allows to control the shutter frequencies and ensures a constant (stable) phase relation between them.
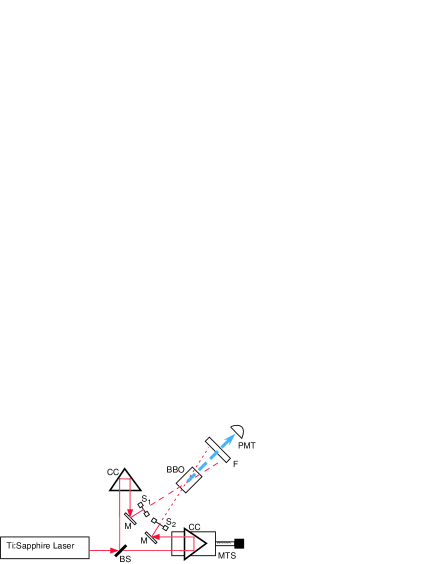
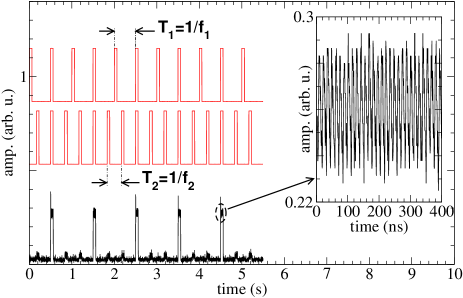
The input signals consist on two pulse trains of dynamical frequencies and , represented by the two upper thin traces in Fig. 2. In fact each pulse is, in turn, composed by a package of ultrashort pulses with a repetition rate of MHz and and optical frequency Hz, as explained above (see inset of Fig. 2). The width and dynamical frequency of each package are controlled by the optical shutters. In what follows we will refer to these packages as pulses, since the fast dynamics within the package is not relevant for the purpose of our experiment.
When two input pulses coincide inside the nonlinear crystal (see Fig. 2), a train of second-harmonic pulses at an optical frequency is generated by the crystal, and detected by the photomultiplier (lower pulse train in Fig. 2). Therefore, the nonlinear crystal acts as a coincidence detector, and replaces the threshold of detection of previous systems where ghost resonance has been studied chialvo02 ; calvo05 ; balenzuela05 ; lopera06 . In the particular case of Fig. 2, we have set Hz and Hz, which corresponds to , , Hz and in Eqs. (1)-(2). Given the thresholdless nature of the quadratic nonlinear interaction, in this particular case a pulse train at the ghost frequency ( Hz [see Eq. (2)]) is always generated and its detection is only limited by the sensibility of the overall detection system.
In order to investigate the response of the crystal to inharmonic inputs and check the validity of Eq. (2), we set the input frequencies to and , varying between 0 and 1 Hz. Since we are concerned about the influence of the pulse width on the pulse coincidence, we start by setting the pulse width to a relatively large value, namely ms. Figure 3(a) shows the instantaneous response frequency (defined as the inverse of the time interval between output pulses) as a function of slowest input frequency . The response frequency is seen to follow well the relation predicted by Eq. (2) for and (dashed lines in the figure) for almost the whole range of .

Lines of different are observed because the input frequency can represent different harmonics of the fundamental frequency , by changing the value of .
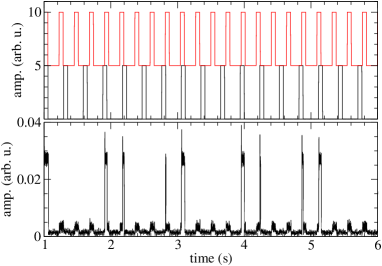
A linear response at large frequencies is also observed, however, in plot 3(a). This high frequency response is a direct consequence of consecutive coincidences of these broad pulses, as can be seen from Fig. 4. The resulting frequency is the inverse of the silent period of the slower input signal (), as can be deduced from this figure, and therefore, for this case, the response frequency should follow the curve
| (3) |
This expression is represented by the upper thin solid line in Fig. 3(a), and exhibits good agreement with the experimental results.
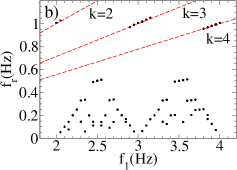
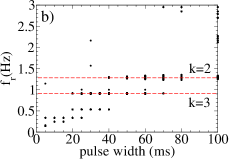
We now turn our attention to the opposite limit of very narrow pulses. To that end we apply pulses of width ms (the narrowest we can get given the speed limitations of the shutters). Figure 3(b) shows the instantaneous response frequency , again as a function of slowest input frequency, . We can see that the relation given by Eq. (2) holds only in the neighborhood of the harmonic case ( Hz and Hz, Hz). On the other hand, in most of the inharmonic region, the system responds with pulse trains of very low frequencies, in agreement with previous experimental results in electronic circuits lopera06 and the motor neural system manjarrez06 . These responses are grouped in families of lines following , with being an integer. The one with slope was observed experimentally in Ref. lopera06 and its origin was determined analytically. The closer we are to the limit of zero-width pulses, the more lines appear. These lines arise from the condition of coincidence,
| (4) |
where , are integers and the and are the input periods, respectively, and . When the condition given by Eq. (4) is fulfilled, both input trains coincide and a pulse is detected. When potential coincidences at frequency are themselves missed, lower frequencies are generated. This gives rise to different families of lines [quasi-pyramids in Fig. 3-(b)], depending on the value of that relates and .
The two situations depicted in plots (a) and (b) of Fig. 3 represent two opposite limits of the coincidence detection mechanism and show that, in absence of a noisy threshold detection, the region of validity of Eq. (2) increases with the pulse width. In order to systematically investigate the transition between them, we now fix the frequency shift and vary continuously the pulse width. The corresponding result, for two different values of , is shown in Fig. 5. For Hz, i.e. Hz and Hz (plot a), the line appears only for pulse widths larger than ms, and coexist with slow frequency responses, which increase when the pulse width increases lopera06 . The line corresponding to the case does not appear for this detuning.

For Hz, corresponding to Hz and Hz (plot b), the response at appears at pulse widths larger than ms, and the one at for widths larger than ms. For broad enough pulses, the system responds at even higher frequencies.
If we focus in the inharmonic region (when ), the previous results clearly show the transition from a low-frequency response regime to another regime completely dominated by relation (2), as the width of the pulses increases. Such a transition between regimes could underlie the differences observed between previous psychophysical experiments on auditory response schouten62 and recent experiments on the motor neural system manjarrez06 . In the former, expression (2) held unambiguously; in the latter, on the other hand, that behavior gave way very frequently to low frequency responses. Correspondingly, synaptic pulses are known to be wider in the auditory system than in the motor reflex system. From a technological viewpoint, the present results also show that nonlinear optical crystals carry out nontrivial signal processing tasks that mimic those of more complicated systems such as the brain.
Acknowledgements.
We thank Claudio Mirasso and Elías Manjárrez for fruitful discussions. Financial support was provided by MCyT-FEDER (Spain, projects BFM2003-07850, TEC2005-07799 and MAT2005-06354), by the EC-funded project PHOREMOST (FP6/2003/IST/2511616), and by the Generalitat de Catalunya.References
- (1) H. von Helmholtz, “On the sensations of tone as a physiological basis for the theory of music”, trans. A.J. Ellis (Kessinger Publ., 2005, orig. ed. 1885).
- (2) J.F. Schouten, R.J. Ritsma, and B.L. Cardozo, J. Acoust. Soc. Am. 34, 1418–1424 (1962).
- (3) D.R. Chialvo, O. Calvo, D.L. Gonzalez, O. Piro and G.V. Savino, Phys. Rev. E 65, 050902(R) (2002).
- (4) J. M. Buldú, D.R. Chialvo, C.R. Mirasso, M.C. Torrent and J. García-Ojalvo, Europhys. Lett. 64, 178 (2003).
- (5) J. M. Buldú, C.M. Gonzalez, J. Trull, J. García-Ojalvo and M.C. Torrent, Chaos 15, 013103 (2005).
- (6) G. Van der Sande, G. Verschaffelt, J. Danckaert, and C. R. Mirasso, Phys. Rev. E 72, 016113 (2005).
- (7) O. Calvo and D. R. Chialvo, Int. J. Bif. Chaos, to appear (2005).
- (8) C. Pantev, T. Elbert, B. Ross, C. Eulitz, and E. Terhardt, Hearing Res. 100, 164 (1996).
- (9) P. Balenzuela and J. García-Ojalvo, Chaos 15, 023903 (2005).
- (10) E. Manjárrez, P. Balenzuela, J. García-Ojalvo, L. Martínez, A. Flores, and C. R. Mirasso, “Phantom reflexes: Muscle contractions at a frequency not physically present in the input stimuli”, to be published (2006).
- (11) A. Lopera, J. M. Buldú, C. Torrent, D. R. Chialvo, and J. García-Ojalvo, Phys. Rev. E 73, 021101 (2006).