Magnetic field-induced transition in BaVS3
Abstract
The metal-insulator transition (MIT) of BaVS3 is suppressed under pressure and above the critical pressure of the metallic phase is stabilized. We present the results of detailed magnetoresistivity measurements carried out at pressures near the critical value, in magnetic fields up to T. We found that slightly below the critical pressure the structural tetramerization – which drives the MIT – is combined with the onset of magnetic correlations. If the zero-field transition temperature is suppressed to a sufficiently low value (15K), the system can be driven into the metallic state by application of magnetic field. The main effect is not the reduction of with increasing , but rather the broadening of the transition due to the applied magnetic field. We tentatively ascribe this phenomenon to the influence on the magnetic structure coupled to the bond-order of the tetramers.
pacs:
71.30.+h,71.27.+a,72.80.GaThe nature of the metal-insulator transition (MIT) of BaVS3 has presented riddles ever since its discovery a quarter of a century ago.Massenet ; neven The ambient pressure MIT is spectacular in the susceptibility cusp,Massenet ; neven ; graf ; mihaly but it is also manifested in specific heat,shiga thermal expansion,graf resistivityMassenet ; neven ; graf ; mihaly and optical reflectivitykezsmarki05 ; kezsmarki06 anomalies. The measurement of transport properties under pressureneven ; graf ; forro ; kezsmarki revealed that the insulating phase is bounded by a line of MITs in the – plane. The transition temperature drops to zero at the critical pressure and the high-pressure phase is metallic down to the lowest accessible temperatures.forro
The order of the MI phase transition was debated, and the options of weakly first order, second order, and supercritical transition have all been put forward. However, resistivityforro and in particular magnetoresistivitykezsmarki measurements under pressure led us to favor a second order transition. The character of the transition remains unchanged under pressures up to GPa as it always corresponds to a sharp spike in the logarithmic derivative of the resistivity, . This suggests a line of second order MITs. One purpose of the present study to find out whether the same phase boundary is preserved above GPa extending up to the critical pressure.
A critical line is possible only if it separates phases of different symmetry, so the MIT in BaVS3 must be at the same time an ordering transition breaking some global symmetry.pb02 However, the ambient-pressure MIT at 69K is not accompanied by the appearance of detectable magnetic moments, and the first two decades of search failed to reveal a symmetry-changing distortion at .footnote Finally, in 2002 Inami et al. reported the doubling of the unit cell along the trigonal -axis.inami Since the unit cell of the structure contains two V atoms along the -axis,structure the unit cell must contain four, hence the symmetry breaking change corresponds to tetramerization. More recent X-ray scattering measurements reconfirmed the existence of four inequivalent V sites at low temperatures.fagot2003 ; fagot2005 ; fagot2006 The X-ray measurements were extended to 5K, well below the third and lowest transition temperature K of BaVS3. The mysterious -transition leads to a low- phase with incommensurate magnetic long range order,magn_str and possibly orbital order,naka97 but the symmetry of the lattice is held at .fagot2003 ; fagot2005 ; fagot2006
The pressure range , where drops below K, had not been studied in detail. It is expected that novel behavior may arise if the structural transition and the magnetic transition eventually meet, or even only get near. As was found to be pressure independent in the pressure range investigated (),private the and lines may merge, which could change the nature of the MIT.
Another consideration is that even the well-studied low-pressure MIT has a dual nature: it is the boundary of a phase with spontaneous symmetry breaking (tetramerization), and at the same time a metal–insulator phase boundary. Since the MIT coincides with a symmetry breaking transition, the phase boundary may in principle be continued to a zero-temperature quantum critical point. On the other hand general arguments suggest that a metal–insulator transition is likely to become first-order before the predicted gap could become too small.mott Furthermore, it has been pointed out that the quantum critical behavior of an MIT may be quite unlike the quantum criticality of a mere symmetry breaking transition.imada05 BaVS3 has both aspects, thus it presents a situation of general interest but little firm knowledge.
In this paper we investigate if there is a change in the nature of the MIT at pressures close to the critical value. In order to get detailed information about the range where is suppressed to zero, we carried out magnetoresistance measurements at pressures where the characteristic energy of the applied field is comparable to that of the transition temperature. Results related to the MIT are presented here, while studies about the high-pressure metallic phase will be reported in a companion paper.nevennfl
Single crystals of BaVS3 were grown by Tellurium flux method. The crystals, obtained from the flux by sublimation, have typical dimensions of mm3. The sample was inserted into a self-clamping cell with kerosene as a pressure medium. The pressure was monitored in-situ by an InSb sensor. The pressure was stable within 0.05 kbar in the pressure and temperature ranges investigated in this work. The resistivity of the single crystal was measured in a standard four probe arrangement. The current was kept low enough to avoid the self-heating of the sample. Magnetic fields up to 12 T were applied perpendicular to the current, flowing along the crystallographic direction.
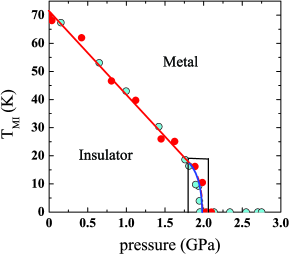
The zero-field pressure dependence of the metal–insulator phase boundary is shown in Fig. 1. The boundary consists of two distinguishable parts: decreases with almost perfectly linearly to about GPa where the insulator becomes much softer, and the boundary begins to drop steeply towards zero, signifying a new regime of the MIT. The almost vertical drop of the curve makes it difficult to map this region in detail. The points in the boxed range of Fig. 1 represent the data obtained by attempting to fine-tune the pressure up to . Even at GPa where is as low as to 7.5 K, the usual characterization of the transition by or magnetoresistivity curves yielded no striking difference from the behavior seen up to 1.5GPa.kezsmarki By these criteria, the transition at GPa is still second-order. However, the considerable smearing out of the phase transition by magnetic field – in addition to the downturn of the phase boundary – indicates that the character of the MIT changes in the parameter range GPa, K (this domain is not sharply delineated).
Former magnetotransport studies up to GPa showed that the low-field phase boundary follows a quadratic shape,kezsmarki i.e. , where pressure dependent critical field and the zero-field transition temperature scales together according to . In the case of the GPa measurement – and for any lower pressures – no broadening of the transition was observed up to the highest field investigated . Taking as the characteristic energy scale, this field corresponds to . In contrast, in the high-pressure range GPa the transition is considerably smeared out by magnetic fields smaller than , as shown in Figs. 2. This implies that in the new regime of the transition, i.e. in the boxed range of Fig. 1, the insulating phase became considerable less stable against the change of pressure and the application of magnetic field. We guess that the arising of an electronically soft state of matter is due to the presence of competing orders.
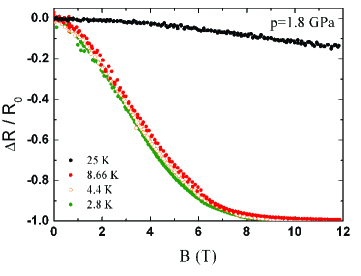
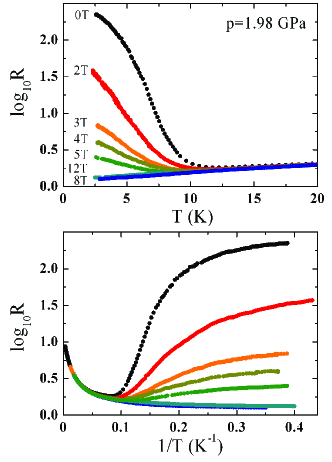
We also found that if is suppressed below then the metallic state can be reached by applying magnetic field. Such field-driven metal–insulator transitions are shown in Figs. 2 and 3 for GPa and GPa, where at zero magnetic field the transition temperatures are K and K, respectively. Figure 2. shows the temperature dependencies at various magnetic fields (T-sweeps at GPa). At low fields the low-temperature resistivity is monotonically increasing with decreasing temperature, indicating an insulating state. However, at high fields the temperature dependence changes character and the ground state of the system is metallic. Figure 3 present an example for the magnetic field dependence of the resistance at various temperatures (B-sweeps at GPa). In both cases the field-induced insulator-to-metal transition have taken place at values well below derived from the low-pressure scaling rule. These would be T and T for GPa and GPa, respectively. This also implies that the transition in the boxed regime of Fig. 1 has a different character, and we investigate this point in more detail below.
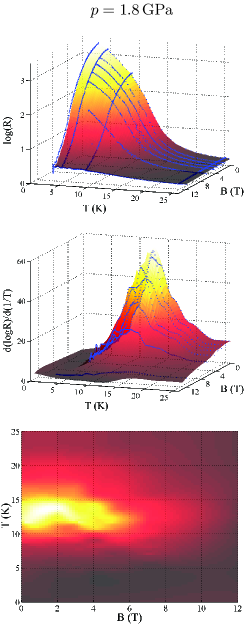
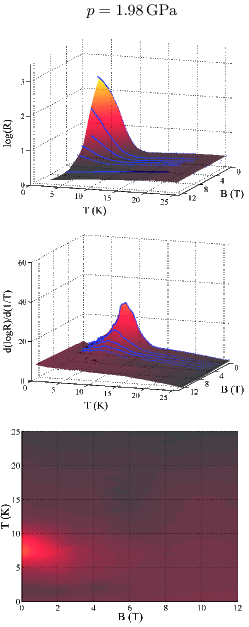
The overall character of the field-induced transition is revealed by the 3-dimensional plot of over the – plane. This is shown for GPa in the upper panel of Fig. 4. Here the surface is constructed from the experimental -sweep and -sweeps; beside the results shown in Fig. 3 this plot includes also temperature dependencies at various magnetic fields. It is clear that at the system is most insulating at low , while the drive towards the conducting state looks quite similar in and directions.
The transition temperature is generally identified with the position of the peak in the logarithmic derivative of the resistivity. The middle and bottom panels of Fig. 4 show the curves over the – plane. The top view of the color-coded surface illustrates the magnetic field dependence of the transition temperature. Though this might imply that a certain point drops sharply as a function of the magnetic field and a field-induced first order transition takes placespinpeierls , the side view of the surface reveals that that the main effect of the magnetic field is not the shifting of the cusp in the derivative, but rather its general suppression.
The same analysis of the data recorded at GPa (Fig. 5) shows that with increasing pressure the insulating domain shrinks, the transition temperature is shifted down, but the general features remain unchanged. Again, by increasing , the transition becomes ill-defined indicating that the character of the high-pressure MIT is definitely different from that of the low-pressure (say GPa) sharp transition. We interpret the observed broadening as a sign that magnetic ordering phenomena (related to those appearing at the low-pressure ordering transition at ) begin to interfere with the MIT, from GPa upwards or K downwards.
The suppression of non-ferromagnetic order by magnetic field is a common phenomenon but it is not necessarily associated with the broadening of the transition. There are many systems (including ordinary antiferromagnets) which possess breakable symmetries even in the presence of an external magnetic field. This residual symmetry can be broken by an order parameter which is not induced by the field. The critical temperature decreases with increasing but the transition remains well-defined. An example is given by the spin density wave system of which continues to undergo a sharp phase transition around 10K even in magnetic fields as high as T.chaikin
BaVS3 is definitely not in the above category, the metal-insulator transition is considerably broadened in fields as demonstrated in Figs. 4 and 5. There are two possibilities: either the order of the phase is induced by the field (thus in the presence of the external field there is no symmetry breaking and the transition becomes ill-defined), or the observed phenomena are kinetic, and cannot be explained in the language of equilibrium phase transitions.
Taking the first possibility, field induces in linear order the corresponding components of spin and orbital momentum. This is relevant if the low- phase BaVS3 possesses a net ferromagnetic moment (since the ferromagnetic moment may be very weak, it may have escaped experimental detection). Even if the zero-field ground state carries no total magnetization, field could also induce higher-order uniform moments. If one these is mixed into the order parameter of BaVS3 at , the observed broadening may once again follow.
Future experiments will decide whether the broadening of the transition can be explained in terms of equilibrium phases, as described above. However, we wish to point it out that there is an alternative: namely that the broadening is a relaxation effect, and thus not explicable within the framework of equilibrium phase transitions in ideal systems.
There is an independent observation showing that the character of the MIT changes, and becomes mixed with, or preceeded by, magnetic ordering phenomena in this – regime; above GPa hysteresis loops may appear both in -cycles and in -cycles neven ; nevennfl . The shape of the hysteresis loops depends on the sweep rate, suggesting that we are dealing with a relaxation phenomenon. Hysteresis appears both above and below the critical pressure, thus it is plausible to relate it to the complicated long-period order which was observed by magnetic neutron scattering magn_str ; naka97 ; private . Similar, so called weak relaxation effects were observed in incommensurate density wave systems and successfully interpreted in the picture of a non-ideal system going through a hierarchy of pinned states kriza . Formally, the random impurity pinning leads to a broad distribution of the relaxation times, and this results in logarithmic, power law, or stretched exponential relaxation. The finding that the ambient-pressure low- phase of BaVS3 displays a magnetic order which is incommensurate both in the basal plane and along the -axis private may provide the key elements for an analogous relaxation mechanism. If an incommensurate structure is locally pinned to defects, while the optimal wave number is temperature dependent, the temperature sweep yields an inhomogeneous state which try to relax towards the optimal structure with a locally varying rate.
To summarize, we investigated the high-pressure low-temperature region where the insulating phases are suppressed. The zero field boundary was followed down to K. We did not directly see a first order jump in either the temperature, or the pressure, or the field dependence, but in the range K, GPa we observed a considerable smearing out of the phase transition by magnetic field. We suggest this is a sign that the metal-insulator transition and magnetic ordering phenomena appear combined in this (, ) regime.
Acknowledgments. P.F. is greatly indebted to H. Nakamura and T. Kobayashi for enlightening discussions and for their communicating results prior to publication, to J.P. Pouget and S. Barišić for most valuable correspondence on the subject, and to I. Kupćić, K. Penc and K. Radnóczi for discussions on the electronic structure of BaVS3. This work was supported by the Swiss National Foundation for Scientific Research and its research pool ”MaNEP” and by the Hungarian Scientific Research Fund OTKA under grant Nos. TS049881, K62280, K62441 and Bolyai 00239/04.
References
- (1) O. Massenet, J. J. Since, J. Mercier, M. Avignon, R. Buder, V. D. Ngugen and J. Kelber, J. Phys. Chem. Solids 40 573 (1979).
- (2) For recent review see: N. Barišić: PhD Thesis (EPFL Lausanne 2004).
- (3) T. Graf, D. Mandrus, J. M. Lawrence, J. D. Thompson, P. C. Canfield, and S.-W. Cheong and L. W. Rupp, Phys. Rev. B 51, 2037 (1995).
- (4) G. Mihály, I. Kézsmárki, F. Zámborszky, M. Miljak, K. Penc, P. Fazekas, H. Berger and L. Forró, Physical Review B 61, R7831 (2000).
- (5) H. Imai, H. Wada, and M. Shiga: J. Phys. Soc. Jpn. 69, 2763 (2000).
- (6) I. Kézsmárki, G. Mihály, R. Gaál, N. Barisic, H. Berger, L. Forró, C.C. Homes, and L. Mihály, Phys. Rev. B. 71, 193103 (2005).
- (7) I. Kézsmárki,G. Mihály, R. Gaál, N. Barisic,A. Akrap, H. Berger, L. Forró, C.C. Homes, and L. Mihály, Phys. Rev. Lett. 96, 186402 (2006).
- (8) L. Forró, R. Gaál, H. Berger, P. Fazekas, K. Penc, I. Kézsmárki and G. Mihály, Phys. Rev. Lett. 85, 1938 (2000).
- (9) I. Kézsmárki, Sz. Csonka, H. Berger, L. Forró, P. Fazekas, and G. Mihály,, Phys. Rev. B63, 081106(R) (2001).
- (10) P. Fazekas, K. Penc, H. Berger, L. Forró, Sz. Csonka, I. Kézsmárki, and G. Mihály, Physica B 312-313, 694-695 (2002).
- (11) It was known that the MIT is associated with an anomaly of the ratio.graf This in itself would not change the symmetry of the lattice.
- (12) T. Inami, K. Ohwada, H. Kimura, M. Watanabe, Y. Noda, H. Nakamura, T. Yamasaki, M. Shiga, N. Ikeda, and Y. Murakami, Phys. Rev. B 66, 073108 (2002).
- (13) R.A. Gardner, M. Wlasse, and A. Wold, Acta Crystallogr., Sect B14, Struct. Crystallogr. Cryst. Chem. 25, 781 (1969); M. Ghedira, M. Anne, J. Chenavas, M. Marezio, and F. Sayetat, J. Phys. C 19, 6489 (1986).
- (14) S. Fagot, P. Foury-Leylekian, S. Ravy, J.P. Pouget, and H. Berger, Phys. Rev. Lett. 90, 196401 (2003).
- (15) S. Fagot, P. Foury-Leylekian, S. Ravy, J.P. Pouget, M. Anne, G. Popov, M.V. Lobanov, and M. Greenblatt, Solid State Sciences 7, 718 (2005).
- (16) S. Fagot, P. Foury-Leylekian, S. Ravy, J.P. Pouget, E. Lorenzo, Y. Joly, M. Greenblatt, M.V. Lobanov and G. Popov, Phys. Rev. B 73, 033102 (2006).
- (17) H. Nakamura, T. Yamasaki, S. Giri, H. Imai, M. Shiga, K. Kojima, M. Nishi, K. Kakurai, and N. Metoki, J. Phys. Soc. Jpn. 69, 2763 (2000).
- (18) H. Nakamura, H. Imai, and M. Shiga, Phys. Rev. Lett. 79, 3779 (1997).
- (19) H. Nakamura, private communication; T. Kobayashi, private communication.
- (20) N.F. Mott: Proc. Roy. Soc. A 62, 416 (1949); Metal–Insulator Transitions, (Taylor & Francis Ltd., London, 1974).
- (21) M. Imada, J. Phys. Soc. Jpn. 73, 1851 (2004); 74, 859 (2005).
- (22) N. Barišić, I. Kézsmárki,P. Fazekas, G. Mihály, H. Berger, L. Demkó, and L. Forró, cond-mat/0602262.
- (23) The MIT of BaVS3 is associated with the disappearance of a spin gap. The latter aspect is similar to what we find at the order-disorder transition of spin-Peierls systems (J. A. Northby et al., Phys. Rev. B 25, 3215 (1982), and references therein). The analogy with spin-Peierls systems would lead us to expect that drops to zero at a critical field, similar to the boundary traced by white circles in Fig. 3. However, BaVS3 is essentially different from spin-Peierls systems since the latter are large- Mott insulators on both sides of the transition.
- (24) G.M. Danner, P.M. Chaikin, and S.T. Hannahs, Phys. Rev. B 53, 2727 (1996).
- (25) G. Kriza and G. Mihály: Phys. Rev. Lett. 56, 2529 (1986); G. Mihály, Yong Kim, and G. Gruner, Phys. Rev. Lett. 66, 2806 (1991).