Condensation transition in DNA-PAMAM dendrimer fibers studied using optical tweezers
Abstract
When mixed together, DNA and polyaminoamide (PAMAM) dendrimers form fibers that condense into a compact structure. We use optical tweezers to pull condensed fibers and investigate the decondensation transition by measuring force-extension curves (FECs). A characteristic plateau force (around 10 pN) and hysteresis between the pulling and relaxation cycles are observed for different dendrimer sizes, indicating the existence of a first-order transition between two phases (condensed and extended) of the fiber. The fact that we can reproduce the same FECs in the absence of additional dendrimers in the buffer medium indicates that dendrimers remain irreversibly bound to the DNA backbone. Upon salt variation FECs change noticeably confirming that electrostatic forces drive the condensation transition. Finally, we propose a simple model for the decondensing transition that qualitatively reproduces the FECs and which is confirmed by AFM images.
pacs:
82.35.-x,82.37.-j,87.15.-vIntroduction. In eukaryotes, genomic DNA is compacted in a complex nucleoprotein phase known as chromatin. Such condensation is an important mechanism for protecting the genetic information from external factors, as well as in storing the long DNA into a compartment with dimensions on the order of microns. The basic unit of chromatin organization is a nucleosome. There 8 histone molecules join to form a core particle 6 nm in diameter and the DNA wraps 2 times around that core forming a solenoid that is 10 nm wide. When such particles are spaced evenly along the DNA, they form the 10 nm fiber or beads on a string structure as seen in electron micrographs. Under various salt conditions, nucleosomes prefer higher-order condensed structures such as a 30 nm fiber, 100 nm fiber, etc. It has long been recognized that the main driving force for condensation is electrostatic interaction between negative DNA and positive histone proteins vanHolde but little is known about what determines the stability of these specific structures. Do the size and shape of core particle determine how DNA wraps around it and thus the amount of length compaction? Are specific charge stripes on the core particles required for DNA winding or would a uniform spherical charge distribution work as well? What factors determine spacing between nucleosomes in the 10 nm fiber? In order to answer such questions it may be useful to consider model systems that are much simpler than the DNA-histone complexes while, at the same time, retain some of the important characteristics of the DNA-histone fibers.
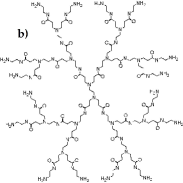
To this end, we have chosen to study the condensation of DNA by polyaminoamide (PAMAM) dendrimers. These dendrimers are synthetic branched polymers that exhibit such excellent properties as molecular uniformity, well-defined size, high water solubility, and very low toxicity. Because of these special properties, PAMAM dendrimers are currently being investigated for their potential in such biological applications as the transfection of foreign genetic materials into eukaryotic cells kukowskabielinska . The PAMAM dendrimers we investigated were synthesized via an initiator core-EDA, ethylenediamine, followed by a series of repeated polymerization steps (the number of steps defines the generation of the dendrimer), terminating with amino () groups. At physiological pH values, the surface amino groups of the dendrimers are protonated. To study the structure of the condensed state and to elucidate the effects of dendrimer charge and size, we pulled DNA-dendrimer fibers using optical tweezers. Based on our results, we propose a simple theoretical model for the condensation-decondensation transition that qualitatively reproduces the force-extension curves (FECs). This model is further validated via atomic force microscopy (AFM) imaging of the DNA-dendrimer complexes. Finally, we compare our results with those of optical-tweezers experiments done on native chicken erythrocyte chromatin fibersCuiBus00 and on reconstituted chromatin fibersBen01 ; RowTow02 .
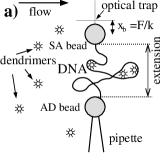
Experimental setup. Pulling experiments were carried out with a fragment of -phage DNAfoot1a and three dendrimer generations G5, G6, G8. Here, the number of surface amino groups equals 128, 256, 1024 and the diameters equal 5.7, 6.7 and 9.7 nm, respectively foot1b . Most of the experiments were done in buffer containing 100 mM of NaCl. We used optical tweezers to exert force on the DNA molecule as shown in Fig. 1a. Two types of polystyrene beads (Spherotech) of 2-3 in diameter were used: streptavidin (SA) coated beads and anti-digoxigenin (AD) beads foot1c . SA beads were held in a dual-beam optical trap SmiCuiBus02 . A tether was made by fishing for the free-end of the DNA with an AD bead kept on a micropipette by suction. After first characterizing the properties of the naked DNA, the chamber (30 ) was rinsed with 100 of buffer containing 30 nM of dendrimers. This process typically lasted 8 min. The flow was then halted and the fiber was repeatedly pulled by moving a piezo-controlled stage attached to the pipette.
DNA was condensed by one of two protocols: (1) constant-extension protocol (CEP) and (2) constant-force protocol (CFP). In the CEP, the distance between the center of the optical trap and the bead on the tip of the micropipette was kept constant while the chamber was rinsed with the buffer containing dendrimers. As the dendrimers bound to the DNA, the force increased with time. In the CFP, a feedback loop mechanism was used to maintain a constant force. Here, condensation was marked by a decrease in extension of the molecule as a function of time.
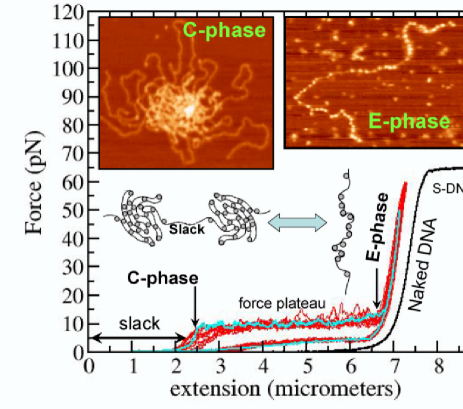
Results. FECs are reproducible on different molecules if they are condensed following the same protocol and exposed to the dendrimers under identical conditions. This effect is shown in Fig. 1c where two different DNA molecules, condensed at constant force under identical conditions, generated the same FEC. The FECs show the existence of a well-defined force plateau along the pulling curve, centered about 10 pN. This feature is the signature of a condensation-decondensation first-order phase transition separating a condensed (C) from an extended (E) phase. Upon relaxation, the fiber once again undergoes a transition from the E to the C form that manifests as a lower force plateau. The FECs display the following general features (for both protocols and for all dendrimer generations): a) strong hysteresis between the pulling and relaxation curves; b) repeatable pattern of FECs over successive pulling-relaxation cycles; c) shortening of the contour length of the extended fiber () suggesting that dendrimers remain bound to the DNA in the E-phase; d) existence of a ”slack” region in the FECs at short end-to-end extensions, where the fibers extend by at relatively low (3 pN) force.
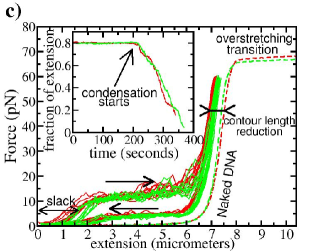
When the protocol conditions differ, the FECs change from experiment to experiment. In general, for all condensation protocols, the amount of slack is anti-correlated to the reduction observed in the effective contour length of the fiber (i.e. the observed extension where the force rises rapidly in the E-phase). A larger slack is always accompanied by a smaller reduction in contour length, suggesting that the origin of the slack is the presence of naked DNA regions. Using different time protocols, we verified that the amount of slack depends on the time exposure of the fiber to the dendrimer flow. A large slack is observed when a fiber is exposed to flow for a short time ( min.) whereas for a longer exposure ( min.) the slack became too short to measure accurately (0.1 , data not shown). Oddly, the measured slack decreased only while the dendrimer buffer was flowing past the fiber but not as the buffer sat quiescent in the chamber. After the flow had stopped, the FECs remained repeatable in time. This effect probably indicates a rapid partition of available dendrimers between the DNA and glass chamber walls, and a depletion of dendrimers in the buffer. Similar depletion effects have also been observed for positively charged proteins that stick to negative glass walls.
To check whether dendrimers exchanged between the DNA and those in the buffer solution during the pulling-relaxation cycle, we flowed clean dendrimer-free buffer solution through the center of the chamber and repeatedly pulled the fiber several times in the presence of a small flow to wash out any dendrimers expelled from the backbone. No time-dependent change in the FEC was observed. Evidently, dendrimers are irreversibly bound to the DNA backbone, i.e. they do not bind and unbind from the DNA during the pulling cycles. This fact was further tested by trying to condense DNA while keeping the fiber at forces as high as 20 pN. Condensation was observed in all cases indicating that dendrimers bind to DNA up to very high forces. In contrast, real chromatin fibers eventually lose their histone proteins after repeated pulls or when subjected to high forces and eventually assume the FECs characteristic of naked DNA Ben01 ; RowTow02 .
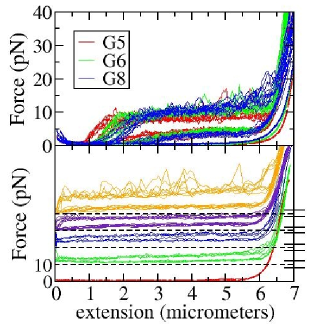
For identical condensation protocols, FECs are affected by dendrimer size in a systematic manner (Fig. 2 upper panel). The larger the generation is, the higher the value of the decondensing force plateau. This result may be attributed to the increase in electrostatic strength, i.e. increase in surface amino groups, with increasing dendrimer generation.
The importance of the electrostatic interaction as the main force stabilizing the condensed state is revealed by investigating the effect of salt concentrations on the FECs (lower panel in Fig. 2). Clearly, as the salt concentration increases, both the extent of hysteresis and the value of the decondensing force plateau decrease. At high salt concentrations (500 mM NaCl) the hysteresis disappears and the FEC shows a plateau at low forces ( pN) similar to that observed when DNA condenses in the presence of multivalent cations Baumann1 . At low salt concentrations the hysteresis increases noticeably and the pulling curve becomes noisy, revealing a stickier fiber (uppermost curve in Fig. 2, lower panel).
The model. Because DNA and dendrimers have opposite charge, dendrimers will bind non-specifically and will distribute themselves non-homogeneously along the length of the DNA backbone. In certain regions in which many dendrimers bind side by side, the DNA tends to condense forming a compact globular structure (C-phase) which is maintained by electrostatic forces bridging dendrimers with nonadjacent segments of DNA BorNet03 . These globular structures are interspersed with regions of naked DNA. When the fiber is pulled, initially work is done to straighten the regions of naked DNA (entropic elasticity) giving rise to the observed slack. As these naked regions are straightened and the force reaches a certain critical value (the value of the plateau) the bridges that hold together the globular structures begin to yield resulting in their mechanical decondensation, revealed by the plateau in the FECs. At the end of this process, all globular structures have been converted to an extended phase (E-phase) in which the DNA molecule resembles a line of negative charge with a random sequence of positively charged patches along its backbone. Such extended structure might conceivably resemble the 10 nm fiber in chromatin. This model and the existence of the C,E-phases were confirmed by AFM images of the fibers (Fig. 3, insets) foot3 .
Finally we have considered a simple theoretical description of our model that can qualitatively reproduce the experimental results shown in Fig. 1, in particular the force plateau, the large hysteresis observed during the pulling-relaxation cycle, and the qualitative difference between the pulling curve (showing a plateau) and the relaxation curve (showing a soft shoulder). The model consists of a collection of non-interacting two-level systems that mimic the contacts between dendrimers and neighboring DNA segments. The parameters describing these molecular contacts are the free-energy of formation of each -contact , its activation barrier and the distance to the contact-formed state. Upon the action of mechanical force each contact yields an extension in a thermally activated process Bell78 . The resulting model shows qualitative agreement with the experimental results by including some structural disorder(Fig. 3, blue curve)foot4 . In general, a few hundred contacts are needed to reproduce the experimental data implying a similar number of dendrimers are adsorbed onto the DNA backbone.
Conclusion. We have explored the behavior of DNA condensed by PAMAM dendrimers in hopes of finding a simple model to explain chromatin condensation. Our results do show some similarities between the DNA-dendrimer complex and chromatin. Under certain conditions, FECs show similar unfolding and refolding forces and have similar compaction ratios to chromatin fibers Ben01 ; RowTow02 ; CuiBus00 . However, it may be possible that nonspecific condensation of DNA by other polycationic complexes (e.g., eukaryotic condensin, spermidineBaumann2 ) also exhibit similar behavior.
An essential aspect of chromatin structure is the fact that DNA wraps twice around each histone complex. We have little evidence that something similar happens for dendrimers. Our AFM images cannot resolve the path of the DNA around or through such particles. Slack in the condensed fiber disappears with sufficient exposure to dendrimers. Thus it probably does not represent a stable extended state like the 10 nm chromatin fiber. Previous optical-tweezers pulling experiments on reconstituted chromatin Ben01 ; RowTow02 revealed a ”sawtooth” force pattern corresponding to sudden opening of the DNA wraps. Except for a few cases (with G8), we never clearly identified such events. Perhaps back-folding of the terminal amino groups inside the dendrimer and the considerable flexibility of low generation dendrimersMaiti04 allow the dendrimers to bend around the DNA more than the DNA bends around the dendrimers. Such flexibility would help explain the tight binding of dendrimers to DNA at high tension (60 pN), where hard spheres would lose contact with a linear molecule pulled straight MarkoSiggia . The structural deformation of dendrimers bound to DNA might be confirmed by NMR, TEM or ab-initio numerical simulations of DNA-dendrimer complexes. Further experiments using varied salt, temperature, and pH conditions should allow for considerable refinement of the dendrimer/DNA model. It might be worthwhile to carry out pulling experiments with more rigid condensing agents such as metallic gold nanoparticles to simulate nucleosomes.
Acknowledgments. We acknowledge stimulating discussions with Dr. Jean M. J. Frechet and assistance with DNA preparation by Dr. Pan Li. This work was supported in part by the U.S. Department of Energy grant DE-AC0376SF00098, GTL2BB ”Microscopy of Molecular Machines”, the Spanish research council (FIS2004-3454) and the Catalan government (Distinció de la Generalitat).
References
- (1) T. D. Yager, C. T. McMurray, and K. E. van Holde, Biochemistry 28, 2271 (1989).
- (2) J. F. Kukowska-Latallo et al., Proc. Natl. Acad. Sci. USA 93, 4897 (1996); A. Bielinska et al., Nuc. Acids Res. 24, 2176 (1996).
- (3) Y. Cui and C. Bustamante, Proc. Natl. Acad. Sci. USA 97, 127 (2000).
- (4) M. L. Bennink et al., Nature Struct. Biol. 8, 606 (2001).
- (5) B. D. Brower-Toland et al., Proc. Natl. Acad. Sci. USA 99, 1960 (2002).
- (6) For the optical-tweezers experiments, a 24-kbp -DNA fragment(New England Biolabs) was made by digesting the linear DNA at the Xba I site. The DNA was labeled on one end with biotin and on the other end with digoxigenin.
- (7) PAMAM dendrimers were purchased from Dendritic Nanotechnologies, Inc. For the single-molecule experiments, the dendrimers were first diluted 1/100 with water and then another 1/1000 to 10/1000 by TE buffer (10mM Tris-HCl pH 7.5, 1mM EDTA, 100mM NaCl, 1.5mM MgCl2, 0.02%(v/v) Tween 20 and 0.01% (w/v) milk powder).
- (8) SA beads were incubated with DNA at concentrations such that on average there was DNA molecule per bead. AD beads were made by cross-linking polyclonal sheep anti-digoxigenin(Roche) to Protein G beads (Spherotech).
- (9) S. B. Smith, Y. Cui and C. Bustamante, Methods. Enzymol. 361, 134 (2003).
- (10) C. G. Baumann et al., Proc. Natl. Acad. Sci. USA 94, 6185 (1997).
- (11) J. F. Marko and E.D. Siggia, Biophysical Journal 73, 2173 (1997).
- (12) R. Netz and J.-F. Joanny, Macromolecules 32, 9026 (1999); H. Boroudjerdi and R. Netz, Europhys. Lett. 64, 413 (2003).
- (13) For the AFM experiments, a 3.5 kbp DNA fragment was incubated with dendrimers at a 4:1 (DNA phosphate:Dendrimer amine) ratio for 5 minutes at room temperature in 10mM Tris-HCl (pH 7.5), 1mM EDTA, 100mM NaCl, 1.5mM . AFM images were obtained using the Nanoscope IIIA Scanning Probe Microscope (Digital Instruments).
- (14) G.I. Bell, Science 200, 618 (1978); E. Evans, Annu. Rev. Biomol. Struct. 30, 105 (2001).
- (15) C. G. Baumann et al., Biophys. J. 78, 1965 (2000).
- (16) P. K. Maiti, T. Cagin, G. Wang and W. A. Goddard III, Macromolecules 37, 6236 (2004).
- (17) (Exp. Setup): pN/nm, pNnm, pulling speed 200 nm/s, bead radii 1; (DNA fiber): slack 2.7, E-DNA contour and persistence lengths are 7.2 and 20 nm resp., Young modulus ; (Two-state contacts:) total number=300, nm, nm, critical force at equilibrium and dissociation rate at , . Free-energies are exponentially distributed with and .