Magnetic field-induced quasiparticle excitation in Nb3Sn: Evidence for anisotropic -wave pairing
Abstract
The response of vortex state to the magnetic field in Nb3Sn is probed using muon spin rotation and small-angle neutron scattering. A transformation of vortex structure between hexagonal and squared lattice is observed over a relatively low field range of 2–3 Tesla. The gradual increase of the magnetic penetration depth with increasing field provides microscopic evidence for anisotropic (or multi-gapped) -wave pairing suggested by the Raman scattering experiment. This result renders need for careful examination on the difference of electronic properties between Nb3Sn and V3Si.
pacs:
74.25.Jb, 74.25.Nf, 76.75.+i, 61.12.ExWhile the technologies for utilizing high- cuprates are making steady progress in recent years, triniobium stannide (Nb3Sn) is still one of the most important materials for the practical application of superconductivity after fifty years since its discovery.Matthias:54 Because of its convenient characters such as modestly high transition temperature ( K) and remarkably high upper critical field ( T), Nb3Sn is used at the heart of superconducting devices, most notably as superconducting wires in high-field magnets. Nb3Sn belongs to a class of binary intermetallic compounds with the A15 or -tungsten structure, where those based on Nb give rise to a subclass that includes Nb3GeMatthias:65 , which used to dominate the highest ( 23 K) for more than thirty years, and therefore it was once a subject of intensive study until ’70s.Testardi:75 ; Weger:73 ; Allen:80 Surprisingly, however, it seems that the microscopic details on the superconducting characters of Nb3Sn are not fully understood to date. For example, the revelation of a structural transformation from cubic to tetragonal with decreasing temperature not far above (martensitic phase transition, which occurs at K in Nb3SnMailfert:67 ) led to the argument that the coupling to the instability of lattice vibrations (soft phonons) associated with the martensitic transition might contribute to the increase of . Experimental verification of the elastic softeningShirane:71 ; Axe:73 prompted various models for microscopic mechanism of the martensitic transition, many of which emphasize the importance of the quasi-one-dimensional character of Nb atoms in the A15 structure that might also lead to the anomaly in the electronic density of states, the Kohn anomaly due to electron-phonon interaction, or to the Peierls instability.Testardi:75 ; Weger:73 ; Allen:80 Unfortunately, while these models were partially successful to explain the elastic properties of Nb3Sn, none of them has appeared as unambiguous explanation for the high .
Here, we report on the first systematic study of vortex (flux line) state in Nb3Sn using muon spin rotation (SR) and small-angle neutron scattering (SANS). The combined use of SR and SANS on the identical specimen is proven to be ideal for the study of the mixed state, as they provide complementary information on the magnetic field distribution associated with flux line lattice (FLL): SR is sensitive to local field distribution while SANS is sensitive to the long range structure of FLL. Moreover, it eliminates much of the problems associated with the difference in the preparation of specimen. In this brief communication, we show that one of the keys to understand the superconductivity of Nb3Sn is the anisotropy in the electronic state, which is demonstrated by the transformation of FLL structure from hexagonal to squared with increasing flux density. Similar observation in V3Si strongly suggests that this is a common feature of the superconductors with A15 structure,Yethiraj:99 ; Sosolik:03 where the anisotropy of the Fermi surface is reflected through the nonlocal effect.Kogan:97a ; Kogan:97b Meanwhile, the field-induced enhancement of the magnetic penetration depth at lower fields, which is absent in V3Si,Sonier:04b indicates the presence of low energy quasiparticle excitation due to the quasiclassical Doppler shift.Volovik:93 This result strongly suggests that the superconducting order parameter also has an anisotropic (or multi-gapped) structure on the Fermi surface.Kadono:04
Nb3Sn samples were prepared by the method described elsewhere.Fujii:82 The superconducting transition temperature was determined to be 17.9(2) K, as inferred from the shielding effect in magnetization measurement. Several single crystals with a sizable dimension ( mg each, covering a beam spot area of mm2 with random crystal orientation) were used for SR measurement with a high transverse field spectrometer (HiTime) installed on the M15 beamline of TRIUMF, Canada, where they were irradiated by a muon beam of 4 MeV. Further details on the SR measurements using HiTime might be found in earlier publications.Ohishi:03 One of these crystals, which was confirmed to be of single domain at ambient temperature, was used for the neutron measurements with the SANS-J spectrometer of JRR-3, Japan Atomic Energy Agency. In both measurements, precautions were taken to minimize the effect of flux pinning: every time when external magnetic field was changed, the sample temperature was raised above and cooled down again after the magnetic field was settled. The magnetic field dependence was obtained for transverse field SR spectrum (TF-SR, where the initial muon spin polarization is perpendicular to the external field) at 2.0–2.5 K and for SANS spectrum at 2.6(1) K, respectively.
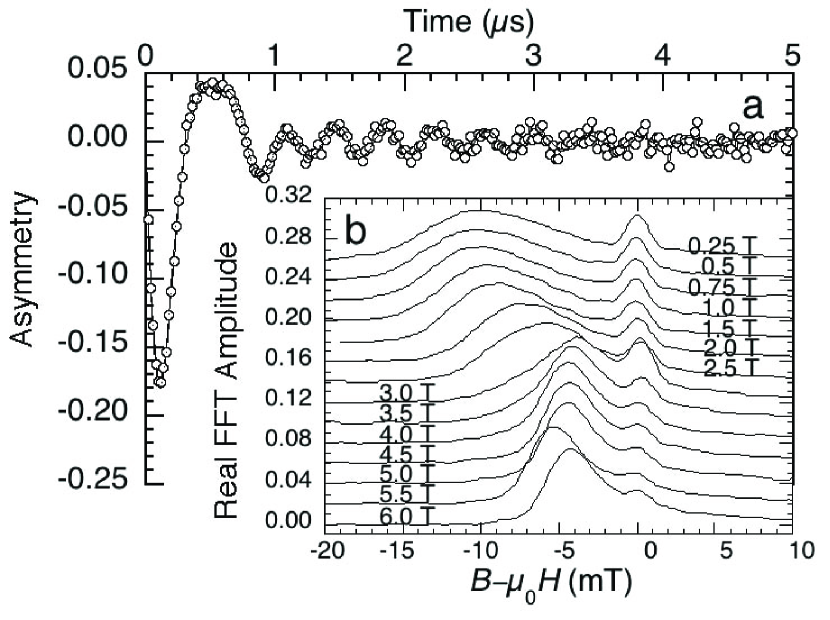
Since we can reasonably assume that implanted muons (with 4 MeV) stop randomly on the length scale of FLL (which is 20–200 nm over the relevant field range), TF-SR signal provides a random sampling of the internal field distribution , , with , where is the additional relaxation due to random flux pinning, is the spectral density for the internal field defined as a spatial average () of the delta function over a unit cell of FLL, is the muon gyromagnetic ratio (= 2 MHz/T), and is the initial phase of rotation.Brandt:88 These equations indicate that the real amplitude of the Fourier transformed muon spin precession signal corresponds to the spectral density, . In the modified London model, which is a good approximation to evaluate at relatively lower external fields ()Fesenko:93 , is given by a sum of the magnetic induction from isolated vortices to yield
| (1) | |||||
| (2) |
where are the vortex reciprocal lattice vectors, () is the average internal field, is the effective London penetration depth, is the cutoff parameter for the magnetic field distribution near the vortex cores, and and are dimensionless parameters arising from the nonlocal corrections with the term proportional to controlling the fourfold anisotropy: the overline denotes an averaging of the parameter over the polar angle of the symmetry axis, as it is anticipated for a mosaic of crystals.Kogan:97a It is evident in Eq.(1) that is a spatial Fourier component of . The model predicts an asymmetric field profile for characterized by a negatively shifted sharp cusp due to the van Hove singularity associated with the saddle points of and an asymptotic tail towards higher fields where the maximal field is determined by (with being the vortex centers).
Examples of the fast Fourier transform (FFT) of SR spectra at several external magnetic fields are shown in Fig. 1, where one can readily observe the asymmetric lineshape with slight smearing due to the random pinning of vortices, random local fields from nuclear moments, and the limited time window for FFT ( s: note that such smearing is irrelevant for the analysis in time domain). Based on the least-square method with appropriate consideration of the statistical uncertainty, the SR spectra are compared in time domain with those calculated by using Eqs.(1)–(2) to deduce a set of parameters, , , , , and : a typical example is shown in Fig. 1. For the reconstruction of from , one needs to know the two-dimensional structure of FLL obtained from other experimental techniques including SANS. In particular, it is noticeable in Fig. 1 that the peak due to the saddle points exhibits a steep change with increasing external field from 2 T to 3 T, suggesting an anomaly in the FLL structure. As shown below, this speculation is confirmed by SANS measurements over the region of relevant magnetic field.
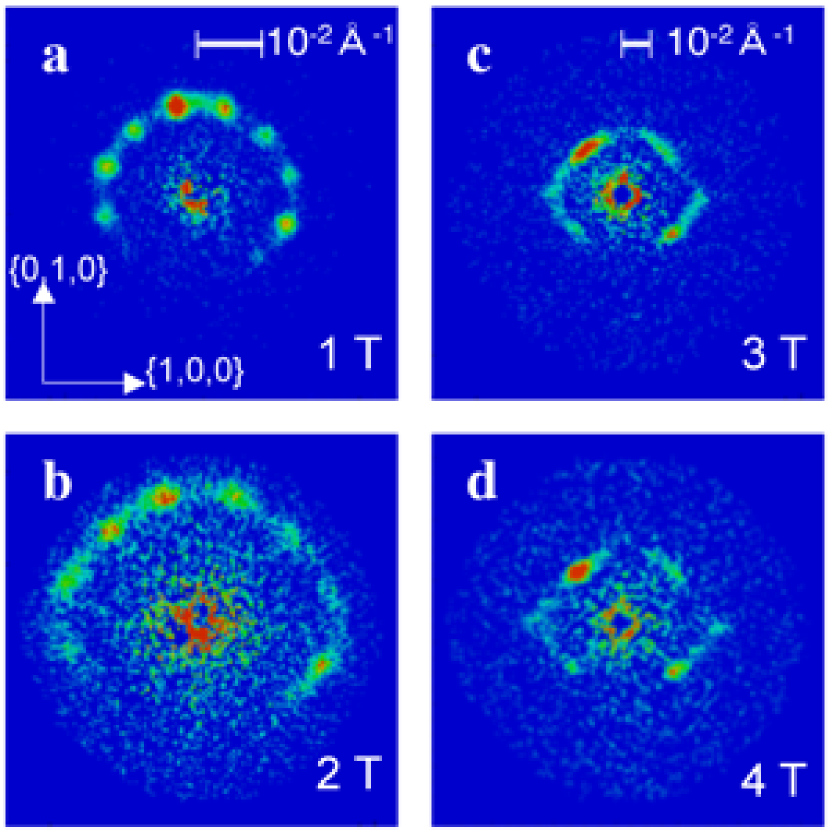
In a SANS experiment, a FLL gives rise to Bragg reflections at reciprocal lattice points, . The intensity of a single reflection is given by . Considering Eq.(2), it is reduced to for a first order reflection, where with being the FLL interval ( for a hexagonal FLL) and is the flux quantum. Fig. 2 shows the typical SANS-J data at 2.6(1) K after subtracting background data obtained at 30 K (, which is far below ), where scattered neutrons from an incident beam with a mean wavelength Å (0.13 FWHM, collimated within a diameter of 2 mm) are detected by a position-sensitive detector (consisting of 128128 pixels with each pixel size being mm2, covering a sensitive area of 58 cm ) at a distance of 10 m (1–2 T) or 4 m (3–4 T) from the specimen. One of the crystal -axes and external magnetic field are aligned together to the neutron beam. The cryostat (including the magnet) and specimen are rotated slightly (, in several steps) around the vertical axis to obtain a sum of diffraction patterns over Bragg angles for both triangular and square FLL structure. It is clear in Fig. 2 that there is a difference in the pattern of angles between data at 1–2 T and those at 3–4 T. Since the patterns at lower fields suggests an overlap of two (possibly distorted) hexagonal domains due to the tetragonal crystal structure, their change into the nearly four-fold symmetric pattern at higher fields demonstrate the occurrence of triangular-to-square lattice transformation at 2–3 T. The field range of transformation is considerably higher than that in V3Si, where the transition to square lattice is nearly complete at 1.5 T (with {0,0,1}).Yethiraj:99 As shown in Fig. 4d, the apex angle of the real space unit cell is evaluated to be indeed close to 60∘ and 90∘ for the respective data. Furthermore, the spots on the {1,0,0} axis at high fields (Figs. 2c, d) is absent at lower fields. This clearly indicates that the diagonal of the real space rhombic unit cell, which is aligned to {1,1,0} or {1,,0} direction in each domain, rotates to a {1,0,0} direction with increasing field. A similar domain structure at lower field has been observed in V3Si.Yethiraj:99 ; Christen:85
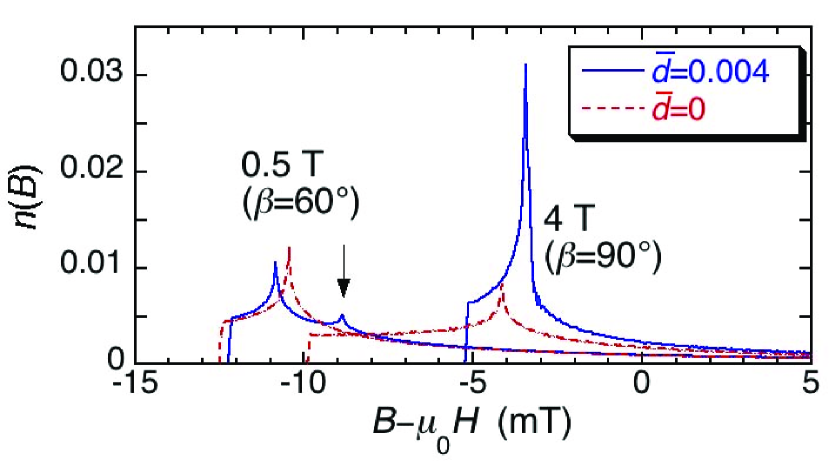
Once the FLL structure is resolved by SANS measurements, high quality SR spectra can provide rich information on the mixed state though the detailed mapping of ; as it has been demonstrated in the earlier worksSonier:04b ; Ohishi:02 , the lineshape strongly depends on , , and in Eq.(2) and thereby they can be deduced by fitting analysis without much ambiguity. In particular, as shown in Fig. 3, the spectral weight for the lower field side of the van Hove singularity strongly depends on the magnitude of for the square FLL. Besides these, we need to introduce two more parameters to describe the reciprocal vectors which undergo transformation: the apex angle, , and the mean width for the FLL distortion, ,Kadono:01 to describe the fluctuation of the reciprocal vectors, with a probability distribution function, . The last parameter effectively serves to add a Lorentzian-type broadening to and thereby discernible from the Gaussian broadening due to local disorder (which is described by ). The randomness associated with the mosaic crystals is presumed to be represented by . Fig. 4 shows the field dependence of those parameters, where (a) , (b) , (e) and are directly related with the local structure of supercurrent around a single flux line, whereas others are with the morphology of the FLL. It is inferred from the behavior of (Fig. 4c) that a strong long-range distortion occurs over a field range of 2–4 T, where the FLL structure undergoes transformation between triangular and square lattice. The anomalous enhancement of observed in Fig. 4a is probably due to the artifact associated with this distortion; the reduced chi-square exceeds 1.5 around 3 T while it is typically 1.2–1.4 for T or 4 T (see Fig. 4f). Similar scattering of the parameter value is also noticeable in , , and over the relevant field range, which may represent the systematic uncertainty due to the distortion. However, except for these anomalies, we can observe a clear trend in all of the parameters. Namely, exhibits a gradual increase with increasing magnetic field below T (which we discuss below in more detail), while tends to decrease slightly at lower fields and levels off above T. The behavior of , which to some extent represents that of the effective vortex core radius, is commonly found in various superconductors, which is attributed to the stronger overlapping of supercurrents around vortex center and intervortex transfer of quasiparticles.Sonier:04 The magnitude of at lower field is in good agreement with the Ginzburg-Landau coherence length, Å deduced from the relation [with (2 K) being assumed to be 22 T]. As is anticipated from the SANS result, exhibits a steep change from 60∘ to 90∘ around 2–3 T. The behavior is qualitatively in good agreement with the prediction of the non-local model (solid curveKogan:97a ; Kogan:97b , where the critical field is assumed to be 3 T). Thus, it indicates that the anisotropic flow of the supercurrent due to the nonlocal effect is the primary origin of the square-lattice formation at higher fields. The magnitude of (), which should be regarded as a lower boundary considering the fact that it is reduced by an averaging over a varying symmetry axis,Kogan:97a is considerably larger than that observed in V3Si (–),Sonier:04b suggesting a stronger anisotropy in the Fermi surface. The spin relaxation due to the random local distortion () exhibits a gradual decrease with increasing field: this is qualitatively understood as a result of stronger overlap of flux lines at higher field that makes less room for flux lines to deviate away from the regular position. Unfortunately, the SANS data are available only up to 5 T due to experimental conditions, and therefore the origin of the weak anomaly around 5.5 T (see Fig. 4c) is not identified at this stage.
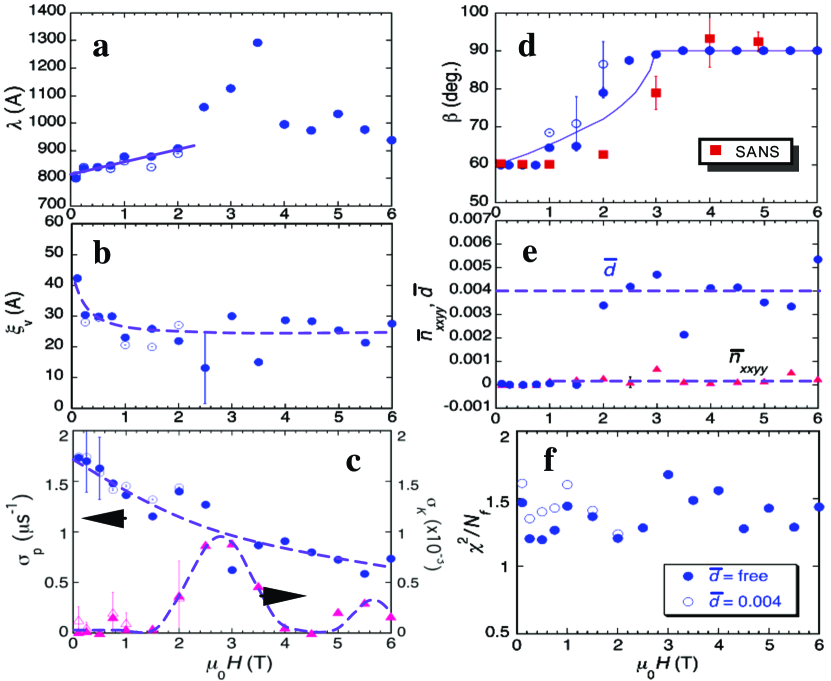
It is Interesting to note that the anisotropy parameter is sharply reduced to zero below 2 T: a similar behavior is reported for V3Si.Sonier:04b As shown in Fig. 4f, a comparative analysis with fixed to 0.004 ( an average for T) yields systematic increase of chi-squares, while little variation is found for other parameters. This is attributed to an additional cusp in (see Fig. 3) corresponding to the saddle points relatively near the vortex cores where is influenced by the squared shape of supercurrent flow. Our result indicates that the field profile over the field range of hexagonal FLL may be better described by the isotropic London model.
Now, we discuss the origin of gradual increase of in Fig. 4a. Our systematic study on the magnetic field dependence of in various superconductors indicates that the gradient () provides information on the low energy quasiparticle excitations.Kadono:04 In the mixed state, the quasiparticle momentum is shifted by the flow of supercurrent around the vortices due to a semi-classical Doppler shift, leading to a shift of the quasiparticle energy spectrum to an amount . When the superconducting order parameter has a nodal structure or anisotropy (including multi-gap), the Cooper pairs with a gap energy of less than can be broken by the Doppler shift,Volovik:93 ; Nakai:04 leading to an enhancement of . Using a normalized magnetic field, , we can express the field dependence of ,
| (3) |
where is the dimensionless parameter to represent the gradient (the magnitude of pair breaking effect). Since that is determined by the superfluid density, , the reduction of due to the Doppler shift would lead to the increase of . A fitting analysis of the data in Fig. 4a by Eq.(3) below 2 T yields with Å, where the result is shown by a solid line in Fig. 4a. Considering that no clear evidence is reported for the presence of nodes in the order parameter, the situation in Nb3Sn is close to the case of MgB2 where a similar trend of with was observed.Ohishi:03 Since SR measurements are made at finite temperature (), the Cooper pairs having the energy near the gap minimum (or a smaller gap) would be susceptible to excitation due to the Doppler shift when .Nakai:04 Interestingly, an earlier report on electronic Raman scattering experiment suggests a relatively strong gap anisotropy (%) in Nb3Sn, whereas no such anomaly seems to exist for V3Si.Dierker:83 Meanwhile, a very recent specific heat measurement in Nb3Sn demonstrated the presence of residual excitation below , which they attributed to a double-gapped order parameter with meV.Guritanu:04 Our result is another, yet microscopic evidence for the anisotropic (or multi-gapped) -wave pairing for the order parameter of Nb3Sn. The anisotropy of the Fermi surface revealed by FLL transformation may be related with the structure of the order parameter. Further study using the techniques sensitive to gap anisotropy would be helpful to determine the gap structure in full detail.
In summary, we have obtained detailed mapping of the local magnetic field in the mixed state of Nb3Sn using SR and SANS, from which we extracted fundamental length scales of superconductivity. Unlike V3Si, the field-induced enhancement of the effective penetration depth strongly suggests that the order parameter in Nb3Sn has a structure, either anisotropic or multi-gapped.
We would like to thank the staff of TRIUMF for their technical support during the SR experiment. This work was partially supported by a Grant-in-Aid for Scientific Research on Priority Areas and a Grant-in-Aid for Creative Scientific Research from the Ministry of Education, Culture, Sports, Science and Technology of Japan.
References
- (1) B. T. Matthias et al., Phys. Rev. 95, 1435 (1954).
- (2) B. T. Matthias et al., Phys. Rev. 139, A1501 (1965).
- (3) L. R. Testardi, Rev. Mod. Phys. 47, 637 (1975).
- (4) M. Weger and I. B. Goldberg, in Solid State Physics: Advances in Research and Applications, Vol. 28, 2 (Academic, New York, 1973).
- (5) P. B. Allen, in Dynamical Properties of Solids, Vol. 3, 95 (North-Holland, Amsterdam, 1980).
- (6) R. Mailfert et al., Phys. Lett. 24A, 315 (1967).
- (7) G. Shirane et al., Solid State Commun. 9, 397 (1971).
- (8) J. D. Axe and G. Shirane, Phys. Rev. B 8, 1965–1977 (1973).
- (9) M. Yethiraj et al., Phys. Rev. Lett. 82, 5112 (1999).
- (10) C. E. Sosolik et al., Phys. Rev. B 68, 140503(R) (2003).
- (11) V. G. Kogan et al., Phys. Rev. Lett. 79, 741 (1997).
- (12) V. G. Kogan et al., Phys. Rev. B 55, R8693 (1997).
- (13) J. E. Sonier et al., Phys. Rev. Lett. 93, 017002 (2004).
- (14) G. E. Volovik, Pis’ma Zh. Eksp. Teor. Fiz. 58, 457 (1993) [JETP Lett. 58, 469 (1993)].
- (15) R. Kadono, J. Phys.: Condens. Matt. 16, S4421 (2004).
- (16) Y. Fujii et al., Phys. Rev. B 25, 364 (1982).
- (17) K. Ohishi et al., J. Phys. Soc. Jpn. 72, 29 (2003).
- (18) E. H. Brandt, Phys. Rev. B 37, R2349 (1988).
- (19) V. Fesenko et al., Physica C 211, 343 (1993).
- (20) D. K. Christen et al., Physica 135B, 369 (1985).
- (21) K. Ohishi et al., Phys. Rev. B 65, 140505 (2002).
- (22) R. Kadono et al., Phys. Rev. B 63, 224520 (2001).
- (23) J. E. Sonier, J. Phys.: Condens. Matter 16, S4499 (2004).
- (24) N. Nakai et al., Phys. Rev. B 70, 100503(R) (2004).
- (25) S. B. Dierker et al. Phys. Rev. Lett. 50, 853 (1983).
- (26) V. Guritanu et al., Phys. Rev. B 70, 184526 (2004).