Superconducting properties of Tl-doped PbTe
Abstract
Tl-doped PbTe (Pb1-xTlxTe) is an anomalous superconductor with a remarkably high maximum value given its relatively low carrier concentration. Here, we present results of systematic measurements of superconducting parameters for this material, for Tl concentrations up to . We find that it is a Type II, weak-coupled BCS superconductor in the dirty limit and discuss implications for the applicability of the charge Kondo model recently proposed to account for superconductivity in this system.
pacs:
74.70.Dd, 74.25.BtI Introduction
Tl-doped PbTe (Pb1-xTlxTe) is a degenerate semiconductor with a small carrier concentration of holes/cm3 or less. However, for Tl concentrations beyond a critical value it is observed to superconduct,Matsushita et al. (2005) with a maximum of 1.5 K for the highest Tl concentrations,Nemov and Ravich (1998) comparable to more metallic systems. Furthermore, thallium is the only impurity known to cause superconductivity in PbTe, even though other impurities are able to dope to similar carrier concentrations and similar densities of states. Given the anomalously high maximum value, combined with the unusual concentration dependence, there has been considerable discussion as to the role that the Tl impurities play in the superconductivity of this material.Moizhes and Drabkin (1983); Schuttler et al. (1989); Hirsch and Scalapino (1985); Krasin’kova and Moizhes (1991); Dzero and Schmalian (2005)
PbTe has a rocksalt structure and has been treated with reasonable success using ionic models (i.e., Pb2+Te2-).Weiser (1981) Thallium impurities substitute on the Pb site, and calculations have shown that Tl+ is more stable than Tl3+ in the PbTe lattice.Weiser (1981) This implies that Tl impurities will act as acceptors, and indeed Hall measurements confirm that for small doping levels the hole concentration increases by one hole for every Tl impurity.Kaidanov and Ravich (1985); Dzero and Schmalian (2005) Carrier freeze-out is not observed to the lowest temperatures, indicating that the dopant atoms do not behave as hydrogen-like impurities due to the large static dielectric constant of the host PbTe.Dornhaus et al. (1983) However, for concentrations beyond a characteristic value the Hall number is observed to rise at a much slower rate with and does not increase beyond cm-3,Matsushita et al. (2005); Matsushita et al. (unpublished) suggesting that the additional impurities act in a self-compensating manner. Significantly, within the uncertainty of these measurements, this characteristic concentration is the same as , the critical concentration required for superconductivity. It is remarkable that as is increased beyond , rises linearly over two orders of magnitude from 15 mK for to 1.5 K for , while the hole concentration varies by less than a factor of two.
This behavior, combined with the absence of any detectable magnetic impurities in the diamagnetic susceptibility, has been interpreted as evidence that the Tl impurities are present in a mixed valence state composed of a mixture of both Tl+ and Tl3+ valences for . We recently argued that anomalies in the normal state resistivity of Tl-doped PbTe, that are present only for superconducting samples () and not for nonsuperconducting samples (),Matsushita et al. (2005); Fisher et al. (2005) might be associated with a charge Kondo effect involving these degenerate Tl valence states. Within such a scenario, the quantum valence fluctuations associated with the Tl impurities also provide a possible pairing mechanism for holes in the valence band of the host PbTe.Dzero and Schmalian (2005)
In light of the anomalous behavior of Tl-doped PbTe we have investigated the superconducting properties of single crystal samples for a range of Tl concentrations up to the solubility limit of approximately 1.5. In this paper, we present measurements of the heat capacity and and the resulting estimates for coherence length, penetration depth, Ginzburg-Landau parameter, and critical fields. Our measurements show that the material is a Type II, weak-coupled BCS superconductor in the dirty limit. We discuss implications of these observations for the charge Kondo model.
II Sample preparation and experimental methods
Single crystals of Pb1-xTlxTe were grown by an unseeded physical vapor transport method. Polycrystalline source material was synthesized by combining PbTe, Te, and either Tl2Te or elemental Tl in appropriate ratios and sintering at 600∘C, regrinding between successive sintering steps. For the crystal growth, broken pieces of source material were sealed in an evacuated quartz ampoule and placed in a horizontal tube furnace held at 750∘C for 7–10 days. A small temperature gradient of approximately 1–2∘C/cm allowed crystals to nucleate and grow at one or both of the cooler ends of the ampoule. Each vapor growth produced several well-formed crystals up to a few millimeters in size that could be cut and cleaved to prepare bars for thermodynamic and transport measurements. The thallium content was measured by Electron Microprobe Analysis (EMPA) using PbTe, Te, and Tl2Te standards. Errors in Tl content shown in subsequent figures reflect the uncertainty of the microprobe method for such low dopant concentrations. The Tl concentration for individual samples was observed to be homogeneous within the uncertainty of this measurement.
The heat capacity of single crystal samples was measured using a thermal relaxation technique in a Quantum Design Physical Property Measurement System. Crystals with a mass of approximately 10–15 mg were prepared with a flat surface for good thermal contact to the sample platform. Measurements were made in zero applied field and in a field (typically = 0.5–1 T). The field was oriented at an arbitrary angle to the crystal axes, depending on the orientation of the flat surface.
The upper critical field was measured for several values of the Tl content by following resistive transitions as a function of temperature for different applied magnetic fields. The resistivity was measured using geometric bars cleaved from the larger as-grown crystals, such that the current flowed along the [100] direction while the magnetic field was oriented parallel to the equivalent [001] direction. Electrical contact was made using Epotek H20E silver epoxy on sputtered or evaporated gold pads and showed typical contact resistances of 1–4 . Resistivity measurements were made at 16 Hz and with current densities in the range of 25 mA/cm2 (corresponding to a current of 100 A for low-temperature measurements) to 1 A/cm2 at higher temperatures. To check for heating effects, resistivity data were taken for different current densities and for warming and cooling cycles for each sample.
III Results
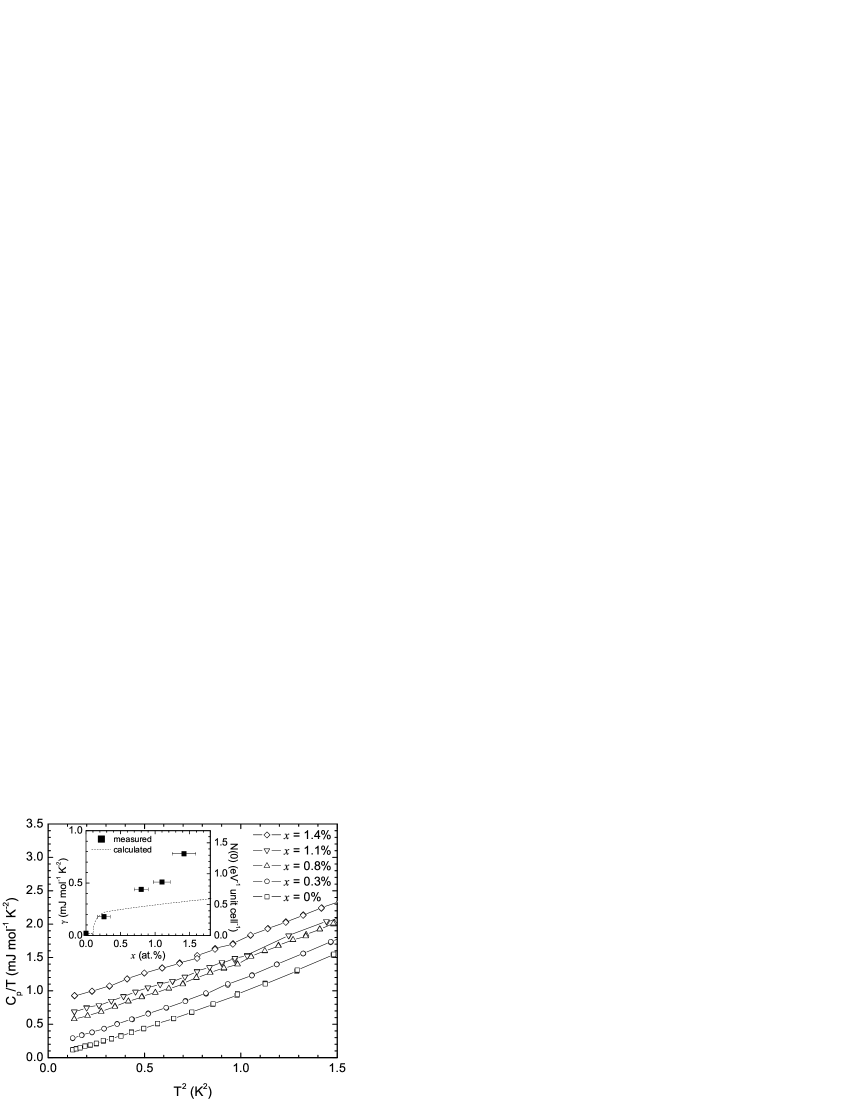
Heat capacity data for representative Tl concentrations are shown in Fig. 1 as versus for applied fields that totally suppress the superconductivity. For all samples there is considerable curvature in the data even at low temperatures, presumably due to the relatively low Debye temperature of PbTe. Data were fit to from the base temperature (0.3 K) up to 1 K. From , where J/(mol K) and for PbTe, we estimate K for , which is consistent with previous reports.Ravich et al. (1970); Chernik and Lykov (1981a) Thallium substitution does not substantially affect this value but causes a clear increase in the electronic contribution , suggesting a rapid rise in the density of states with . Values of obtained from the above fits are shown in the inset to Figure 1 as a function of Tl concentration and are in broad agreement with previously published values for polycrystalline samples.Chernik and Lykov (1981b)
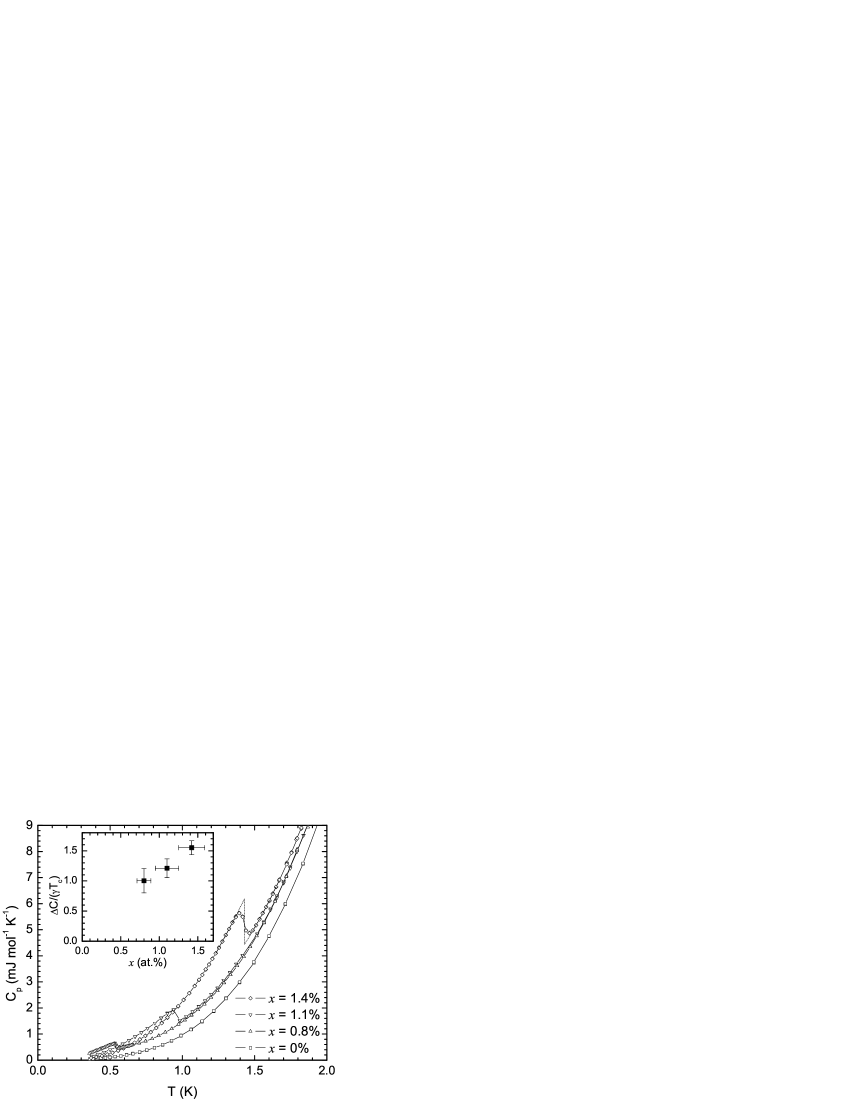
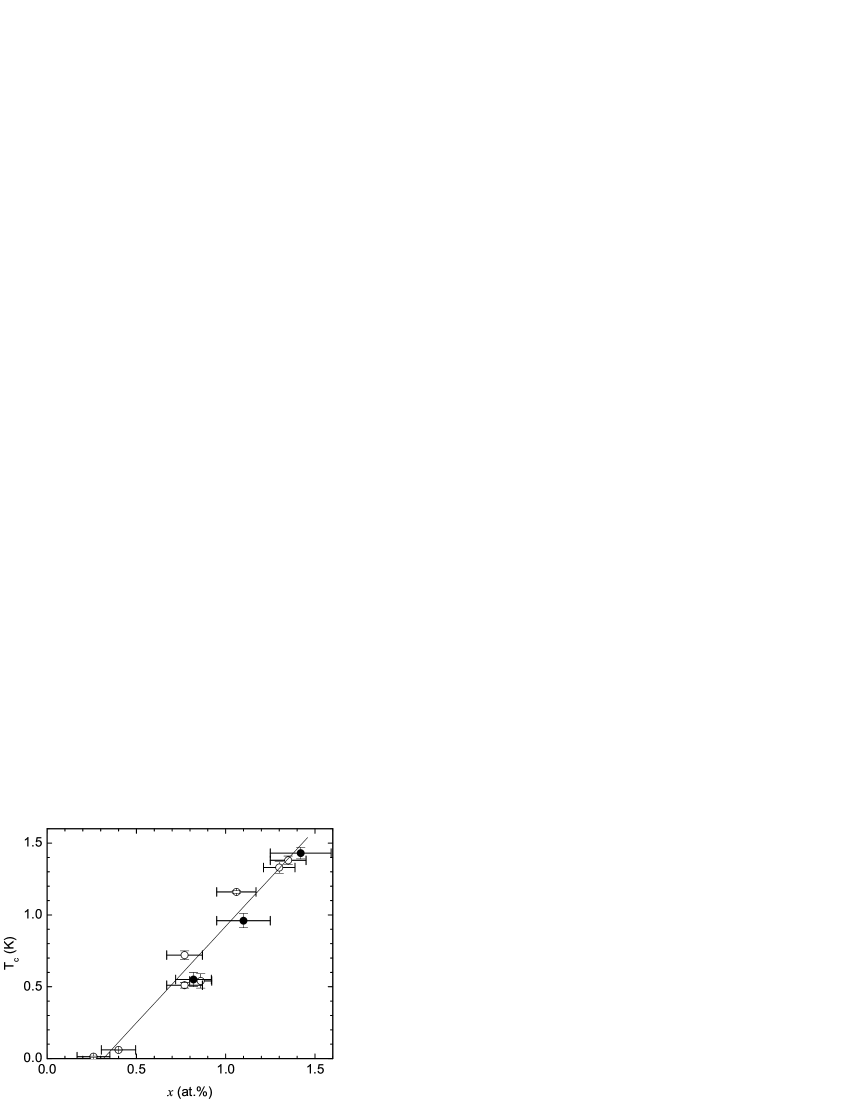
Heat capacity data in zero field are shown in Figure 2 for representative Tl concentrations with above 0.3 K. values were obtained from the midpoint of the heat capacity anomaly and agree well with data obtained from resistive transitions (Figure 3). The jump at , , can be estimated using a standard geometric construction extrapolating normal state and superconducting state behaviors towards , as indicated by dashed lines for = 1.4 in Figure 2. Resulting estimates of are shown in the inset to Figure 2 as a function of Tl concentration . The value for the highest Tl concentration, = 1.4, is = 1.55 0.12, which is close to the weak coupling BCS result of 1.43. As is reduced, the data show a small but significant systematic variation, tending towards a smaller value for smaller Tl concentrations. The smallest value, 1.00 0.20, is recorded for , which is the lowest Tl concentration for which we can confidently extract given the base temperature of our instrument.
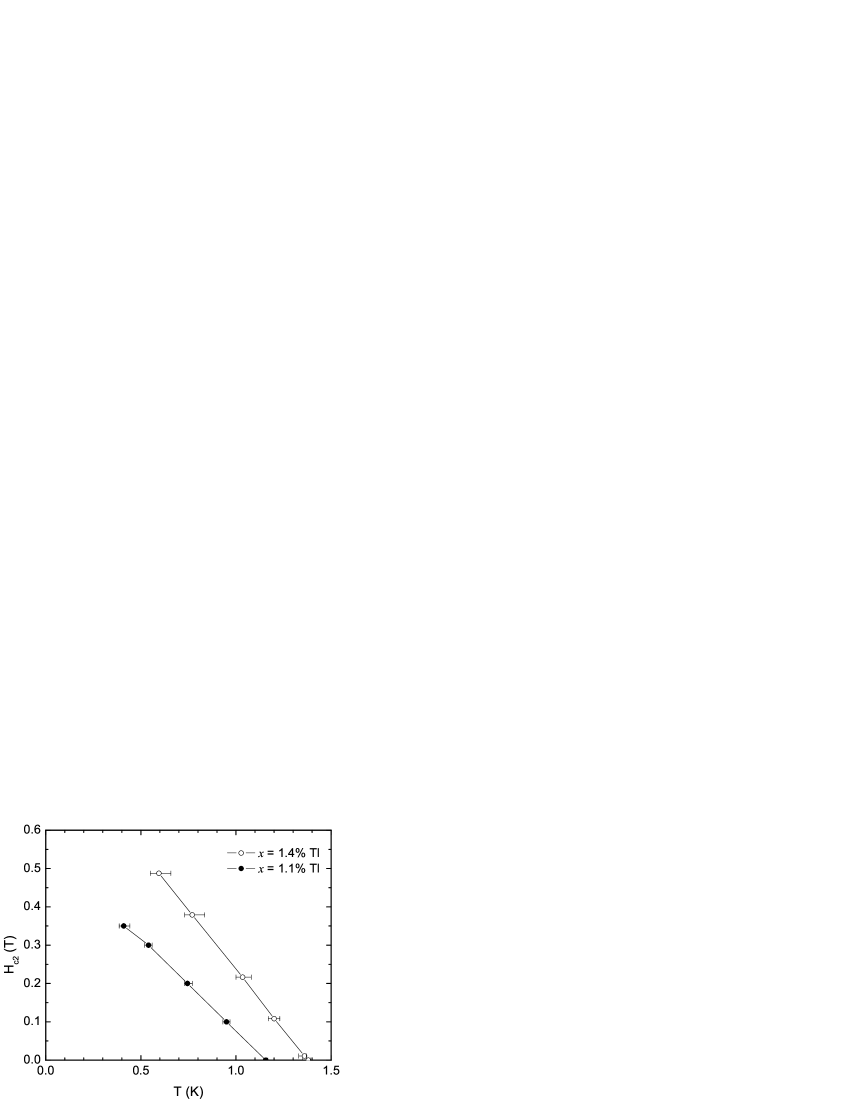
The upper critical field was determined from resistivity measurements for several Tl concentrations. Representative data, showing the uniform suppression of the superconducting transition in an applied field, are shown in Fig. 4 for = 1.4. An estimate of was obtained from the midpoint of the resistive transition for each applied field. Resulting curves are shown in Fig. 5 for = 1.1 and 1.4. Error bars indicate the width of the superconducting transition measured by the difference in temperature between and of the resistive transition. The upper critical field at zero temperature can be estimated from these data using the Werthamer-Helfand-Hohenberg approximation Werthamer et al. (1966)
| (1) |
Resulting values for = 1.1 and 1.4 are approximately 3900 Oe and 6000 Oe respectively (Table 1) and are consistent with reasonable extrapolations of the lowest temperature data in Fig. 5. The errors in listed in Table 1 are estimated from the difference between the above approximation and a parabolic fit to the observed data.

Superconducting parameters such as the coherence length and penetration depth are dependent on the electron mean free path , where is the Fermi velocity and is the hole mobility. From Hall effect measurements at 1.8 K, we find that the Hall number is cm-3 for and for .Matsushita et al. (unpublished) Combining these data with measured values of the residual resistivity,Matsushita et al. (2005) we find the hole mobility is approximately 100 cm2V-1s-1 for and 60 cm2V-1s-1 for . Taking into account the existence of both light and heavy holes at the and points in the Brillouin zone respectively,111The valence band maximum is centered at the points of the Brillouin zone and consists of relatively light holes characterized by and [R. Dornhaus, G. Nimtz, and B. Schlict, Narrow-Gap Semiconductors, vol. 98 of Springer Tracts in Modern Physics (Springer-Verlag, New York, 1983)]. Small deviations from nonparabolicity can be safely ignored in estimating approximate values for the Fermi level. Somewhat less is known of the secondary band maximum centered at the points in the Brillouin zone. Reasonable estimates were reported close to with an anisotropy of 10 [B. F. Gruzinov, I. A. Drabkin, and Yu. I. Ravich, Sov. Phys. Semicond. 13, 315 (1979)]. These holes are substantially more massive and therefore dominate the density of states. In estimating the Fermi energy and other electronic parameters from Hall effect measurements, we have assumed that the band offset (170 meV) does not vary with . we assume the elastic scattering limit holds at low temperatures such that . The Fermi level then lies in the range 190–210 meV below the top of the valence band. Consequently, average values of are m/s for the holes and m/s for the holes. The resulting values for are listed in Table 1. The principle contribution to the uncertainty in this quantity arises from errors in the geometric factor used to calculate resistivity of samples. Propagation of this error is the dominant effect in the uncertainties of subsequent derived quantities, including and .
The Ginzburg-Landau coherence length is calculated from by
| (2) |
where T m2. Estimates for are 290 Å for and 240 Å for (Table 1) and should be independent of orientation for this cubic material. The small values of implies that the material is in the dirty limit with . Therefore, the intrinsic coherence length can be extracted from the approximation , where the values are listed in Table 1. In comparison, the BCS expression for is
| (3) |
where the BCS value of is 0.18. Using values of derived from the dirty limit approximation, we find estimated from this formula (given in Table 1) is between those calculated separately for the and holes. This is consistent with a mixed contribution from both carrier types due to the substantial scattering implied from the short mean free path.
The London penetration depth for two carrier types is given by
| (4) |
where the superfluid densities and are approximated as the carrier densities for each carrier type, and and are the effective masses of each band. The corresponding values of are listed in Table 1 and are almost independent of orientation. In the dirty limit, we can estimate the effective penetration depth from
| (5) |
values of which are given in Table 1. These estimates are in good agreement with microwave conductivity measurements that show m for .Ormeno et al. (private communication) Finally, we find the Ginzburg-Landau parameter using and estimate and from the relationships and (Table 1).
| at. | at. | |
|---|---|---|
| 1.16 0.01 K | 1.38 0.03 K | |
| 0.39 0.04 T | 0.60 0.07 T | |
| 32 8 Å | 19 5 Å | |
| 290 15 Å | 240 14 Å | |
| 2600 700 Å | 3000 850 Å | |
| m/s | m/s | |
| 1600 80 Å | 1500 120 Å | |
| 1.4 0.4 m | 1.9 0.5 m | |
| 48 12 | 79 20 | |
| 57 14 Oe | 54 13 Oe | |
| 3 0.8 Oe | 2 0.5 Oe |
IV Discussion
The above results indicate that Tl-doped PbTe is a Type II, BCS superconductor in the dirty limit, which is not too surprising given that the material is a doped semiconductor. To a large extent this observation rules out the possibility of more exotic scenarios for the superconductivity, such as condensation of preformed pairs, at least for the highest Tl concentrations. Here, we discuss some implications for the charge Kondo model that we have previously proposed for this material and consider alternative explanations. First, we briefly reiterate the salient features of the charge Kondo model relevant to understanding these data.
The idea of a charge Kondo effect associated with degenerate valence (charge) states of a valence-skipping element was first discussed by Taraphder and Coleman,Taraphder and Coleman (1991) and was later re-examined in the limit of dilute impurities for the case by Dzero and Schmalian.Dzero and Schmalian (2005) Weak hybridization of these degenerate impurity states with conduction electrons (or in the case of Tl-doped PbTe, with valence band holes), results in a Kondo-like effect with various parallels to the more common magnetic case. Here, the pseudospins correspond to zero or double occupancy of an impurity orbital, which can be described in terms of a negative effective . The degeneracy of the two valence states in PbTe is not accidental but emerges naturally from the doping effect of the Tl impurities themselves.Dzero and Schmalian (2005) For values of the chemical potential less than a characteristic value , the impurities are all present as one valence (Tl+), which act to dope the material. As more impurities are added, eventually a value of the chemical potential is reached for which the two valence states are degenerate, and at which value the chemical potential is then pinned.Dzero and Schmalian (2005) The resulting charge Kondo effect, if present, clearly requires that hybridization between the impurity states and the host material is relatively weak. The semiconducting nature of the host PbTe would naturally provide an environment in which the local density of states at the impurity sites is rather small.
Now, we discuss the origin of the enhanced electronic contribution to the heat capacity seen in Figure 1. The density of states at the Fermi energy, , can be estimated from the linear term in the heat capacity. The resulting values of are shown on the right axis of the inset to Figure 1. Part of the observed enhancement can be attributed to band filling effects, since the Hall number continues to rise slowly with even for .Matsushita et al. (unpublished) However, as has been discussed elsewhere,Chernik and Lykov (1981b) the observed heat capacity is larger than expected from the band structure of PbTe alone (dashed line in the inset to Fig. 1), implying the presence of additional states associated with the Tl impurities. Within the charge Kondo model, the additional contribution would arise from the Abrikosov-Suhl resonance that develops at for temperatures below . If this is the case, then in principle we can estimate the concentration of Kondo impurities using the crude approximation ln2 per mole of impurities. Unfortunately, uncertainty in the band parameters describing the band21 means that it is difficult to confidently extract the magnitude of the additional contribution to the heat capacity over and above the band-filling effect. Nevertheless, we can make a rough estimate to at least put limits on the applicability of this model. Using the measured Hall coefficient,Matsushita et al. (unpublished) published band parameters,21 and the assumption that the band offset does not change with Tl doping, the band contribution to can be estimated as shown by the dashed line in the inset to Fig. 1. For , the observed is 0.46 mJ molK-2 larger than the expected band contribution. If this enhancement is due to Kondo physics, then for K (the value estimated in Ref. Matsushita et al., 2005 for ), the concentration of Kondo impurities is approximately cm-3. In comparison, = 1.4 corresponds to a Tl concentration of cm-3. Hence, if a charge Kondo description is appropriate for this material, and if the Kondo temperature is K, then only a small fraction () of the Tl impurities are contributing to this effect. Within the charge Kondo model outlined above, this would imply that the Tl impurities in PbTe must be characterized by a range of values, such that only the subset of impurities for which have degenerate valence states.
There are other observations that appear to support this tentative conclusion. As we had previously noted,Matsushita et al. (2005) the magnitude of the resistivity anomaly is also less than what would be expected if all of the Tl impurities were contributing to the Kondo effect. Data for lower Tl concentrations, for which a reasonable fit of the low-temperature data can be made over an extended temperature range, indicated that approximately 1 of the Tl impurities contribute to the Kondo behavior.Matsushita et al. (2005) This is in broad agreement with the value deduced above from the heat capacity enhancement. In addition, the Hall number is observed to continue to rise for ,Matsushita et al. (unpublished) implying that the chemical potential is not pinned at one precise value, but rather is slowed in its progress as increases, also consistent with a distribution of values.
Invoking Kondo physics of course implies a temperature dependence to the enhancement of for temperatures above . Our measurements (Fig. 1) show that the enhancement to is temperature independent for temperatures between 0.3 K and 1 K. However, uncertainty in this difference grows rapidly at higher temperatures due to the increasingly large phonon contribution to the heat capacity. As a result, we cannot unambiguously extract the temperature dependence of any heat capacity enhancement beyond the estimated Kondo temperature of 6 K.
Within a BCS scenario, varies exponentially with , where is the pairing interaction. Figure 6 shows ln() versus for samples with . For samples with K, both parameters were extracted from the same physical crystal. However, for samples with a lower critical temperature, was determined from resistivity measurements on different crystals from the same growth batch, introducing additional errors due to uncertainty in the Tl concentration. As can be seen, ln() scales approximately linearly with within the uncertainty of the measurements. For a constant , this would imply that the observed trend in with (Fig. 3) is due to the increasing density of states (inset to Fig. 1). However, the situation is less clear if the charge Kondo picture is applicable, in which case depends strongly on the Tl concentration,Dzero and Schmalian (2005) and the enhancement in derives from Kondo physics. In the case of a superconductor with magnetic impurities, although is enhanced by this effect, the superconductivity is nevertheless suppressed for due to the pair-breaking effect associated with the rapid fluctuations in the magnetic moment.Maple et al. (1972); Muller-Hartmann and Zittartz (1971) In the case of the charge Kondo model, the situation is slightly more complex because the impurities now provide both a local pairing mechanism as well as a pair-breaking effect close to . Consequently, the range of temperatures over which it is anticipated that will be suppressed is predicted to be much lower than ,Dzero and Schmalian (2005) in contrast to the case of magnetic impurities. Hence, for the case , the superconductivity can in principle benefit from the enhancement in due to the charge Kondo effect in a way that it cannot for magnetic impurities. The observed trend shown in Fig. 6 may reflect this effect, but it is difficult to obtain quantitative estimates of the relative contributions to from the enhancement in and the pairing interaction itself in this crossover regime of .Dzero and Schmalian (2005)

In the charge Kondo model, if is large compared to , then the pseudospin moment is unscreened at , in which case the superconductivity is born from preformed pairs. In this limit, one would anticipate a much smaller anomaly in the heat capacity than the BCS result of 1.43. As noted in Section III, this is clearly not the case for the highest Tl concentrations, consistent with our previous observation that for this material.Matsushita et al. (2005) However, it is difficult to understand the observed dependence of within this same picture. Since decreases with decreasing (Fig. 3), one would expect the superconductivity to become more BCS-like at lower Tl concentrations. Instead, we find that becomes substantially smaller as is reduced (inset to Figure 2). Experiments are in progress to measure the heat capacity of samples with yet smaller Tl concentrations to even lower temperatures to see whether this trend continues.
Could the superconductivity in Tl-doped PbTe have its origin in more mundane physics after all? While the data presented here enable us to characterize this material as a BCS superconductor, they do not allow us to distinguish between different pairing mechanisms. As we have previously argued,Matsushita et al. (2005) many aspects of the observed thermodynamic and transport properties are suggestive of charge Kondo physics. Moreover, the uniqueness of the Tl impurities, being the only dopant to cause superconductivity in this material, cannot be ignored. Nevertheless, in the absence of experiments directly probing the Tl valence (which are currently in progress), we cannot rule out less exciting possibilities, including the formation of a narrow impurity band with a relatively large density of states. In such a case, the pairing interaction would most likely be phonon mediated, though the substantial residual resistance might argue that strong Coulomb scattering also plays a role. The observed low-temperature resistivity anomaly would then presumably have its origin in some form of weak localization, though the temperature and field dependence of this feature appear to argue against such a scenario.Matsushita et al. (2005)
V Conclusions
In summary, we have shown that Tl-doped PbTe is a Type II, BCS superconductor in the dirty limit. None of these observations is in disagreement with the charge Kondo model previously described, though they do put some limitations on its applicability. Specifically, the relatively small enhancement of the electronic contribution to the heat capacity implies that if a charge Kondo description is appropriate then only a small fraction of the Tl impurities can be participating in the Kondo physics. Within the model described in Ref. Dzero and Schmalian, 2005, this can be understood in terms of a distribution of * values, such that only a subset of the Tl impurities have both valence states exactly degenerate for a particular value of the chemical potential within this range, though this has yet to be experimentally verified.
Acknowledgements.
We gratefully thank J. Schmalian, M. Dzero, M. R. Beasley, and B. Moyzhes for numerous helpful discussions. We also acknowledge Robert E. Jones for technical assistance with EMPA measurements and A. T. Sommer for help with Hall effect measurements. This work is supported by the DOE, Office of Basic Energy Sciences, under contract number DE-AC02-76SF00515. I. R. F was also supported by the Alfred P. Sloan and Terman Foundations.References
- Matsushita et al. (2005) Y. Matsushita, H. Bluhm, T. H. Geballe, and I. R. Fisher, Phys. Rev. Lett. 94, 157002 (2005).
- Nemov and Ravich (1998) S. A. Nemov and Y. I. Ravich, Phys. Usp. 41, 735 (1998).
- Moizhes and Drabkin (1983) B. Y. Moizhes and I. A. Drabkin, Sov. Phys. Solid State 25, 1139 (1983).
- Schuttler et al. (1989) H. B. Schuttler, M. Jarrell, and D. J. Scalapino, Phys. Rev. B 39, 6501 (1989).
- Hirsch and Scalapino (1985) J. E. Hirsch and D. J. Scalapino, Phys. Rev. B 32, 5639 (1985).
- Krasin’kova and Moizhes (1991) M. V. Krasin’kova and B. Y. Moizhes, Sov. Phys. Solid State 33, 202 (1991).
- Dzero and Schmalian (2005) M. Dzero and J. Schmalian, Phys. Rev. Lett. 94, 157003 (2005).
- Weiser (1981) K. Weiser, Phys. Rev. B 23, 2741 (1981).
- Kaidanov and Ravich (1985) V. I. Kaidanov and Y. I. Ravich, Sov. Phys. Usp. 28, 31 (1985).
- Dornhaus et al. (1983) R. Dornhaus, G. Nimtz, and B. Schlicht, Narrow-Gap Semiconductors, vol. 98 of Springer Tracts in Modern Physics (Springer-Verlag, New York, 1983).
- Matsushita et al. (unpublished) Y. Matsushita, A. T. Sommer, T. H. Geballe, and I. R. Fisher (unpublished).
- Fisher et al. (2005) I. R. Fisher, Y. Matsushita, H. Bluhm, and T. H. Geballe, Proc. SPIE 5932, 59321Y (2005).
- Ravich et al. (1970) Y. I. Ravich, B. A. Efimova, and I. A. Smirnov, Semiconducting Lead Chalcogenides (Plenum Press, New York, 1970).
- Chernik and Lykov (1981a) I. A. Chernik and S. N. Lykov, Sov. Phys. Solid State 23, 817 (1981a).
- Chernik and Lykov (1981b) I. A. Chernik and S. N. Lykov, Sov. Phys. Solid State 23, 2062 (1981b).
- Werthamer et al. (1966) N. Werthamer, E. Helfand, and P. Hohenberg, Phys. Rev. 147, 295 (1966).
- Ormeno et al. (private communication) R. J. Ormeno, P. J. Baker, and C. E. Gough (private communication).
- Taraphder and Coleman (1991) A. Taraphder and P. Coleman, Phys. Rev. Lett. 66, 2814 (1991).
- Maple et al. (1972) M. B. Maple, W. A. Fertig, A. C. Mota, L. E. Delong, D. Wohlleben, and R. Fitzgerald, Solid State Commun. 11, 829 (1972).
- Muller-Hartmann and Zittartz (1971) E. Muller-Hartmann and J. Zittartz, Phys. Rev. Lett. 26, 428 (1971).