Contact-less measurements of Shubnikov-de Haas oscillations in the magnetically ordered state of CeAgSb2 and SmAgSb2 single crystals
Abstract
Shubnikov - de Haas oscillations were measured in single crystals of highly metallic antiferromagnetic SmAgSb2 and ferromagnetic CeAgSb2 using a tunnel diode resonator. Resistivity oscillations as a function of applied magnetic field were observed via measurements of skin depth variation. The effective resolution of p allows a detailed study of the SdH spectra as a function of temperature. The effects of the Sm long - range magnetic ordering as well as its electronic structure (-electrons) on the Fermi surface topology is discussed.
pacs:
71.18.+y, 72.30.+q, 75.50.Cc, 75.50.EeI Introduction
Measurements of quantum oscillations in the resistivity (Shubnikov - de Haas effect (SdH)) and in the magnetization (de Haas - van Alphen effect (dHvA)) are among the primary experimental techniques to study the geometry of Fermi surfaces in metals shoenberg ; kartsovnik . Although both originate from the basic physics of Landau quantization of electron orbits in a magnetic field, the coupling of electron motion to resistivity is different from that of magnetization. Electron transport depends on the density of states and the scattering rates, both modulated by the Landau quantization. Within a standard theory shoenberg for a three-dimensional Fermi surface the amplitude of the harmonic oscillatory part of magnetization is given by kartsovnik ,
| (1) |
where is the cyclotron mass, is the extremal cross-section of the Fermi surface (FS), is a measure of the FS curvature along at the extremal cross-section, and the damping factors , , and are caused by finite temperature, scattering and Zeeman splitting, respectively. The corresponding fundamental frequency is
| (2) |
On the other hand, the amplitude of Shubnikov - de Haas oscillations in electrical resistivity is proportional to
| (3) |
with the same damping factors as for dHvA effect. Typically, oscillations of resistivity are more difficult to measure, especially in highly conducting samples. The problem is worse for small single crystals where attaching the contacts is not an easy task. It should be noted that the SdH amplitude dependence on the is reciprocal to the dHvA amplitudes: , so for small , the relative amplitude of the SdH oscillations is suppressed.
The alternative to direct transport measurements is to measure the skin depth. This paper describes the use of highly sensitive tunnel-diode oscillator technique for the quantitative study of quantum oscillations in metallic samples. The technique is especially useful for small samples when attachment of contacts is difficult. Detailed analysis of the raw data is presented.
II The technique
An oscillating magnetic field of frequency penetrates a metallic sample, decaying in a typical length , the skin depth. In the local limit, where , is given by the normal skin effect expression jackson ,
| (4) |
where is resistivity and is magnetic permeability. Unfortunately, typical AC magnetometers are not sensitive enough to measure this depth with sufficient precision. In addition, for typical low-frequency magnetometers (up to kHz frequencies), skin depth is too large compared to the small crystal size. For higher-frequency techniques, such as microwave or infrared reflectivity and absorption, the anomalous skin effect and possible dynamic effects (e.g. magnetic relaxation) take place. Although the anomalous skin effect was originally used to study Fermi surfaces pippard , in the extreme anomalous limit the skin effect is no longer determined only by the resistivity, but also by the electronic mean free path, . The skin depth then depends on a product , which is independent of the scattering rate and cannot be used for contact-less measurements of resistivity.
In this work, a self-resonating, tunnel diode driven LC circuit was used for precise measurements of the effect of temperature and magnetic field on the skin depth of CeAgSb2 and SmAgSb2. The circuit had a natural oscillation frequency of MHz. Originally, this technique was developed to measure London penetration depth in small superconducting crystals, where its great sensitivity was a key factor. Details of the apparatus and calibration are given elsewhere prozorov ; prozorov2 . Tunnel diode resonators have been used for qualitative studies of the skin depth oscillations in pulsed magnetic fields in organic superconductors with relatively large normal-state resistivities ( ) choi ; coffey . Although little quantitative analysis was reported, these studies demonstrate the effectiveness of the technique.
When a metallic sample is inserted into a coil which is part of an LC circuit the resonant frequency changes from to . This change is caused by two effects: the diamagnetic skin effect, which screens the alternating magnetic field from the bulk of the sample and the magnetic permeability of the sample. The measured frequency shift is given by the total dynamic magnetic susceptibility of the sample, prozorov ,
| (5) |
where is the effective sample dimension (for an infinite slab of width , ) and skin depth is given by Eq.(4). The maximal expulsion frequency, , (frequency shift in the limit of a perfect conductor with ) depends only on the geometry of the sample and parameters of empty resonator and is given by
| (6) |
where is the sample volume, is the effective coil volume and is the demagnetization factor prozorov . In deriving Eq.(5) it is assumed that , which is always the case in our frequency and sample size range (the base frequency is approximately Hz, whereas typical Hz). The factor in Eq.(5) comes from the direct magnetic contribution of magnetic permeability in the skin layer via , which enters the total magnetic moment after integration over the sample volume. A similar effect was discussed before for superconductors, cooper . However, the direct contribution of magnetic permeability in the samples under study is minor. This is because we obtain useful information only well below the ordering temperature and in high magnetic fields where . The oscillating part of the permeability is small due to very small excitation field, mOe. In addition, magnetic field only penetrates the skin depth layer and its direct contribution to the total susceptibility is attenuated by the factor of compared to the skin effect contribution. In other magnetic systems with large polarizability or in the vicinity of the magnetic ordering temperature, direct magnetic contribution could be important, but this is not relevant to the present work.
Obviously, the described technique is sensitive only as long as the skin depth is less than the effective sample size. For larger skin depth (larger resistivity), the sample becomes transparent to an oscillating magnetic field. For example, in our particular setup in actual units,
| (7) |
With small crystals of typical size of m, we can roughly estimate the upper limit where the described technique is sensitive. By equating , we obtain . Measurements on samples with larger resistivities are possible, but require larger samples or higher frequencies (both of which are possible). At the opposite extreme for samples with very small resistivities, the limitation is the anomalous skin effect, which becomes relevant when skin depth becomes smaller than the electronic mean free path, , and the local version of the Ohm’s law is no longer valid. We can roughly estimate the lower threshold of resistivity below which anomalous skin effect takes place by using a Drude approximation for which the mean free path is given by
| (8) |
where is the electron density and is the electron charge. Therefore, using Eq.(4) we obtain at which ,
| (9) |
For a typical nonmagnetic metal with m-3 and our frequency, Hz, we obtain cm. Therefore, our method allows direct quantitative study of (contact-less) resistivity in small crystals approximately in the range of cm, which covers most metallic materials of interest. Furthermore, the difficulty of measuring small highly conducting samples by conventional means turns to be an advantage for the data analysis. In the regime of good metals, the data is significantly simplified, because the term in Eq.(5) becomes relevant only for . In the samples discussed below, the resistivity varies between , for which and therefore, we can simply use the linear version of Eq.(5).
| (10) |
It should be noted that it is still straightforward to invert full equation Eq.(5) to obtain the skin depth numerically.
In the measurements reported below, slab - shaped samples were positioned inside the resonant coil on a sapphire sample holder. The crystallographic axis was parallel to both the AC excitation and DC magnetic fields. In this arrangement, screening currents flowed in the plane and therefore the in-plane component of the resistivity was measured. A typical run was from to Tesla DC field and back to T with about data points taken in each leg. Various ramp rates where used with the slowest being G/s.
III Samples
In this work, the skin depth was measured in two isostructural tetragonal intermetallic compounds: CeAgSb2 and SmAgSb2 single crystals. Both materials (and related compounds) were studied before brylak ; sologub ; myers1 ; myers2 ; jobiliong , though with much more attention to CeAgSb2 which undergoes a ferromagnetic transition along the axis below K. SmAgSb2 is antiferromagnetic with K. Transport and magnetic properties, including direct measurements of dHvA and SdH effects were reported previously myers1 ; myers2 ; jobiliong . Whereas SdH in CeAgSb2 showed a single dominant frequency at MG, in SmAgSb2 the behavior is much more complex with several frequencies and significant difference between dHvA and SdH spectra. One difference between CeAgSb2 and SmAgSb2 is substantially larger scattering rates in the former (as evident from ). Also, as we show below, small changes in the Fermi level lead to significant changes of the Fermi surface structure and appearance of new extremal orbits.
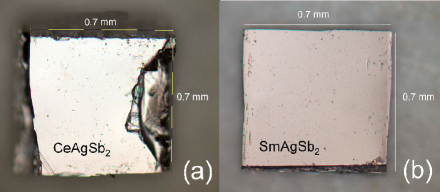
Single crystals of CeAgSb2 and SmAgSb2 were grown out of Sb flux canfield ; myers1 . The starting materials were placed in an alumina crucible and sealed under vacuum in a quartz ampule, heated to 1150 ∘C, and then cooled to 670 ∘C over 120 hours. The best crystals with the cleanest surface were selected and cut with a blade along the sides for the measurements. The samples are shown in Fig. 1. The c-axis was perpendicular to the largest face. The residual resistivity ratio, was determined by standard four-point measurements. For SmAgSb2 we obtained and for CeAgSb2 . The transport measurements were performed on bar-shaped samples from the same batches that were used for resonator measurements, shown in Fig.1.
IV Results
Figure 2 shows resistivity versus temperature obtained from the frequency shift by using Eq.(5) and (4). The skin depth is shown in the inset. The high-temperature (at K) resistivity data was used to normalize the calibration constant, . Direct calibration with known parameters of the oscillator produce very similar temperature dependence, but the offset (residual resistivity) cannot be obtained from this technique, because it only measured the relative frequency change. However, this is only beneficial for the present study, as we are only interested in changes of resisivity in a magnetic field and are not sensitive to static resistivity background.
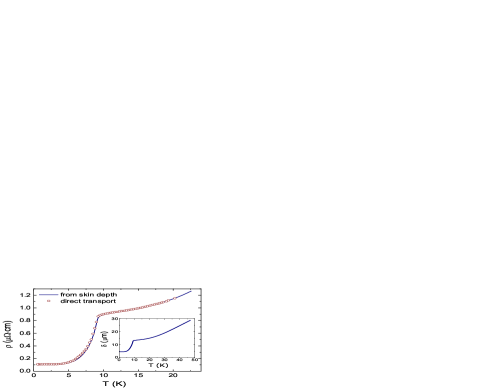
As expected, due to an increase of spin-disorder and phonon scattering, the resistivity sharply decreases below . The reconstructed resistivity (solid line) is compared to direct four-point measurements performed on the sample from the same batch. Evidently, the quantitative agreement is good. Similarly, a good agreement was obtained for measured in various applied magnetic fields where the magneto-resistance followed a Kohler rule as described in detail in Ref.myers1 .
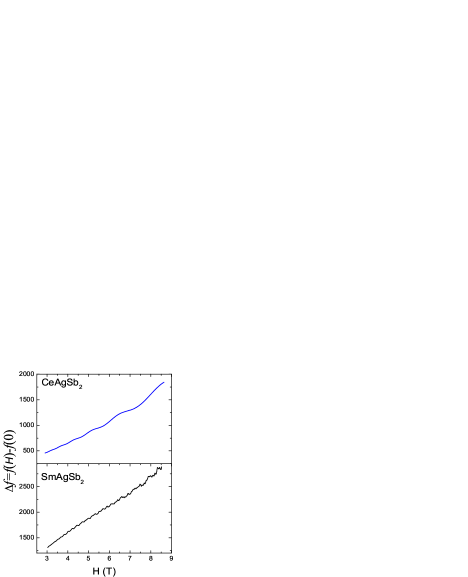
The oscillations of resistivity were obtained from the measured oscillations in the skin depth, which in turn were obtained from the oscillating frequency shift. An example of the raw data for both, CeAgSb2 and SmAgSb2 are shown in Fig. 3 in the top and bottom panels, respectively.
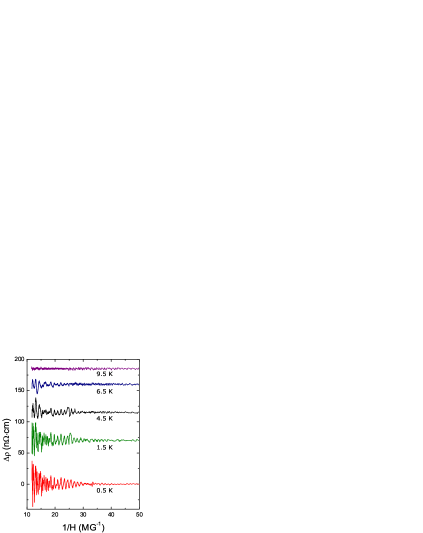
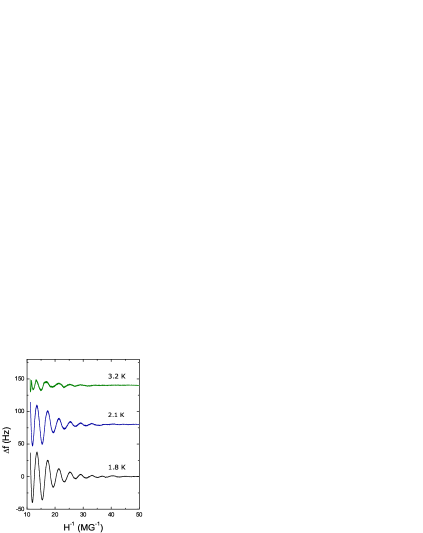
For SmAgSb2 the resistivity oscillations reconstructed from the frequency shift are shown as a function of in Fig. (4). A smooth background was subtracted using non-oscillating piecewise cubic hermite interpolating polynomial algorythm in Matlab. The amplitude of the oscillations diminishes for temperatures approaching the Neél temperature from below, as anticipated from the increasing spin disorder scattering evident from Fig.2.
Power spectra were obtained from the oscillations by using a Fourier transformation. The result is shown in Fig.(5). At a first glance, the spectra are quite similar to those reported from the previous direct measurements of the SdH oscillations myers2 . However, closer inspection reveals additional details, most likely due to higher sensitivity of our measurements.
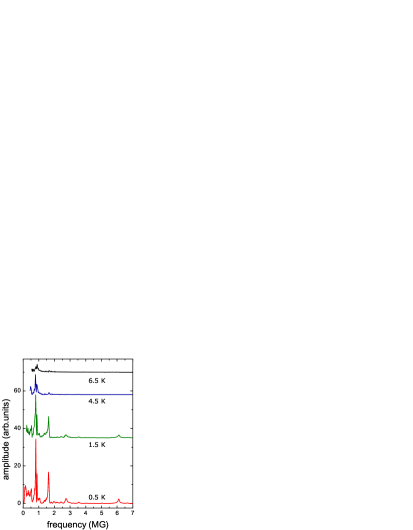
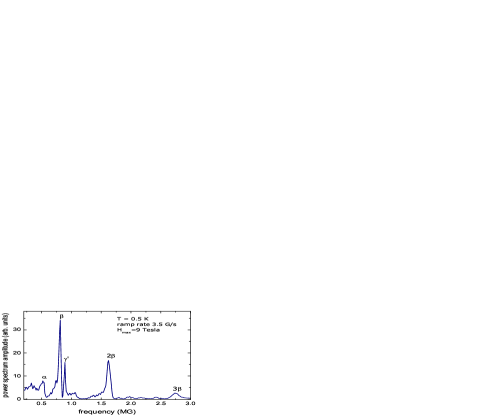
Figure (6) shows low-frequency detailed spectrum of oscillations obtained at K. In addition to previously observed main peak, there is a sharp adjacent peak at 0.9 MG, which was apparently unresolved in previous direct measurements, at least down to 1.8 K. This new peak is not a secondary combination of and peaks and we attribute it to the orbit shown below in Fig. 11 (a).
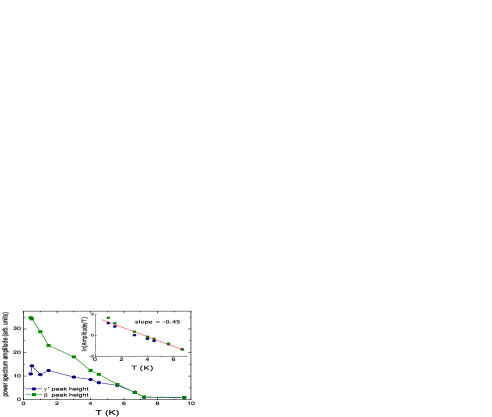
Since our measurements are quantitative, it is possible to plot temperature dependence of the observed peaks. Figure (7) demonstrates that these dependencies are quite different. The peak is suppressed much more rapidly. Both peaks vanish as the Neél temperature is approached.
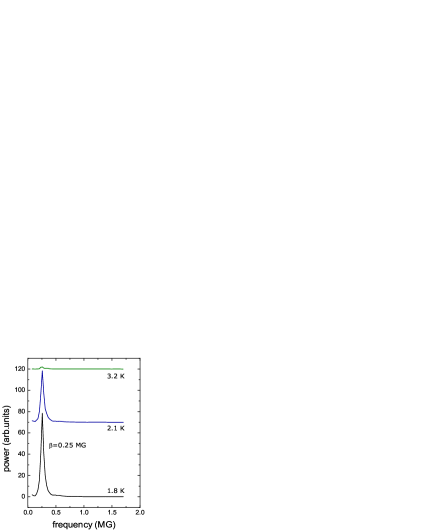
In principle, we cannot rule out the influence of de Haas - van Alphen oscillations of magnetization (via term in Eq. (5)), however additional features observed in our data are not seen in the measured dHvA spectra and, conversely, we do not see the strongest peaks of the dHvA oscillations. Instead, we see all SdH peaks and resolve additional features. In addition, deep inside magnetically ordered state and in high fields is close to unity. The oscillatory part is a response to very small excitation field superimposed on very large DC field. To further explore applicability of the developed technique and rule out unexpected nonlinear or magnetic effects, we also measured CeAgSb2, which is isostructural to SmAgSb2, but showed a well-resolved, single frequency SdH oscillation of MG myers2 . Figure 8 shows the result of our measurements at various temperatures below . Clearly, we observe a single frequency oscillations at 0.25 MG.
A typical smallest oscillation amplitude of measured resonant frequency was about Hz (Figure 8) whereas our resolution is better than Hz. We therefore are able to measure samples at least times smaller than used here (depending on their resistivity and surface quality).
Figure 9 shows power spectra for the SdH oscillations, which is similar to these reported previously myers2 ; jobiliong . The amplitude of oscillations decreased with the increasing temperature much more rapidly compared to SmAgSb2. This decrease, however, is very similar to recent measurements of SdH effect in the same compound where signal vanishes just above K jobiliong .
V Discussion
The difference in relative amplitudes between dHvA and SdH oscillations is not surprising and is determined by the effective mass via (see Eqs.1 and 3). The temperature dependence of the amplitude of the SdH oscillations in CeAgSb2, Fig.8, allows us to roughly estimate the effective mass associated with this orbit to be . From Fig. 7 an estimate of the effective mass of the new orbit in SmAgSb2 below , between K and K, gives an approximate value of , close to the effective mass of the neighboring orbit evaluated in a similar temperature/field range and to the value for a orbit in LaAgSb2 myers2 . This low value also explains the substantial difference between amplitudes of SdH and dHvA effects.
The results of electronic structure calculations of the two nonmagnetic (NM) compounds from the family RAgSb2 where R=Y and La were discussed previously by Myers et al. myers2 . It was assumed that substitution of Y or La for rare-earth element should not significantly change the electronic structure near the Fermi energy, , because 4f electrons are strongly localized. Observation of additional frequencies in SmAgSb2 was explained by the smaller residual resistivity and possible change of the Fermi surface produced by the new periodicity due to antiferromangetic ordering myers2 . In this paper we revisit that assumption and calculate the bandstructure specifically for the SmAgSb2 using the tight-binding, linear muffin-tin orbital (TBLMTO) method within the atomic sphere approximation (ASA) TBLMTO1 ; TBLMTO2 . The local density approximation parametrization due to von Barth and Hedin BHXC of the spin-density functional has been used and the states were treated as core states.
Since the spin structure in the AFM ordered state has not been experimentally determined, we assume the simplest configuration with magnetic moments of the two Sm3+ ions (in configuration) in the unit cell pointing in the opposite directions. Such a configuration has an energy lower by K/cell compared to the ferromagnetically ordered state. In order to estimate the Neél temperature, , we can use the Heisenberg model. The calculated in the mean-field approximation is equal to , where is the effective exchange parameter and it corresponds to the sum of the interactions of one magnetic moment with all others. Using the information about and the assumption that the only nonzero interaction corresponds to the nearest neighbors, we obtain the expression for . The estimated K is in reasonable agreement with Neél temperature of 9.5 K observed in the compound.
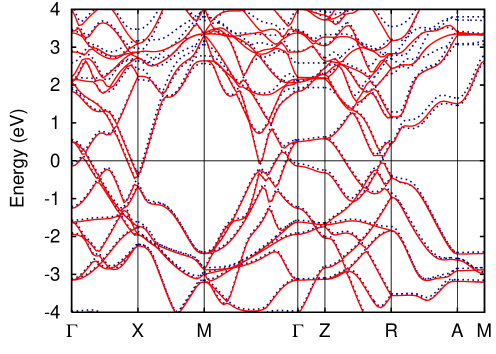
Figure 10 shows the electronic structure of SmAgSb2 along several high-symmetry directions. The assumed AFM ordering (bands shown by dashed lines) lifts the degeneracy in some symmetry directions. However, such modification of the electronic structure does occur for the bands crossing Fermi level. Hence, almost all the difference between the Fermi surfaces of antiferromagnetic SmAgSb2 and nonmagnetic YAgSb2 myers2 is a downshift of the Fermi level position compared to the band labeled in Ref. myers2 . This shift of leads to the modification of nearly spherical FS sheet (band ) centered at a point, which is transformed into a torus as shown in Fig. 11 (a) with frequency of MG for -axis for the internal circle orbit , close to the frequency of MG of an orbit labeled in Figure (6) of the second band.
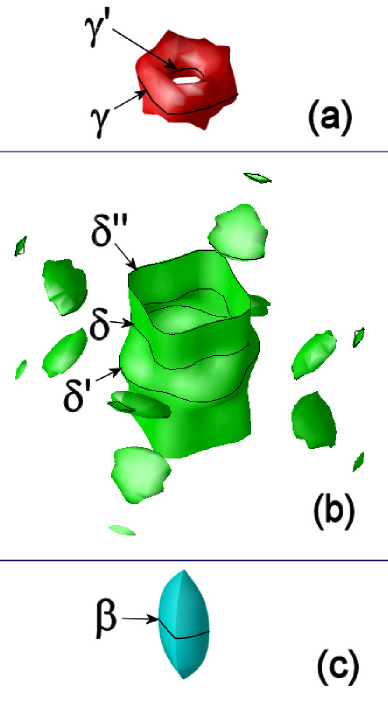
Another FS sheet which changes significantly corresponds to band and is shown in Fig. 11 (b). Band is also centered at a point. In addition to mostly cylindrical part with axis along as in YAgSb2, eight pillow-shaped segments now appear around the main cylinder with the frequency of the orbit equal to MG. We therefore conclude that previously unresolved peak (closest to ) in SmAgSb2 is determined by the orbit. The appearance of this orbit is caused by the shift of position with respect to band compared to YAgSb2 where this orbit is absent. This shift is produced by filling states in Sm3+ by five electrons that lead to a slight change of the d-band occupancy compared to Y-based compound.
In conclusion, a high resolution method for contact-less measurements of the resistivity via normal skin depth was developed to probe Shubnikov-de Haas oscillations in small metallic samples. Torque measurements can be used to obtain de Haas- van Alphen oscillations and presented technique can be applied to the same small samples to obtain Shubnikov-de Haas signal without modifying the samples (to attach contacts). The application of the method was demonstrated on RAgSb2 system. Fine details of the oscillation spectrum (a new orbit) was resolved experimentally and explained with refined bandstructure calculations.
Acknowledgements.
We thank Bruce N. Harmon for useful discussions. Ames Laboratory is operated for the U.S. Department of Energy by Iowa State University under Contract No. W-7405-ENG-82. This work was supported in part by the Director for Energy Research, Office of Basic Energy Sciences. R.P. acknowledges support from the Alfred P. Sloan Foundation.References
- (1) D. Shoenberg, ”Magnetic oscillations in metals”, Cambridge University Press (1984).
- (2) M. V. Kartsovnik, Chem. Rev. 104, 5737-5781 (2004).
- (3) J. D. Jackson, Classical Electrodynamics (John Wiley & Sons, Inc., New York, 1998), p. 220.
- (4) A. B. Pippard, Phil. Tranc. Roy. Soc. A250, 325 (1957).
- (5) R. Prozorov, R. W. Giannetta, A. Carrington, and F. M. Araujo-Moreira, Phys. Rev. B 62, 115-118 (2000).
- (6) R. Prozorov, R. W. Giannetta, A. Carrington, P. Fournier, R. L. Greene, P. Guptasarma, D. G. Hinks, and A. R. Banks, Appl. Phys. Lett. 77, 4202-4204 (2000).
- (7) E. S. Choi, E. Jobilong, A. Wade, E. Goetz, J. S. Brooks, J. Yamada, T. Mizutani, T. Kinoshita, and M. Tokumoto, Phys. Rev. B 67, 174511/(1-8) (2003).
- (8) T. Coffey, Z. Bayindir, J. F. DeCarolis, M. Bennett, G. Esper, and C. C. Agosta, Rev. Sci. Inst. 71, 4600-4606 (2000).
- (9) J. R. Cooper, Phys. Rev. B 54, R3753 (1996).
- (10) M. Brylak, M. H. Moeller, and W. Jeitschko, J. Sol. Stat. Chem. 115, 305 (1995).
- (11) O. Sologub, H. Noeel, A. Leithe-Jasper, P. Rogl, and O. I. Bodak, J. Sol. St. Chem. 115, 441 (1995).
- (12) K. D. Myers, S. L. Bud’ko, I. R. Fisher, Z. Islam, H. Kleinke, A. H. Lacerda, and P. C. Canfield, J. Mag. Mag. Mater. 205, 27 (1999).
- (13) K. D. Myers, S. L. Bud’ko, V. P. Antropov, B. N. Harmon, P. C. Canfield, and A. H. Lacerda, Phys. Rev. B 60, 13371 (1999).
- (14) E. Jobiliong, J. S. Brooks, E. S. Choi, H. Lee, and Z. Fisk, Phys. Rev. B 72, 104428/1 (2005).
- (15) P. C. Canfield and Z. Fisk, Philos. Mag. B 65, 1117 (1992).
- (16) O. K. Andersen, Phys. Rev. B 12, 3060 (1975).
- (17) O. K. Andersen, O. Jepsen, Phys. Rev. Lett 53, 2571 (1984).
- (18) U. von Barth and L. Hedin, J. Phys. C 5, 1629 (1972).