The disordered flat phase of a crystal surface- critical and dynamic properties
Abstract
We analyze a restricted SOS model on a square lattice with nearest and next–nearest neighbor interactions, using Monte Carlo techniques. In particular, the critical exponents at the preroughening transition between the flat and disordered flat (DOF) phases are confirmed to be non–universal. Moreover, in the DOF phase, the equilibration of various profiles imprinted on the crystal surface is simulated, applying evaporation kinetics and surface diffusion. Similarities to and deviations from related findings in the flat and rough phases are discussed.
pacs:
68.35Rh, 68.55.Jk, 05.10.LnA new type of crystal surface, the disordered flat (DOF) phase, has been introduced by den Nijs and Rommelse almost twenty years ago. RdN ; dNR ; dN It is characterized by finite height fluctuations, although it comprises a disordered array of steps, thereby combining features of the, conventional, flat and rough phases. Experimental evidence for a DOF phase has been reported, for instance, for films of rare gas atoms on graphite and for GaAs(001). Youn ; Weichman ; Ding
A minimal model to describe the DOF phase has been proposed by Rommelse and den Nijs. RdN It is a restricted SOS, or RSOS, model on a square lattice with interactions connecting pairs of nearest and next–nearest lattice sites, with the Hamiltonian
| (1) |
where is the integer–valued height at site . The absolute value of the height difference is restricted to be at most one for neighboring sites, and, thence, at most two for next–nearest neighbors. is the Kronecker symbol. The interaction between next–nearest neighbors, , is assumed to be positive.
The phase diagram of the Hamiltonian (1) in the –plane is depicted in Fig.1. It displays five distinct phases: The usual flat and rough phases, the reconstructed flat and rough phases arising from a repulsive, negative nearest–neighbor interaction, , as well as, finally, the DOF phase. The most intriguing aspects of the phase diagram are the disordered flat phase and the transition between the flat and the DOF phases, the preroughening transition. RdN
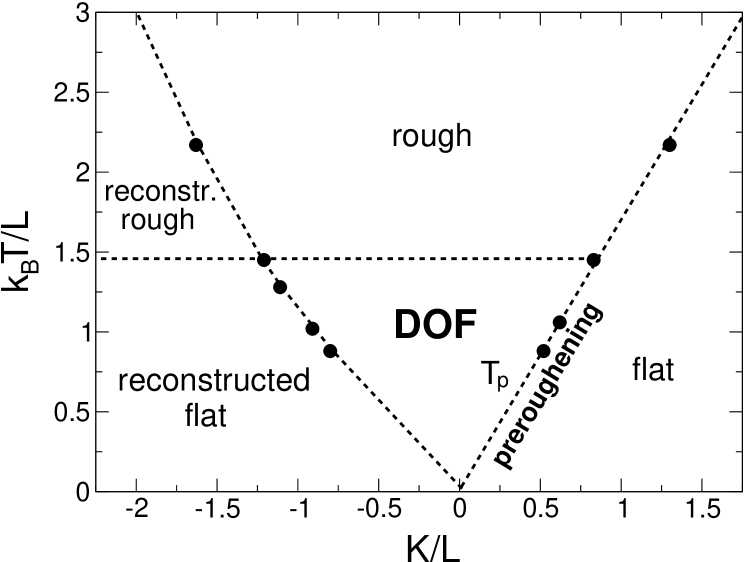
Similar phase diagrams have been obtained for related SOS as well as other models with short–range interactions dNR ; dN ; dN2 ; Mazzeo , including variants to describe fcc(110) surfaces. In the following, we shall first discuss critical properties at the preroughening transition and then dynamic properties of the DOF phase, analysing the minimal model (1). The findings are expected to be largely independent of details of the model.
To determine critical properties at the preroughening transition, we used Monte Carlo techniques, in particular, apart from the standard Metropolis approach, the Wang–Landau and the transition matrix algorithms. Wang ; Trans Square systems of size , with up to 64, have been simulated. Klaers Taking into account finite–size effects, we estimated standard critical exponents, namely those of the order parameter (the parity dNR ), , and its susceptibility, , as well as of the correlation length, , at = 1/8, 1/4, and 1/2, see Fig. 1.
Note that the preroughening transition temperature , at fixed ratio , may be obtained quite accurately by fitting the height fluctuations to the ansatz . Increasing , tends to zero in the flat and DOF phases, while it seems to approach at a non-vanishing value, with only minor finite–size dependences. Thence, the height fluctuations seem to diverge directly at the preroughening. The prefactor is estimated to be smaller than the characteristic value of a transition of Kosterlitz–Thouless type (which occurs, e.g., when going directly from the flat to the rough phase, see Fig. 1).Klaers . It is found to increase with , reaching, possibly, at the triple point between the flat, DOF, and rough phases.
The critical exponent is found to tend to increase with the ratio of the couplings from at =1/8 to at = 1/4, and then to at =1/2. The corresponding estimates for are , , and . For we obtain , , and . The rather unusual values of the critical exponents at the preroughening transition are in accordance with previous estimates dNR ; Mazzeo . Our findings confirm the non–universality of the preroughening transition dNR , with the critical exponents depending continuously on . Applying scaling laws, the critical exponent of the specific heat, , turns out to be strongly negative. Actually, from our simulational data, the specific heat appears to vary smoothly with temperature, preventing a direct estimate of .
Dynamic properties of the DOF phase have not been studied in much detail before, despite a wealth of theoretical and experimental analyses of morphological changes for flat and rough crystal surfaces. In fact, we are aware of only two studies on the equilibration of initially flat surfaces in the DOF phase, driven by evaporation kinetics, using either Monte Carlo techniques (studying the Hamiltonian (1) with ) or the renormalization group method. Dev ; Park
In these two studies, the time evolution of the height fluctuations has been analyzed .Dev ; Park For systems of sites, one defines , where denotes the average height. The height fluctuations have been observed and argued Dev ; Park to increase initially logarithmically in time, both in the rough and DOF phases of RSOS models. In the DOF phase, then the fluctuations decrease, and finally they approach the equilibrium value. In contrast, in the rough phase, the fluctuations grow monotonically before they eventually saturate, for finite .
We confirmed these findings, for and, in the DOF phase, (2.5 in the rough phase), with ranging from 16 to 256, using full periodic boundary conditions (previously Dev , helical boundary conditions had been employed). Klaers The initial height configuration is =0. To mimic evaporation kinetics, we apply the standard Metropolis Monte Carlo algorithm, attempting in each move to change, at a randomly chosen site , the height by . In addition to the previous work, we identified, at very early times, a diffusive behavior, with , due to uncorrelated height changes at randomly chosen sites. Of course, it seems doubtful that the logarithmic behavior of will prevail to arbitrarily long times in the DOF phase when studying larger and larger systems, as it may be the case in the rough phase.
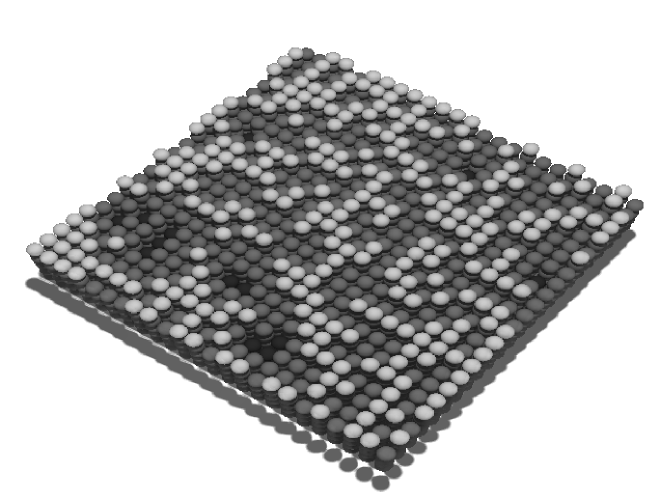
The time evolution of the surface may be visualized by monitoring Monte Carlo configurations. In the DOF phase, at early times, several clusters of different local average height, 1/2 or -1/2, are formed, with the height fluctuations growing logarithmically. In the clusters, the sites are, in a disordered fashion, predominantly at heights 0 and 1 or 0 and -1. The subsequent decrease in is due to the fact that one type of cluster, 1/2 or -1/2, prevails in the equilibrated DOF phase, see Fig. 2. Of course, with full periodic boundary conditions, the overall average height may eventually wander, tending to stick at neighboring half–integer values. This effect, with the entire surface undergoing a random walk, does not affect the height fluctuations.
To analyze more completely the dynamics in the DOF phase, we also studied the equilibration of various other one–dimensional profiles imprinted on the surface, in particular, steps, periodic gratings, and wires. Klaers There, the interplay of the orientation dependent surface tension and mobility Mullins ; Spohn leads to interesting morphological changes in the rough and flat phases, for evaporation kinetics as well as for surface diffusion, see pertinent reviews on theory and experiments. Pimpinelli ; Williams ; Giesen ; Bonzel
In the DOF phase, a step of monoatomic height may be introduced by fixing the average heights of the sites at two opposite boundaries to be, e.g., at 1/2 or 3/2, by setting the heights at these boundary sites alternately 0 and 1, or 1 and 2, respectively. The other two boundaries are connected by periodic boundary conditions. Square systems with sites are considered. Averaging over sites parallel to the fixed boundaries as well as over many, , realizations of the equilibration process, one obtains a one–dimensional height or step profile , with running from, say, to . At time , the height configuration is assumed to look like a checkerboard comprising heights 0 and 1 in the half of the surface next to the 1/2–boundary, and heights 1 and 2 in the other half. Then, for , and = 3/2 for , with a sharp step in between. As time proceeds, the step profile will start to broaden, see Fig. 3. In the flat and rough phases, the step width is known Giesen to grow asymptotically in time, and in the thermodynamic limit, , with a power law . The characteristic exponent depends on the transport mechanism and the type of phase. For instance, in the case of evaporation kinetics, is 1/2 in the rough and 1/4 in the flat phase, in the case of surface diffusion, is 1/4 in the rough and 1/6 in the flat phase.SelDux ; Einstein ; Blago ; SeSzHa ; Upton . may be determined from Monte Carlo data by monitoring the position of the step profile at fixed height. SeSzHa In that way, an effective exponent may be estimated, approaching the true value in the limits .
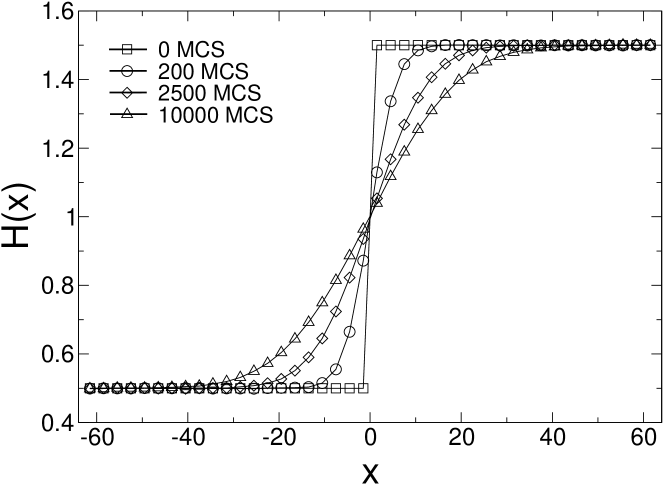
Typical simulated step profiles, applying evaporation kinetics, in the DOF phase are depicted in Fig. 3. Analysing such profiles, we obtain an effective exponent, for , approaching, from above, closely 1/2 in the rough phase. In the DOF phase (), the effective exponent also decreases monotonically with time, the data being well compatible with an asymptotic value , as in the flat phase. Surface diffusion may be mimicked in the simulations by attempting to, say, decrease the height at a randomly chosen site by one and to increase simultaneously the height at a neighboring site by one. For that dynamics, the effective is found to approximate nicely 1/4 in the rough phase, , and to approach 1/6 in the DOF phase, .
An interesting phenomenon occurs when periodic, one–dimensional gratings are imprinted on the surface. In the flat phase, the healing proceeds layer by layer, driven by an annihilation of the meandering steps bordering the top and bottom terraces of the grating. SelBie ; SelDux ; Ebner ; Erle ; Kandel ; Karim . To study the equilibration of gratings, especially in the DOF phase, we consider an initial profile of the form , i.e., a discretized sine function with amplitude A. Full periodic boundary conditions are employed for lattices of sites. We first shall present results on evaporation kinetics, with wavelength ranging from 32 to 512.
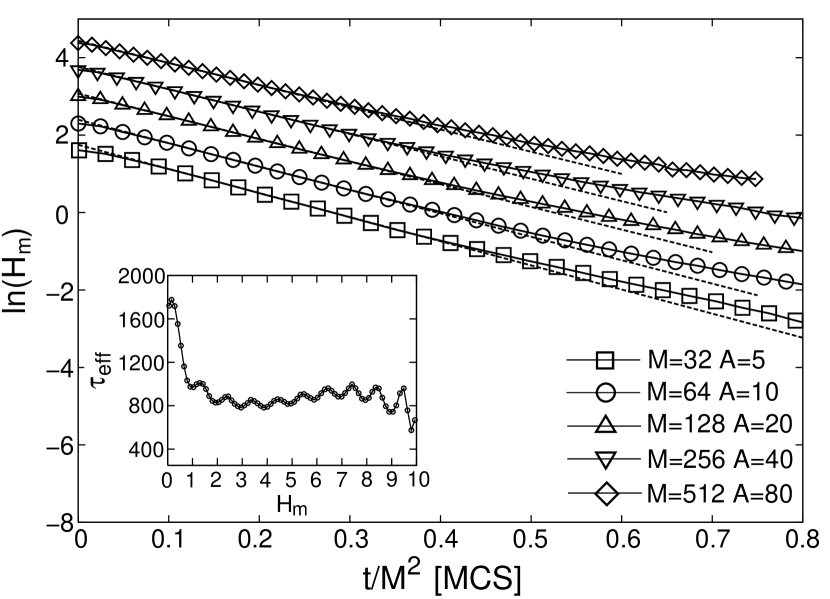
In the DOF phase, and, mostly, , the profile of the gratings is quite close to sinusoidal during the equilibration, showing, however, in the beginning a tendency towards a broadening near the extrema. The time dependence of the decay of the amplitude, , is illustrated in Fig. 4, studying profiles with fixed ratio . From this figure and other simulational data, we infer that the amplitude falls off at fairly early times approximately exponentially, , being the relaxation time, in accordance with the prediction of Mullins Mullins for the rough phase. In that time regime, is proportional to , also as predicted. Mullins However, as time goes on, in contrast to the behavior in the rough phase, a systematic deviation from the exponential decay occurs, with a significantly slower equilibration. When fitting there the decay to a power–law, the effective exponent depends both on time and the wavelength (fixing ), becoming lower for larger systems (in the largest system we studied, , we find an effective exponent of roughly to ). Note that one might be still rather far from a characteristic asymptotic temporal dependence. For comparison, in the flat phase, the equilibration is predicted Lancon to follow, at long times, . The deviation from the exponential form sets in at a larger amplitude for gratings with larger wavelength and larger initial amplitude , see Fig. 4. Indeed, that amplitude seems to grow like , with being about 5/4. Thence, we tend to conclude, that the theory of Mullins describes merely a transient behavior for gratings of finite wavelength in the DOF phase.
By inspection of Monte Carlo configurations during the relaxation, one observes the decay to proceed layer by layer. At a reference moment of time, the top (and bottom) terrace of the grating may display a flat disordered structure, with the sites being predominantly at the integer heights and , yielding an amplitude of approximately . The terrace is now bordered by two meandering steps, and the amplitude of the profile (as it follows from averaging over many realizations) may decrease fairly slowly, when time goes on. Eventually the two steps may touch each other, giving rise to islands of flat disordered structures on top of another flat disordered terrace of average height . The islands then shrink and dissolve quite quickly, associated with a rather fast decay of the amplitude. Thence, we expect two time scales, due to the meandering of the steps and the dissolving of islands, in accordance with previous simulational results on the equilibration of gratings in the flat phase. SelBie ; Ebner . Indeed, as exemplified in the inset of Fig.4, the two time scales lead to an oscillatory behavior in the effective relaxation time, , as a function of the amplitude . The pronounced increase of at small amplitudes corresponds to the onset of the slower, non–exponential decay, discussed above. In the rough phase, these oscillations tend to fade away, for obvious reasons.
In the case of surface diffusion, similar features hold. We set and = 0.7 in the DOF phase ( in the rough phase), with ranging from 3 to 6, and with ranging from 24 to 48. The equilibration proceeds on much longer time scales than in the evaporation case. First, as it is true for evaporation kinetics as well, the discretized initial configuration relaxes to a close–to–sinusoidal profile with disordered flat structures at the extrema. Then, still at early times, the decay is described well by an exponential time dependence, with the relaxation time being proportional to , in agreement with Mullins’ theory for surface diffusion in the rough phase. Mullins Eventually, as time goes on, in the DOF phase a slowing down sets in, like for evaporation–recondensation. A crossover from an exponential decay to a slower decay at larger times had been found before for surface diffusion in the flat phase, with the crossover time depending on temperature. Ebner
Finally, we studied the flattening of one–dimensional wire profiles. In the DOF phase, applying evaporation kinetics, the equilibration proceeds again layer by layer, driven by step annihilation at the disordered flat top terraces, accompanied by two time scales. Analogous features have been found before for the flat phase SelDux . The excess mass at the surface, due to the wire, changes with time, with the average height tending to approach a half–integer value. In contrast, in the rough phase, the excess mass is nearly conserved. In the rough phase, the amplitude of the wire approaches a decay , as predicted by the Mullins’ theory and already confirmed in previous simulations. To determine the asymptotic decay law in the flat SelDux and DOF phases, presumably wires with very large initial width and amplitude are needed, being beyond the reach and scope of the present study.
In summary, the preroughening transition is found to be non–universal. Dynamic properties in the DOF phase resemble partly ones observed in the flat phase, partly ones observed in the rough phase. They deserve to be studied in even more detail in the future.
References
- (1) K. Rommelse and M. den Nijs, Phys. Rev. Lett. 59, 2578 (1987).
- (2) M. den Nijs and K. Rommelse, Phys. Rev. B 40,4709 (1989).
- (3) M. den Nijs, Phys. Rev. Lett. 64, 435 (1990).
- (4) H. S. Youn, X. F. Meng, and G. B. Hess, Phys. Rev. B 48, 14556 (1993).
- (5) P. B. Weichman, P. Day, and D. Goodstein, Phys. Rev. Lett. 74, 418 (1995).
- (6) Z. Ding, D. W. Bullock, P. M. Thibado, V. P. LaBella, and K. Mullen, Phys. Rev. Lett. 90, 216109 (2003).
- (7) M. den Nijs, Phys. Rev. Lett. 66, 907 (1991).
- (8) G. Mazzeo, G. Jug, A. C. Levi, and E. Tosatti, Phys. Rev. B 49, 7625 (1994).
- (9) F. G. Wang and D. P. Landau, Phys. Rev. Lett. 86, 2050 (2001).
- (10) J. S. Wang and R. H. Swendsen, J. Stat. Phys. 106, 245 (2002).
- (11) J. Klärs, Diploma thesis, RWTH Aachen (2006).
- (12) P. Devillard, J. Phys. A 23, L929 (1990).
- (13) K. Park and B. Kahng, J. Phys. A 26, 2895 (1993).
- (14) W. W. Mullins, J. Appl. Phys. 30, 77 (1959).
- (15) H. Spohn, J. Phys. I (France) 3, 69 (1993).
- (16) A. Pimpinelli and J. Villain, Physics of Crystal Growth (Cambridge University Press, Cambridge, 1998).
- (17) H.-C. Jeong and E. D. Williams, Surf. Sci. Rep. 34, 171 (1999).
- (18) M. Giesen, Prog. Surf. Sci. 68, 1 (2001).
- (19) H. P. Bonzel, Phys. Rep. 385, 1 (2003).
- (20) W. Selke and P. M. Duxbury, Phys. Rev. B 52, 17468 (1995).
- (21) S. V. Khare and T. L. Einstein, Phys. Rev. B 57, 4782 (1998).
- (22) B. Blagojevic and P. M. Duxbury, Phys. Rev. E 60, 1279 (1999).
- (23) W. Selke, F. Szalma, and J. S. Hager, Comp. Phys. Commun. 147, 251 (2002).
- (24) P. J. Upton, Phys. Rev. E 73, 031601 (2006).
- (25) W. Selke and J. Oitmaa, Surf. Sci. 198, L346 (1988); W. Selke and T. Bieker, Surf. Sci. 281, 163 (1993).
- (26) Z. Jiang and C. Ebner, Phys. Rev. B 53, 11146 (1996).
- (27) J. Erlebacher, M. J. Aziz, E. Chason, M. B. Sinclair, and J. A. Floro, Phys. Rev. Lett. 84, 5800 (2000).
- (28) N. Israeli and D. Kandel, Phys. Rev. B 62, 13707 (2000).
- (29) A. Karim, M. Rusanen, I. T. Koponen, T. Als-Nissila, and T. S. Rahman, Surf. Sci. 554, L113 (2004).
- (30) F. Lancon and J. Villain, Phys. Rev. Lett. 64, 293 (1990).