Magnetic state dynamics in itinerant paramagnet UB2
( = Co, Ir) probed by 11B NMR
Abstract
We have carried out the 11B NMR measurement on the itinerant paramagnetic systems UB2 ( Co, Ir) to investigate the low-dimensional characteristics of the -electrons due to the structural anisotropy. The recent X-ray analysis suggests that UIr3B2 has a different structure modulated from the ever-known superlattice. The azimuth angle variation of NMR spectrum within the -plane clarified that B atoms occupy the single site, and a certain ligands arrangement surrounding B atom turns to the same orientation as the another one through the three- or six-fold rotation around the -axis. These results have been consistent with the X-ray proposition. To evaluate the temperature () development of general susceptibility (), Knight shift and nuclear spin-lattice relaxation rates measurements were performed and the similar variations of were identified in both UCo3B2 and UIr3B2. Above a crossover point defined as K, the evolution of is dominant at , suggesting that ferromagnetic correlations develop in high- regimes; meanwhile, below , the part in shows the saturation tendency, and a different class of dispersion at finite- suddenly emerges. This particular magnetic correlations are interpreted as the antiferromagnetic correlations, and notable feature of the magnetic state dynamics in low- regimes is that the antiferromagnetic correlations arise together with the ferromagnetic component at the same time. The unique magnetic correlations obtained from NMR experiment will be discussed by the possible low-dimensionality of UB2 lattice.
pacs:
71.20.Lp, 75.20.-g, 75.40.Gb, 76.60.-kI Introduction
The low-dimensional electron and spin systems have attracted much interest for a long decade, because these systems show a rich variety of physical properties. Highly anisotropic electron state and magnetic exchange lead a peculiar instability and quantum fluctuations. For example, in one-dimensional electron systems, insulating charge density wave arises due to the so-called Peierls instability of electron-phonon interaction,Peierls (1955) or otherwise the anomalous conducting phenomena due to the critical fluctuations is well-known as Tomonaga-Luttinger liquid.Tomonaga (1950); Luttinger (1963) Another representative example in spin systems will a resonating valence bond state on two-dimensional triangular lattice,Anderson (1973) and several experimental attempt to prove the theoretical predictions has been performed in the past year. (e.g., Ref. Shimizu et al., 2003)
Many works investigating low-dimensional properties have focused on the transition metal oxides and organic compounds, because a lot number of model substances has been found in these systems. On the other hand, -electron intermetallics, especially heavy-fermion systems, have been given rather less attentions. Recently, single crystal studies of ternary lanthanide bolides Rh3B2 (Ce, Pr) have been performed by T. Okubo and M. Yamada et al., and these compounds have been regarded as low-dimensional electrons and magnetic systems.Okubo et al. (2003); Yamada et al. (2004)
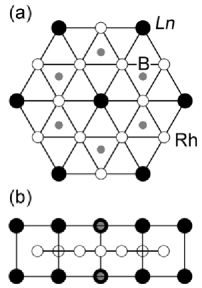
The structural lattice of Rh3B2 is displayed in Fig. 1. These compounds crystallize into hexagonal CeCo3B2-type structure with space group P6/mmm. In this structure, two considerable feature, which will frequently affect on the physical properties of many-body electron systems, are contained. The first feature is the one-dimensionality along the -axis. The lattice constant along the -axis is markedly shorter than -axis (for example, and for CeRh3BKu et al. (1980); Langen et al. (1987); Misemer et al. (1984)) , so that the strong correlations and the good conductivity along the -axis will be reminded in a series of these compounds. From the comparison between de Hass-van Alphen experiment and band calculation, a wavy but almost flat Fermi surface concerned to the one-dimensionality has been actually concluded in both CeRh3B2 and PrRh3B2,Okubo et al. (2003); Yamada et al. (2004) and correspondingly, the relatively larger magnitude of resistivity along the -axis than the -plane has been clarified.Yamada et al. (2004) The another striking feature of this compounds is a geometrical frustration. As shown in Fig. 1, sublattices form the triangular lattice, and ferrimagnetism in PrRh3B2, originating from an Ising-type classical antiferromagnetic frustration has been suggested.Yamada et al. (2004)
These results in lanthanide systems have been encouraged us to develop into the actinide families UB2 (Co, Ir), and we have undertaken 11B NMR measurement to look into low-dimensional characteristics of -electron systems. The UCo3B2 crystallizes into the isomorphic Rh3B2, and the UIr3B2 forms the modulated superlattice due to the slight atomic displacement from the CeCo3B2-type structure.Yamaura et al. Since the structural difference between these is insignificant, systematic comparison of the observed results can be possible. These compounds displays the itinerant paramagnetic behavior,Yang et al. (1985a, 1984, b); Ikeda et al. and no magnetic ordering have been observed down to 0.5 K.Ikeda et al. In the low temperature () state, the resistivity obeys the Landau-Fermi liquid type variations, and the Kadowaki-Woods law exhibited an amount of Sommerfeld coefficient () as a few hundred mJ/molK2 for UIr3B2 and a tenth order for UCo3B2.Ikeda et al. The larger in UIr3B2 than in UCo3B2 suggests that UIr3B2 has more enhanced quasi-particle band on Fermi level. In connection with this matter, the resistivity of UIr3B2 draws the shoulder-like curve which is the signature of dense-Kondo systems. On the other hand, simple metallic behavior has been observed in UCo3B2.Ikeda et al.
In this paper, we report the 11B NMR results investigating the crystallographic and electric properties in UB2. The NMR spectrum and its azimuth angle () variation in UIr3B2 indicate that B site is single, and a ligands orientation surrounding B atom points the same way as the another one by three- or six-fold rotation around the -axis. This NMR results obtained have been consistent with the modulated superlattice proposed by X-ray diffraction measurement.Yamaura et al. The Knight shift and nuclear spin-lattice relaxation rates varies its behavior around K in both UIr3B2 and UCo3B2, which implies that the crossover of magnetic state dynamics commonly occurs in these compounds at the same . Moreover, similar magnetic correlations have been identified in each systems from the evaluation of general susceptibility (). Above , the development of is mainly caused on , suggesting that ferromagnetic correlations grown in high- regime. Below , the ferromagnetic components in still maintain its magnitude, in addition, the finite- dispersions in standing for the antiferromagnetic correlations suddenly emerge. The origin of simultaneous observation of ferromagnetic and antiferromagnetic correlations in both UB2 is discussed on account of the low-dimensionality associated from the lanthanide Rh3B2.Okubo et al. (2003); Yamada et al. (2004) The part of the works in UIr3B2 has already been published on previous proceedings,Fujimoto et al. (a, b) where experimental results and its interpretations have been briefly stated. In this paper, full set of data including UCo3B2 will be presented, and qualitative analysis and comparison between two intermetallic bolides are carried out.
II Experiment
The polycrystalline UCo3B2 and the single crystal UIr3B2twi were grown by the Czochralski pulling method in tetra-arc furnace. The details of sample preparation will be described in elsewhere.Ikeda et al. For the NMR measurement, UCo3B2 was powdered in order to penetrate the rf pulses sufficiently, and UIr3B2 was sliced into mm3 dimensions for the easy treatment. The natural line width of these compounds were narrow ( kHz), indicating that the samples used in this paper have a homogeneous electron state without any lattice stains.
NMR measurements were carried out by conventional spin-echo method with - series of pulse, using phase-coherent pulsed-spectrometer. -range is 5-270 K, and applied magnetic field () was fixed to be T for UCo3B2 and T for UIr3B2. The NMR spectrum was obtained from the Fast Fourier-transformation technique. The Knight shift of UIr3B2 (; ) were measured at the peak-frequency of central resonance ( transition) within the -plane (parallel to ) and -axis (parallel to ). Meanwhile, the Knight shift of UCo3B2 () was estimated from the gravity of central resonance, and means the spatial average of generally anisotropic Knight shift. This comes from the powdering procedure. The nuclear spin-lattice relaxation rate of UIr3B2 () and UCo3B2 () was obtained from the saturation-recovery method (-- pulse sequences), and then, satellite resonance ( transitions) for UIr3B2 and all of the spectrum components for UCo3B2 was excited. Obtained nuclear-magnetization recoveries was uniquely determined by a single components function with the magnetic relaxation processNarath (1967) over the measured -range. This means that the obtained amount of nuclear spin-lattice relaxation rate and its -variations are accurate and reasonable.
III Results and Discussions
III.1 NMR spectrum
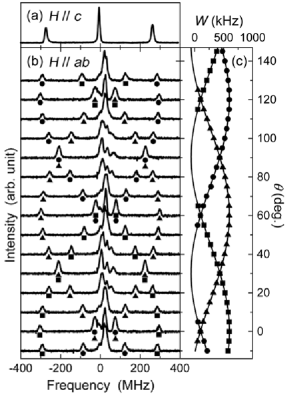
Since the crystal structure of UIr3B2 does not still determined precisely, we measured the NMR spectrum in several orientation to mention the crystal symmetry. The Fig. 2(a) and 2(b) shows the 11B NMR spectra of UIr3B2 at 5.5 K. In the case of , a simple NMR spectrum with the small electric field gradient (EFG) on nuclear spins have been observed. This result concludes that the magnitude of EFG is the same on all 11B nuclei, and thus crystallographically single site is inferred for B atoms. The -application within the -plane splits NMR spectrum into the three sub-spectra. The ratio of three sub-spectra is . From the -variation of NMR spectrum within the -plane, the quite similar behaviors of satellite spacing () for each sub-spectra was found; whose curves trace the same amplitude and the periodicity, but its phase alternates in orders. The -axis of EFG tensor points to [210] () or its equivalent directions, suggested by the six-fold symmetry of NMR spectrum and the larger -maxima than that of -axis. This results represent that a certain ligands orientation enclosing B atoms can have the same arrangement as the another one by the or the sample rotation around -axis. The recent proposed structure by the X-ray diffraction measurementYamaura et al. can explain the rotational variation of NMR spectrum, and The details of X-ray analysis will be appeared in separate paper.
To evaluate an amount and anisotropy of EFG, we estimate the nuclear quadrupole frequency () and asymmetric parameter () defined as and , where is the nuclear quadrupole moments of 11B nucleus, and () is the magnitude of EFG along the -axis. These parameters can be obtained from the fitting of with the theoretical function described as,Stauss (1964)
| (1) |
In the case of (therefore ), the fairly fit could not be done due to the theoretical demand on . As a result, is determined along the -axis and fitting was performed with . The results are displayed in Fig. 2(c) as the solid lines. Although the fit has been carried out independently for three different , the almost same and was obtained. This is the another proof of crystallographically single B site. The mean value of EFG parameters are kHz and . The rather large would imply that Ir ligands surrounding B atom distorts from the CeCo3B2-type structure, in which axial EFG symmetry () is expected, because B atoms locate on the gravity of regular prismatic-Ir and U-triangle.
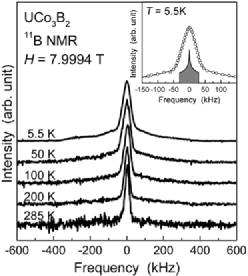
Fig. 3 shows the -variation of 11B NMR spectra in UCo3B2. The satellite resonances were broadened due to the sample powdering process. The satellite components in NMR spectrum spread over the kHz, and this amount is comparable to the obtained in the UIr3B2 (300 kHz). Since the approximately identical valence is assumed in both compounds, the structural similarity between these will cause the same order of . The central resonance is also broadened due to the anisotropic Knight shift, and we performed the analysis of the obtained spectrum at 5.5 K with general powder pattern.Bloembergen and Rowland (1953) The result is shown in the inset of Fig. 3. Since the peak and two mid-points in central resonance correspond to the each Knight shifts along its principal axis. these mean () can be interpreted as isotopic part, and its -variations will be discussed in next subsection.
III.2 Knight shift and plot
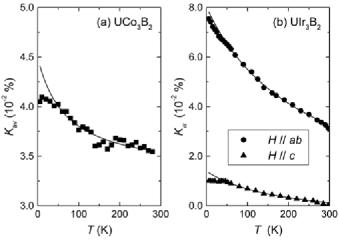
Fig. 4 shows the -variation of Knight shift of UCo3B2 () and UIr3B2 (, ). Both Knight shift gradually arise with decreasing , whereas these show the saturation tendency below K; and display the -independent behavior, but deviate slightly from the continuous variance. Similar crossover behaviors are also seen in nuclear spin-lattice relaxation rate as described later, and the obtained results mean that two different class of magnetic state discriminated at is realized in both UB2 compounds.
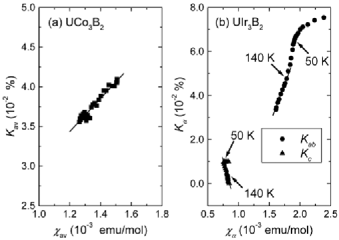
To evaluate the amount of hyperfine interactions between 11B nuclei and the conduction electrons, we estimate hyperfine coupling constant ( for UCo3B2 and for UIr3B2) from the Knight shift vs. susceptibility (-) plots. The results are shown in Fig. 5. The - of UCo3B2 is straight in all -range, and derived from the relation has been 1.2 kOe/. On the other hand, the - in UIr3B2 two times bend at 140 K and 50 K, which will be clearly seen in . The first anomaly at 140 K will originate from the coherent electron correlations. Actually, calm drop around similar has been observed in the resistivity measurement.Yang et al. (1984, 1985b); Ikeda et al. The second anomaly at 50 K will be caused by the ferromagnetic impurities. According to the magnetization measurement,Ikeda et al. the ferromagnetic hysterisis has been observed and it exhibits rapid enhancement in the -variation of susceptibility below 50 K. The plausible hyperfine coupling constants obtained from the linear part above 140 K are kOe/ and kOe/. The hyperfine coupling in both materials is rather small than other ligand NMR in -electron systems, and this will imply that valence band in B atoms are far from the Fermi level. From the former band calculation by an APW method in UIr3B2,Kasaya et al. (1990) the density of state at the Fermi level were assumed to mainly come from the U() and Ir() electrons, and these elements plays the dominant role for physical properties in UIr3B2. As a result, small hybridization between B() bands and conduction electrons will be the origin of the weak hyperfine interactions.
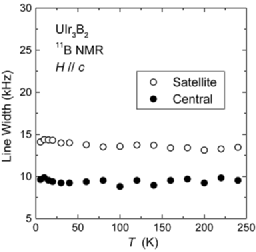
In UIr3B2, the is similar to the emergent point of ferromagnetic moments. To verify that the Knight shift (and the nuclear spin-lattice relaxation) anomaly is extrinsic or not, we checked the -variation of spectrum line width of 11B NMR. If the Knight shift anomaly originates from the hyperfine field from the magnetic impurity, the line width should be also broadened. The -variation of line width obtained from the central and satellite resonance along the -axis is displayed in Fig. 6. Between 5.0 K and 250 K, the observed line width is -invariance, and no anomaly across could not be confirmed. Thus, the Knight shift (and the nuclear spin-lattice relaxation rate) anomaly around the is assumed to be intrinsic.
For the qualitative estimation of the magnetic state above the , the Curie-Weiss fit of the Knight shift has been performed in both UB2 compounds. The applied fitting function is , where is the -independent van Vleck part in the Knight shift. The results are shown in Fig. 4 as the solid lines. The obtained Weiss-s are K, K and K, and all of these are negative. Although a simple consideration from the localized picture associates with the antiferromagnetic correlations from the negative Weiss-, another magnetic state will be claimed by the comparison between the Knight shift and the nuclear spin-lattice relaxation rate. The detailed analysis will appear in next subsection. From the estimated Curie constant and the formerly obtained , we calculate effective magnetic moments of U atoms. The results have been , and . Since the full moment of U3+ and U4+ are in the order of 3.2 , the estimated magnitudes of magnetic moment imply the itinerancy of -electron even in the high- state.
III.3 Nuclear spin-lattice relaxation rates
From the results of and , the -variations of are discussed in this subsection. In general, is in proportion with the uniform susceptibility equivalent to the longitudinal Re[] at . On the other hand, probes the transverse Im[] in wide -range, expressed as,Moriya (1963)
| (2) |
where is the hyperfine coupling constant in -space, and is the Larmor frequency of applied rf pulses. In UIr3B2, the NMR measurement has been performed with a single crystal, and consequently Eqs. 2 means that relates to the -plane components of Im[], whereas does to the - and also -axis components. To gain the knowledge about the anisotropic properties of , the next reductions of described as,
| (3) | ||||
| (4) |
have been performed. As a result, signifies the longitudinal Im[] along the -direction, and the anisotropic properties of magnetic correlations can be discussed from the experimental point of view. In UCo3B2, meanwhile, the NMR measurement has been carried out with the powder sample, therefore, means the spatial average of the nuclear spin-lattice relaxation rates, and is simply replaced as .
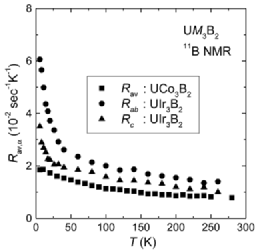
Fig. 7 shows the -variation of . With decreasing , the steadily enhancement of not to be the -indepenent Korringa relations in metallic compounds was found. This result suggests that the magnetic excitations underneath the itinerant Pauli paramagnetism exist in both UB2 compounds. As mentioned in the former, the magnetic state crossover in low- state is also confirmed from the rapid enhancement of . This behavior stands out especially in UIr3B2, and the rather strong magnetic correlations in UIr3B2 than UCo3B2 will be suspected.
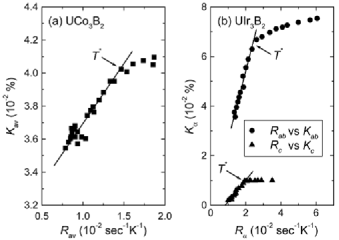
To derive the characteristics of magnetic correlations, we compared the -variations of with . Fig. 8 shows the vs. plots as -implicit. Above , the good linear relations between and has been found in both UB2; in other words, this result expresses that the and the are proportional to one another. As described in Eqs. 2, probes the uniform susceptibility () and also the finite- components of , so that the staggered parts in should be zero in order that follows on the same -variations of . The development of spin fluctuations means the ferromagnetic correlations, and it is interesting that UCo3B2 and UIr3B2 have the same feature in common. In the itinerant systems with ferromagnetic exchange, the similar -variance of and sometimes occurs. The typical substances will be the Laves phase compunds,Yoshimura et al. (1987) and the theoretical explanation has been already performed in the framework of self-consistent renormalization theory.Moriya and Ueda (1974)
Below , the vs. plots abruptly bend in both UB2 as shown in Fig. 8. The breakdown of the scaling law results from the incompatible behaviors between and ; namely, shows a -invariant tendency, but exhibits the monotonic increase. From the same consideration above , the behavior of suggests that the ferromagnetic component prescribed by almost saturates. On the other hand, the unexpected enhancement of against the -invariant tendency of is interpreted as the appearance of the antiferromagnetic correlations attributed from the finite- dispersions emerged in . The remarkable feature below is that the spectral weight of still remains, because the spin part of does not go down to zero with decreasing . Furthermore, seems to form the complicated dispersions with the finite- components of . This assumption suggests that the ferromagnetic and antiferromagnetic correlations is present at the same time in low- regime.
It is noteworthy that UCo3B2 and UIr3B2 show the similar magnetic properties; the ferromagnetic correlations develop above , and ferromagnetic and antiferromagnetic correlations simultaneously emerge below . From the comparison of each compounds, it is mentioned that the structural lattice is almost isomorphic. In addition, the valence state is assumed to also closely resemble, because Co and Ir locate at the same column in the periodic table. Meanwhile, the -bands formed by the transition metals are different due to the Co- and Ir- configurations. The antiferromagnetic correlations infered from have been more emphasized in UIr3B2 than UCo3B2. This will be caused from the different degree of the hybridization between the - and - state. On the other hand, similar magnetic properties will originate from the structural similarity in each compounds. As described in the Sec. I, Rh3B2 has a quasi-one dimensional electrons bandOkubo et al. (2003); Yamada et al. (2004) because of the highly compressed structure along the -axis. One plausible exposition by a structural clue will be a nesting effect of the ferromagnetic band. In such a case, ferromagnetic correlations above will be caused by the intra-band spin exchange. Meanwhile, flat regions of Fermi surface may lead to substantial nesting effects with a large contact area, which may in turn give rise to antiferromagnetic correlations with a finite- below . Although the experimental band investigations in UB2 have not been done yet, an implication for the one-dimensionality is the good conductivity along the -axis observed in UIr3B2,Ikeda et al. and this matter of fact can be associated with a flat part in Fermi surface along the -plane. For the further investigation of the Fermi surface geometry, the de Hass-van Alphen and/or the angle resolved photo emission experiment are needed to understand the magnetic correlations obtained by NMR.
IV Conclusion
We have performed 11B NMR measurements on the powdered UCo3B2 and the single crystal UIr3B2. From the NMR spectrum in UIr3B2 observed in various crystal axes, crystallographically single B site was identified, and the ligands arrangements on the two different B sites face the same way by the or the rotation around the -axis. This has been the consistent result with the recently proposed structure of UIr3B2 examined by the X-ray diffraction measurementYamaura et al. using the same piece of ingot. From the - plots, the magnitude of the hyperfine coupling constant was estimated, and then kOe/ for UCo3B2, kOe/ and kOe/ for UIr3B2 have been obtained. The -variations of and in both UB2 have been revealed the magnetic state crossover at the same point K. The development of evaluated from and have clarified the similar characteristics of the magnetic correlations in both UB2. Above , the ferromagnetic correlations evidenced from the development of was found. On the other hand, below , the antiferromagnetic correlations suggested from the finite- components in abruptly emerges. Since the ferromagnetic correlations does not show the tendency of the reduction below , the ferromagnetic and the antiferromagnetic correlations seem to exist simultaneously in low- phase. To understand the magnetic properties observed in UB2, the discussion based on the structural origin have been performed.
Acknowledgements.
The authors would like to thank to Prof. H. Yasuoka and Dr. W. Higemoto for their valuable comments and discussions.References
- Peierls (1955) R. E. Peierls, Quantum Theory of Solid (Oxford Univ. Press, Oxford, England, 1955).
- Tomonaga (1950) S. Tomonaga, Prog. Theor. Phys. 5, 544 (1950).
- Luttinger (1963) J. M. Luttinger (1963).
- Anderson (1973) P. W. Anderson, Mater. Res. Bull. 8, 153 (1973).
- Shimizu et al. (2003) Y. Shimizu, K. Miyagawa, K. Kanoda, M. Maesato, and G. Saito, Phys. Rev. Lett. 91, 107001 (2003).
- Okubo et al. (2003) T. Okubo, M. Yamada, A. Thamizhavel, S. Kirita, Y. Inada, R. Settai, H. Harima, K. Takegahara, A. Galatanu, E. Yamamoto, et al., J. Phys.: Condens. Matter 15, L721 (2003).
- Yamada et al. (2004) M. Yamada, Y. Obiraki, T. Okubo, T. Shiromoto, Y. Kida, M. Shiimoto, H. Kohara, T. Yamamoto, D. Honda, A. Galatanu, et al., J. Phys. Soc. Jpn. 73, 2266 (2004).
- Ku et al. (1980) H. C. Ku, G. P. Meisner, F. Acker, and D. C. Johnston, Solid State Commun. 35, 91 (1980).
- Langen et al. (1987) J. Langen, G. Jackel, G. Schlabitz, W. Veit, and D. Wlhlleben, Solid State Commun. 64, 169 (1987).
- Misemer et al. (1984) D. K. Misemer, S. Auluck, S. I. Kobayashi, and B. N. Harmon, Solid State Commun. 52, 955 (1984).
- (11) J. Yamaura et al., recent X-ray results could not assign the scattering profile with the formerly reported P6/mmm symmetry, and complex but similar structure to CeCo3B2-type has been suggested. The detailed description will appear in separate paper.
- Yang et al. (1985a) K. N. Yang, M. S. Torikachvili, M. B. Maple, H. C. Ku, B. B. Pate, I. Lindau, and J. W. Allen, J. Magn. Magn. Mater. 47&48, 558 (1985a).
- Yang et al. (1984) K. N. Yang, M. S. Torikachvili, M. B. Maple, and H. C. Ku, J. Low Temp. Phys. 56, 601 (1984).
- Yang et al. (1985b) K. N. Yang, M. S. Torikachvili, M. B. Maple, and H. C. Ku, J. Appl. Phys. 57, 3140 (1985b).
- (15) S. Ikeda et al., (unpublished).
- Fujimoto et al. (a) T. Fujimoto, H. Sakai, Y. Tokunaga, S. Kambe, R. E. Walstedt, S. Ikeda, T. D. Matsuda, Y. Haga, and Y. Ōnuki, physica B at press.
- Fujimoto et al. (b) T. Fujimoto, H. Sakai, Y. Tokunaga, S. Kambe, R. E. Walstedt, S. Ikeda, T. D. Matsuda, Y. Haga, and Y. Ōnuki, j. Phys. Soc. Jpn. Suppl. at press.
- (18) X-ray analisis by J. Yamaura et al. has been suggested the twinning in a growned UIr3B2. However, obtained NMR spectrum could be assigned by the single phase. This cause is that NMR spectrum observed from each domains completely overlap with each other.
- Narath (1967) A. Narath, Phys. Rev. 162, 320 (1967).
- Stauss (1964) G. H. Stauss, J. Chem. Phys. 40, 1988 (1964).
- Bloembergen and Rowland (1953) N. Bloembergen and T. J. Rowland, Acta Metall. 1, 731 (1953).
- Kasaya et al. (1990) M. Kasaya, F. Iga, K. Katoh, K. Takegahara, and T. Kasuya, J. Magn. Magn. Mater. 90&91, 521 (1990).
- Moriya (1963) T. Moriya, J. Phys. Soc. Jpn. 18, 516 (1963).
- Yoshimura et al. (1987) K. Yoshimura, K. Fukamichi, H. Yasuoka, and M. Mekata (1987).
- Moriya and Ueda (1974) T. Moriya and T. Ueda, Solid State Commun. 15, 169 (1974).