Quasi-stationary criticality of the Order-Parameter of the Random-Field Ising Antiferromagnet : A Synchrotron X-ray Scattering Study
Abstract
The critical exponent for the three-dimensional random-field Ising model (RFIM) order parameter upon zero-field cooling (ZFC) has been determined using extinction-free magnetic x-ray scattering techniques for . This result is consistent with other exponents determined for the RFIM in that Rushbrooke scaling is satisfied. Nevertheless, there is poor agreement with equilibrium computer simulations, and the ZFC results do not agree with field-cooling (FC) results. We present details of hysteresis in Bragg scattering amplitudes and line shapes that help elucidate the effects of thermal cycling in the RFIM, as realized in dilute antiferromagnets in an applied field. We show that the ZFC critical-like behavior is consistent with a second-order phase transitions, albeit quasi-stationary rather than truly equilibrium in nature, as evident from the large thermal hysteresis observed near the transition.
pacs:
61.10.Nz, 75.40.Cx, 75.50.Ee, 75.50.LkI INTRODUCTION
One of the classic models of a phase transition in an intrinsically disordered system is the three-dimensional () random-field Ising model (RFIM). After nearly three decades of progress in experiments, simulation and theory, the phase transition in this system is not yet well understood and remains a challenge to our fundamental understanding of the statistical physics of disordered systems. Extensive Monte Carlo simulations and exact ground state calculations have provided evidence for equilibrium critical exponents, including a value for the order-parameter exponent close to zero, but with a specific heat exponent that is not yet well determined wm06 ; wm05 ; hy01 ; mf02 ; mf06 . The specific heat exponent value, however, has been determined in experiments in the dilute antiferromagnet at various magnetic concentrations sb98 ; ysmb04 to be very close to zero upon warming through the phase transition. This is indicated by the apparent symmetric, logarithmic divergence as well as the field scaling of the optical birefringence, Faraday rotation, and specific heat amplitudes pkb88 . The experimental determination of the order parameter has proven more elusive because the large number of vacancies at low magnetic concentrations allows the system to easily form domains that obscure the order-parameter critical behavior.
An avenue for determining the order-parameter exponent opened once it was understood that at higher magnetic concentrations these domains do not form. In the best studied system, the dilute antiferromagnet in a field applied along the easy axis, domains do not form for magnetic concentrations bybf04 ; bb00a ; gjd05 . As we will discuss below, the experimental results nevertheless do not agree well with the equilibrium Monte Carlo and exact ground state calculations. Indeed, the experimentally-observed transition is clearly not in equilibrium, although critical behavior can be determined under conditions of monotonically increasing temperature. In this study, we describe the apparent critical behavior and characterize the hysteresis observed upon crossing the phase boundary. We also discuss temperature reversals just below the phase boundary. In this way, we describe the unusual circumstance of self-consistent critical-like behavior in a clearly nonequilibrium system. The discrepancy with simulations is a consequence of the simulations being done under equilibrium conditions, something apparently not realized in the macroscopic experimental system.
The phase transition in the RFIM system has been characterized in great detail for the zero-field-cooling (ZFC) procedure in which the sample is cooled in zero field, the field is raised, and the sample is warmed in constant field across the phase boundary. The transition appears to be second-order under ZFC; all of the critical exponents, measured at very small reduced temperatures, are self-consistent in that they appear to satisfy the Rushbrooke equation, as described below. Nevertheless, it is well known that different behavior is observed upon field-cooling (FC), in which the sample is cooled across the phase boundary in the field. This has been observed for this sample in x-ray scattering yzllbgl02 , neutron scattering ymkybsfa03 , optical birefringence ysmb04 and optical Faraday rotation ysmb04 experiments. Hence, the ZFC phase transition is extraordinary in that it appears to be second-order if the temperature reversals are avoided but, in light of the hysteresis, it does not take place under equilibrium conditions as would be the usual case. To better characterize the apparent RFIM transition, the FC critical behavior, and the hysteresis in general, needs to be explored more fully. We have done this for the order parameter in using magnetic x-ray scattering.
Characterization of the order parameter, the staggered magnetization (), is achieved by determining the temperature dependence of the antiferromagnetic Bragg scattering intensity, which is proportional to , versus the temperature . The order parameter is expected to behave as
| (1) |
for , where is the reduced temperature and is the transition temperature. As discussed in a previous Letter yzllbgl02 , which focused on the ZFC measurements, neutron scattering techniques can not be used to characterize the order parameter critical behavior in high-crystalline-quality bulk crystals because of severe extinction effects, which tend to modify the temperature dependence of the Bragg intensity as the temperature is lowered. The effect arises when the scattering sample region is so thick and the crystal is so perfect that the beam is selectively depleted of neutrons that satisfy the Bragg condition for scattering. This prevents an accurate determination of the exponent . The x-ray technique, on the other hand, is essentially free of extinction effects and the order-parameter criticality can be measured accurately near yzllbgl02 . This is possible since the thickness of the scattering region is limited by the strong temperature-independent charge scattering and, within this region, the beam is never depleted of x-rays meeting the Bragg condition since the magnetic scattering is weak.
A magnetic concentration near the one in this study, , is crucial to this order parameter characterization. Many prior attempts hfbt93 ; bwshnlrl96 to determine the critical behavior of the order parameter proved unsuccessful because , where is the magnetic vacancy percolation bb00a . Domain formation obscures the RFIM critical behavior below the transition at in and its less anisotropic (i.e., smaller Ising anisotropy) isomorph for . The concentration , while being greater than , is low enough to generate significant random-field effects at the maximum field of our experiment, T. It is, at the same time, high enough to avoid the complication of contributions to the scattering intensity from fractal-like percolating vacancy structures bybf04 that appear close to .

II EXPERIMENTAL DETAILS
We are interested in the magnetic scattering intensity near the antiferromagnetic zone center . Hence, we need not worry about strong charge scattering contributions and can easily discern the relatively weak magnetic response. The measurements were made at the high-field magnet facility on beam line 7-2 of the Stanford Synchrotron Radiation Laboratory. A monochromatic x-ray beam was obtained using a Si(111) double-crystal monochromator from a spectrum produced by a wiggler insertion device. The x-ray energy was carefully tuned to a value between 13.5 and 14 keV to minimize the effect of energy-sensitive multiple scattering peaks around the magnetic Bragg point hfbt93 . The incident x-ray energy was well-defined, within about 10 eV, whereas the detector had a half-width energy resolution of 300 eV. As shown in Fig. 1, at temperatures above the transition temperature, where no magnetic scattering occurs, the x-ray energy was adjusted until the multiple scattering peaks move apart as far as possible hfbt93 . From Fig. 2 it is clear that the multiple scattering peaks do not affect the analysis of the magnetic peak below the transition for an x-ray energy of eV.

The sample has a finely polished face, approximately mm2 in area, and is mm thick, with the -axis perpendicular to the polished face. It was mounted such that the -axis was along the vertical field. The well polished surface prevented spurious effects such as those observed in previous experiments hfbt93 , where a transition-like behavior was observed that disappeared when that the faces were polished. Presumably, this is a result of strong pinning at the locations of the scratches which prevented RFIM correlations to develop. The chemical homogeneity of the crystal was determined by a room temperature optical linear birefringence technique kfjb88 to be /cm. The rounding of the transition is approximately mK, corresponding to a tiny reduced temperature of on either side of the transition. The crystal was mounted on a thin silicon bar of dimensions and placed in an atmosphere of approximately 10-20 mbar of Helium gas to achieve stabilization of the sample temperature to within approximately 10 mK. The zero-field transition temperature was measured to be K, consistent with birefringence measurements on the same sample ysmb04 and with a magnetic concentration bkbj80 .
The lattice parameters of the sample were determined to be approximately Å and Å near the transition temperature. The full-widths-at-half-maximum measured at the (1 0 0) magnetic Bragg point were , , and reciprocal lattice units (r.l.u.) for the transverse, longitudinal and vertical directions, respectively. Three conventional thermal-cycling procedures were employed: ZFC; FC; and field-heating (FH). As described previously, in ZFC the sample is cooled across the phase boundary with and data are taken while warming with , whereas in FC the data are taken while cooling across the phase boundary with . In the FH procedure, the sample is first cooled through the transition in a field, and then the data are taken at that field value at successively higher temperatures. During each procedure, when the sample temperature was not continuously changed, the sample was held at each temperature for at least 20 min before taking data to ensure that the temperature and system stabilized. The temperature was stabilized before scans were obtained. However, when monitoring the peak intensity, it was more convenient to let the temperature change continuously. The data taken at and T in this study, except where noted, were obtained in transverse scans typically consisting of 41 points, about 15 of which covered the Bragg peak. At each point, the intensity was counted for 30 to 45 seconds, depending on the temperature of the scan. At other fields, Bragg intensities were obtained at only.
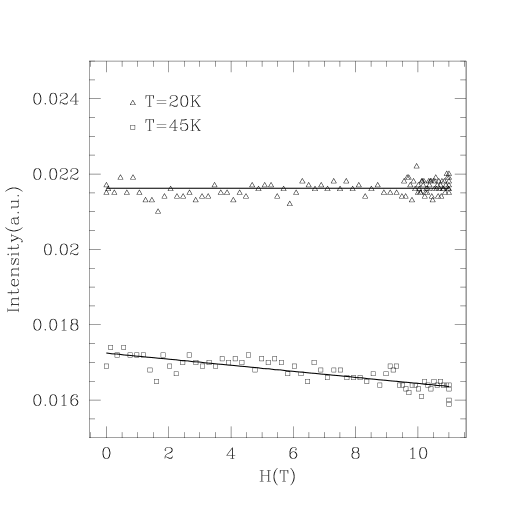
The antiferromagnetic transition for has been shown to be stable in applied fields as high as T samb02 . To make sure that the ordered system is well-behaved at low as we raised the field, we first cooled the sample in zero field to K. The magnetic field was then slowly raised to T at a rate of 0.4 T/min for T and 0.1 T/min for T. The peak intensity of the order parameter was monitored as we raised the field. Another set of measurements was similarly taken at K. The results at both temperatures are shown in Fig. 3. The intensity at K remains essentially unchanged as the field is increased since the data are all taken deep within the ordered region. The result for K shows a slight field dependence since, for this case, the phase boundary (at K for T) is approached more closely, although it is still quite far away. Those data demonstrate the stability of the order, i.e., no apparent phase boundaries were crossed. No change in the line width of the Bragg scattering was observed upon application of the field, further attesting to the stability of the order at low temperatures.

The x-ray scattering technique has the advantage of very high momentum resolution, allowing a detailed study of the Bragg peak line shapes. It is important to use fine collimating slit widths to observe details of the scattering line shapes. For this purpose, the horizontal slits were configured to be mm, approximately cm in front of the sample and mm the same distance after the sample. At approximately cm behind the sample is a second slit which was set at mm. Care was taken to ensure that the sample was well aligned for all measurements while using this narrow slit configuration. For measurements of the peak intensity versus temperature, the slits after the sample were opened slightly to reduce the sensitivity of the intensity to the precise alignment of the sample and beam so that wide ranges of and could be accessed without continual adjustments.
Figure 4 shows typical transverse scans at different temperatures in a field T after ZFC. The peak line shapes appear to be consistent with resolution-limited Gaussians for all temperatures below the transition temperature for T, K. As the temperature approaches , the intensity gradually diminishes. The relatively very weak critical scattering is not apparent in this figure.

III QUASI-STATIONARY CRITICAL BEHAVIOR
Figure 5 shows the Bragg intensity at and, for ZFC, at T versus temperature, with the momentum and temperature independent background subtracted. The background depends on the precise experimental configuration, but not on the thermal cycling procedure used in collecting data. The background is mostly from sources other than the crystal itself. For comparison of the background to the Bragg intensity signal, typical background counts for the T scans were eight counts per second whereas the intensity was 300 counts per second at K. Above the transition, the background-subtracted intensity at small results only from the critical scattering and goes to zero well above , indicating that there are no discernible contributions from multiple scattering to the measured Bragg intensities. To determine the critical scattering for the and T scans, neutron scattering line shapes, obtained with a sample of nearly the same magnetic concentration ymkybsfa03 using a procedure described previously yzllbgl02 ; sbf99 , were folded with the x-ray resolution, and the overall amplitude was adjusted to fit the T data above . Insets a and b in Fig. 5 show the critical scattering contributions for and T, respectively. As a result of the high momentum resolution of the x-ray technique, the critical scattering contributions at , which are nearly Lorentzian for sbf99 ; bybf04 , are almost negligible (inset a). For (inset b), however, the critical scattering has been shown to be non-Lorentzian and to have a much larger intensity at small sbf99 . Recently, it has been shown that this scattering is consistent with fractal spanning clusters, nucleated at random-field pinning sites, that form and grow as as the transition temperature is approached from above ymkybsfa03 . Consequently, a small contribution to the scattering is more discernible for the T data. After the critical scattering contribution is subtracted from the overall Bragg scattering intensity, the order parameter exponent can be determined using Eq. 1. As shown previously yzllbgl02 , the exponent determination is not very sensitive to the details of the background subtraction.
Although neutron scattering measurements using ymkybsfa03 and sbf99 show no evidence for micro-domain structure formation in the critical scattering, hysteresis in is evident. FC intensities are larger than the ZFC ones, which is a result of extinction. For ZFC samples, the ordering is so perfect that relatively few neutrons satisfy the Bragg condition. With FC, even with no large-scale domain structure, there is apparently enough disorder to strain the crystal, through magnetostrictive effects, allowing more neutrons to scatter. The x-ray Bragg scattering also shows hysteresis, but in this extinction-free case the ZFC data are higher in intensity. FH data are intermediate between the ZFC and FC curves. We note that specific heat critical behavior measurements also show hysteresis very close to at this concentration ysmb04 ; sb98 .
The Bragg intensity curves for in Fig. 5 clearly approach vertically. This is characteristic of experiments ymkybsfa03 ; sbf99 ; bybf04 and simulations bb00a ; pb05 for and is in stark contrast with experiments b00 ; hfbt93 ; bwshnlrl96 and simulations bb00b for , where approaches horizontally. The latter behavior is attributable to micro-domain structure formation, which is energetically favorable when the vacancies percolate through the crystal, as shown in Monte Carlo simulations bb00a .

Figure 6 shows the logarithm of , with the constant background and critical scattering contributions subtracted, vs. the logarithm of for and for T under ZFC cycling. The values of were determined from fits to the data. For and , we find (lower solid line), which agrees well with several experimental and theoretical determinations for the random-exchange Ising model, as recently discussed b00 ; pv02 ; fhy03 . For T, a crossover from random-exchange to RFIM critical behavior occurs near , consistent with birefringence measurements ysmb04 , and the data can be fit to a single power law only in the range . The fit over this range yields the exponent for T, as indicated by the upper solid line in Fig. 6.

In addition to the T data described above, we also measured the order parameter at , , and T to investigate crossover effects. All of the data were taken upon implementing the ZFC protocol. After we realigned the Bragg peak position at T using transverse scans, the sample was slowly warmed through the transition while the intensity, , was recorded. The rate of temperature change was controlled to be K/min away from the transition, and was decreased to K/min close to the transition. After the sample was warmed above the phase boundary and subsequently cooled, we re-examined the beam alignment to ensure that the peak intensity was measured. We found the peak position to change very little upon cycling. The same procedures were repeated for fields of , , and T. Figure 7 summarizes the ZFC order parameter measurements at various fields. Three common features can be discerned. First, far below the transition temperature, the Bragg peak intensity tends toward saturation since all magnetic moments in the beam-illuminated region achieve long-range order at such fairly low temperatures. Second, for reduced temperatures in the range , the behavior of is very similar to the REIM behavior, as shown in Fig. 6; the difference in the slope results from the variation of with field, since the transition temperature is determined by the random-field behavior. Third, as the temperature approaches , the logarithm of in different fields exhibits the same exponent which is indicated by the parallel straight lines through the experimental data. The fitted exponents of the order parameter at , , and T are , , and , respectively, where the quoted errors are statistical. The higher fields provide larger ranges of reduced temperatures over which to fit the data and so yield more reliable values for . From these results, we obtain a more precise order-parameter critical exponent, , than reported in our previous study yzllbgl02 .
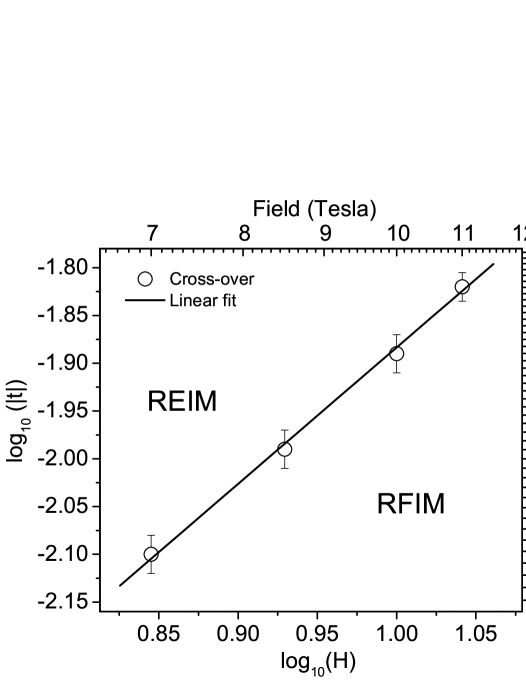
In Fig. 8 is plotted the logarithm of versus the logarithm of where REIM crosses over to RFIM critical behavior. This value is defined, for the data shown in Fig. 7, as the intersection of a straight line through asymptotic RFIM behavior and one through the REIM behavior. From the scaling variable , we see that the slope in Fig. 8 yields the random-exchange to random-field crossover exponent . Indeed, the value obtained, , agrees well with the earlier experimentally determined and the most recent theoretically established values, both of which are for three dimensions b00 ; cpv03 ; kjbr85 ; mkj86 ; kkj86 .
Through the Rushbrooke scaling relation
| (2) |
which is usually satisfied as an equality, is related to the universal critical exponents (for the specific heat) and (for the staggered susceptibility) of the RFIM. The experimentally determined specific heat peak is nearly logarithmic and very symmetric close to , consistent with ysmb04 ; sb98 . Recent neutron scattering analyses ymkybsfa03 ; sbf99 yield a value of , consistent with earlier results. Therefore, the experimental value is consistent with Rushbrooke scaling , even though the system is clearly not in equilibrium.
None of the ZFC results are dependent on the rate at which the sample was warmed, typically between K/min and K/min. However, the results are quite sensitive to temperature reversals of even a few mk, including overshoots of the set point when stabilizing the temperature. Such overshoots were meticulously avoided in the critical behavior measurements.
IV THERMAL HYSTERESIS
We next turn our attention to the effects of hysteresis and temperature reversals, including the difference between the critical behavior observed upon ZFC and FC. The order parameter measurements display significant irreversibility in both and cycling procedures. We will address field hysteresis effects in the next section.

A ZFC temperature cycle, followed by repeated cooling and heating at T, is shown in Fig. 9 for the temperature range between K and K. There is no observable hysteresis in this temperature range; the data taken upon cooling are essentially identical to those obtained upon heating.

However, if we heat the sample to a temperature sufficiently close to the phase boundary, then, upon reversing the temperature, the intensity of Bragg scattering shows significant irreversibility, as shown in the upper panel of Fig. 10. The data obtained upon cooling exhibit lower intensities compared to the data obtained upon the initial ZFC warming. A significant discrepancy is observed after the sample is cooled to K. The behavior of temperature reversal amplitudes of the order parameter after cooling with and raising the field was further investigated by repeatedly cooling and warming the sample, using rates described earlier. The top panel shows the measurements taken upon cycling after cooling with and raising the field without exceeding at T. All the reversals close to take place at K, which is mK below . For reversal measurements without crossing the phase boundary, the amplitudes of the Bragg peaks gradually decrease after each cycle, but the warming curve follows the previous cooling curve quite well. In this way, the overall amplitudes slowly decrease upon cycling. After several cooling and warming loops, the amplitude is finally stabilized at the lowest cooling curve (scan #5) shown in the top panel. The last set of data (scan #6) was obtained by warming through the phase boundary.
In the lower panel of Fig. 10, the data obtained while warming across the phase boundary are repeated to serve as a reference. The sample was cooled using the FC procedure to K. The same temperature loop measurements were then repeatedly taken between K and K. Contrary to the cycling shown in the upper panel, the cooling and warming curves do not exhibit as clearly a slow approach to the stabilized equilibrium state from above, but instead seem to reach the stabilized behavior quickly from below upon warming. Further thermal cycling does not change the intensity. The initial FC curve is quite distinct from all other heating and cooling curves below . The FC transition appears to be at the same temperature as the ZFC one, within experimental accuracy.

In Figure 11, the logarithm of the peak amplitude versus logarithm of is plotted for various heating and cooling procedures. Only data of some typical scans are shown. Clearly, ZFC and FH curves for T have the same critical power-law behavior with at small . For temperatures outside the random-field critical region, the data cross over from the RFIM asymptotic critical behavior to the random-exchange Ising behavior as increases. The order parameter measured using the FC procedure shows strikingly different behavior from that of ZFC and FH ones; the overall intensities stay much lower and there is no observable crossover from REIM to the RFIM behavior. The exponent for the FC has a value of , but perhaps shows some rounding at smaller than . Over a large range of reduced temperature, the results obtained upon FC seem very similar to the random-exchange Ising model. Two different cooling rates, and K per minute, were used for the FC protocol. Even though these rates differ by two orders of magnitude, we find that the measured intensity is essentially insensitive to the choice of cooling rate. In order to compare the and FC data, the zero-field peak intensity is multiplied by , which reflects the difference of line shapes for the two cases, as we will discuss below.
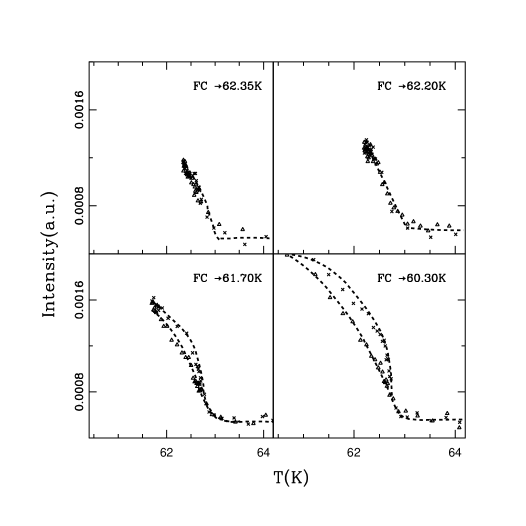
Thermal cycling loops at T after FC are shown in Fig. 12. As the reversal temperature is lowered away from , the warming curves, above the first few points after the reversal, gradually display normal FH behavior. For data taken with the lower temperature reversal point very close to , there is little discernible difference between warming and cooling data.
The irreversibilities of the random-field Ising model order parameter are also reflected in the peak intensity difference between ZFC and reversal curves at low temperature. The size of the intensity difference depends on how close one chooses to reverse the temperature near the phase boundary, as shown in Fig. 13. Four points close to K at T were chosen to reverse the temperature: K; K; K; and K. Each reversal measurement was taken after ZFC preparation. The intensities for ZFC curves are normalized at the lowest temperature so that they all have the same amplitude for comparison. For reversals close to , the shapes of the reversal curves in the critical region are quite different from the ZFC ones. The shapes for the cooling curves suggest a larger since they appear not to be as steep as the ZFC ones.

The temperature dependences of the x-ray scattering line shapes are shown in Fig. 14 under zero field cooled, field cooled and field heated conditions for T. Under ZFC, the data have typical Gaussian shapes with a half-width-at-half-maximum (HWHM) of r.l.u. For FC and FH conditions, the line shapes and intensities are distinctly different from ZFC. The tails in the former cases are much larger and the central intensities are smaller. The temperature dependence of the widths for ZFC, FC and FH is shown in Fig. 15. All data were fit using Gaussian line shapes. The HWHM from Gaussian fits for the FC and FH line shapes is much larger than that for ZFC. Gaussian fits describe the data well and indicate r.l.u. for the widths under FC and FH. Although it is not known if Gaussian fits are the correct ones to use for FC and FH, they do work well and afford direct comparisons of widths for the three cases.


In Fig. 11, the peak intensities are plotted versus reduced temperature. For a more meaningful comparison, we should compare the integrated intensity versus . Figure 14 shows the shape of transverse scans for ZFC and FH. In both cases, the line shapes appear to be Gaussian, but with different peak widths. If we take that peak broadening into account, the integrated intensity should be the product of peak width and peak intensity. Figure 16 shows the logarithm of integrated intensity versus the logarithm of . Indeed, within the experimental accuracy, the FH data collapse onto the ZFC data curves.


Figure 17 shows the difference between FH and FC data sets increasing with the strength of the applied field. The hysteresis is difficult to discern in these measurements for T, whereas for T the different shapes for FH and FC are quite evident.
V FIELD HYSTERESIS
Finally, field-cycle measurements were carried out to study the history dependence near K, the transition temperature for T. The sample was first warmed into the paramagnetic state at K, then cooled in zero field to K. The intensity was recorded as the field was slowly raised to T, where K, followed by a series of field cycling procedures with the temperature held at K. The result is presented in Fig. 18. The general features of the experimental data are similar to those of the thermal cycle measurements in Fig. 10. The initial “field raising” data, prepared by cooling in zero field and represented by open triangles, stay the highest and the intensity goes to zero rapidly as is approached. As the field is lowered, significantly less of the peak Bragg intensity is recovered, as shown for data represented by the solid symbols. When the field is raised after first lowering it, the Bragg intensity initially has an intensity similar to that at low field, but eventually crosses over to the initial “field raising” curve, in the vicinity of . The curvature is more like the initial “field raising” procedure near the transition. Similar behavior is seen upon raising the field beginning at T.

VI CONCLUSION
In summary, we used extinction-free x-ray scattering to study the hysteresis of the order parameter of random-field Ising model. The critical exponent is obtained for ZFC, whereas a different critical-like behavior, very similar to the random-exchange behavior seen for , takes place for FC. The crossover from random-field Ising model to random-exchange Ising model was observed and the value obtained for the crossover exponent is consistent with the earlier studies and theory. We examined the history-dependent critical behavior in detail for various thermal and field cycling. It is clear from the different cycling experiments that the system under FC is not in equilibrium. However, the critical behavior upon ZFC is rate independent and is consistent with a second-order transition if the temperature is never reversed. The ZFC order-parameter critical behavior, i.e. the power law behavior with and the crossover to REIM behavior, must be associated with rather stable, quasi-stationary states of the magnetic long-range component of the order. FH data exhibit line shape widths larger than ZFC and similar to FC, suggesting that some disorder introduced upon FC remains. Aside from the slightly wider line shapes, the critical behavior of the FH data closely resembles the ZFC behavior. This suggests that it is the heating itself that is important in the manifestation of the new RFIM critical behavior and not the history of the temperature-field cycling.
Although these findings are not in good agreement with equilibrium simulations and ground state calculations, as mentioned earlier, they are in good agreement with non-equilibrium Monte Carlo studies sybzb04 . Furthermore, they are consistent with studies on uniaxial relaxor ferroelectrics, a rather different experimental realization of the random-field Ising model gwwik04 ; kdlbzp02 in which the order-parameter critical exponent is observed to increase from to , a value close to the random-exchange value, when the initial polarization is varied from 100% to 0.8%. It is argued for the ferroelectric system that a lower initial polarization corresponds to a compensation of the random-field by domain walls. In the present case of the dilute antiferromagnet in a uniform field, it is clear that the large suppression of the transition is still present upon FC and that random fields are therefore not suppressed. However, it is also clear that the new critical behavior that is observed upon ZFC does not occur when the sample is FC. Mean-field treatments lmp95 ; d06 , exact ground state calculations mm05 and Monte Carlo simulations mf06 indicate a very complex energy landscape and unusual characteristics near the RFIM phase transition. Perhaps in FC the fractal spanning cluster structures formed in our sample as it is cooled towards influence the character of the ordering process upon FC ymkybsfa03 ; spa02 . The spanning clusters form as the transition is approached from above and represent an ordering process quite different from pure systems. If the system cannot readily evolve from that configuration just above to long-range order below, this might indeed result in the severe hysteresis we have observed. In the ZFC process, this high magnetic concentration sample starts from a fully ordered lattice, retaining a single domain structure, and is perhaps less influenced by spanning cluster structures that form above . Below , metastability upon cooling has been described recently in terms of instantons which are a result of the complicated energy landscape due to the random fields ms06 . Reversals of the temperature below the transition surely represent states in between those formed under ZFC and FC. A theoretical understanding of these differences and why they occur is lacking at this time. However, it is clear that this transition, with its coexistence of second-order-like critical behavior measured to very small reduced temperatures as well as severe hysteresis upon temperature reversals near the phase boundary, is highly unusual. It is not correct to assume that simply not being in equilibrium would account for different critical behavior cadmz04 . It is likely that such behavior is more generic in systems undergoing phase transitions in the presence of quenched disorder. Although and its isomorphs in applied fields are the most characterized examples of the RFIM, other magnetic dglcb04 ; mgkbgnu00 and ferroelectric kdlbzp02 ; k02 systems, as well as manganites dm01 ; mmfyd00 have been studied.
SSRL is operated by Stanford University for the U.S. Department of Energy, Office of Basic Energy Sciences. The work at UCSC was funded by Department of Energy Grant No. DE-FG02-05ER46181. The work at Stanford was supported by the U.S. Department of Energy under Contract Nos. DE-FG03-99ER45773 and DE-AC03-76SF00515, by NSF Grant Nos. DMR-9400372 and DMR-9802737, and by the A.P. Sloan Foundation. We acknowledge Onuttom Narayan for useful discussions.
References
- (1) Y. Wu and J. Machta, cond-mat/0602314 (2006).
- (2) Y. Wu and J. Machta, Phys. Rev. Lett. 95, 137208 (2005).
- (3) A. K. Hartmann and A. P. Young, Phys. Rev. B 64, 214419 (2001).
- (4) A. A. Middleton and D. S. Fisher, Phys. Rev. B 65, 134411 (2003).
- (5) A. Malakis and G. Fytas, cond-mat/0509686 (2006).
- (6) Z. Slanič and D. P. Belanger, J. Magn. Magn. Mater. 186, 65 (1998).
- (7) F. Ye, L. J. Shelton, S. A. Meyer, D. P. Belanger, unpublished.
- (8) P. Pollak, W. Kleemann, and D. P. Belanger, Phys. Rev. B 38, 4773 (1988).
- (9) W. C. Barber, F. Ye, D. P. Belanger, J. A. Fernandez-Baca, Phys. Rev. B 69, 024409 (2004).
- (10) W. C. Barber and D. P. Belanger, J. Appl. Phys. 87, 7049, (2000).
- (11) A. Glaser, A. C. Jones, and P. M. Duxbury, Phys. Rev. B 71, 174423 (2005).
- (12) F. Ye, L. Zhou, S. Larochelle, L. Lu, D. P. Belanger, M. Greven, and D. Lederman, Phys. Rev. Lett. 89, 157202 (2002).
- (13) F. Ye, M. Matsuda, S. Katano, H. Yoshizawa, D. P. Belanger, E. T. Seppälä, J. A. Fernandez-Baca, M. J. Alava, J. Magn. Magn. Mat. 272-276, 1298 (2004).
- (14) J. P. Hill, Q. Feng, R. J. Birgeneau, and T. R. Thurston, Phys. Rev. Lett. 70, 3655 (1993).
- (15) D. P. Belanger, J. Wang, Z. Slanič, S-J. Han, R. M. Nicklow, M. Lui, C. A. Ramos, and D. Lederman, Phys. Rev. B 54, 3420 (1996).
- (16) A. R. King, I. B. Ferreira, V. Jaccarino, and D. P. Belanger, Phys. Rev. B 37, 219 (1986).
- (17) D. P. Belanger , A. R. King, F. Borsa, and V. Jaccarino, J. Magn. Magn. Mat. 15-18, 807-808 (1980).
- (18) T. Sakon, S. Awaji, M. Motokawa, D. P. Belanger, J. Phys. Soc. Japan 71, 411 (2002).
- (19) Z. Slanič, D. P. Belanger, and J. A. Fernandez-Baca, Phys. Rev. Lett. 82 426, (1999).
- (20) V. V. Prudnikov and V. N. Borodikhin, cond-mat/0510052 (2005).
- (21) D. P. Belanger, Brazilian J. of Physics 30, 682 (2000).
- (22) W. C. Barber and D. P. Belanger, J. Magn. Magn. Mat. 226-230, 545 (2000).
- (23) A. Pelissetto and E. Vicari, Phys. Rep. 368, 549 (2002).
- (24) R. Folk, Yu. Holovatch, and T. Yavors’kii, Phys. Uspekhi 46, 175 (2003).
- (25) P. Calabrese, A. Pelissetto, E. Vicari, Phys. Rev. B 68, 092409 (2003)
- (26) A. R. King, V. Jaccarino, D. P. Belanger, and S. M. Rezende, Phys. Rev. B 32, 503 (1985).
- (27) J. Mydosh, A. R. King, and V. Jaccarino, J. Magn. Magn. Mat. 54-57, 47 (1986).
- (28) W. Kleemann, A. R. King, and V. Jaccarino, Phys. Rev. B 34, 479 (1986).
- (29) L. J. Shelton, F. Ye, W. C. Barber, L. Zhou, D. P. Belanger, J. Magn. Magn. Mat. 272-276, 1302 (2004).
- (30) T. Granzow, Th. Woike, M. Wöhlecke, M. Imlau, and W. Kleemann, Phys. Rev. Lett. 92, 065701 (2004).
- (31) W. Kleemann, J. Dec, P. Lehnen, R. Blinc, B. Zalar, and R. Pankrath, Europhys. Lett. 57, 14 (2002).
- (32) V. S. Dotsenko, cond-mat/0603713 (2006).
- (33) D. Lancaster, E. Marinari, and G. Parisi, J. Phys. A: Math. Gen. 28, 3959 (1995).
- (34) J. H. Meinke and A. A. Middleton, cond-mat/0502471 (2005).
- (35) E. T. Seppälä, A. M. Pulkkinen, and M. J. Alava, Phys. Rev. B 66, 144403 (2002).
- (36) M. M uller and A. Silva, Phys. Rev. Lett. 96, 117202 (2006).
- (37) F. Colaiori, M. J. Alava, G. Durin, A. Magni, and S. Zapperi, Phys. Rev. Lett. 92, 257203 (2004).
- (38) J. van Duijn, B. D. Gaulin, M. A. Lumsden, J. P. Castellan, and W. J. L. Buyers, Phys. Rev. Lett. 92, 077202 (2004).
- (39) P. Miltényi, M. Gierlings, J. Keller, B. Beschoten, G. G untherodt, U. Nowak and K. D. Usadel, Phys. Rev. Lett. 84, 4224 (2000).
- (40) W. Kleemann, J. Non-Cryst. Solids 307-310, 66 (2002).
- (41) A. Moreo, M. Mayr, A. Feiguin, S. Yunoki, and E. Dagotto, Phys. Rev. Lett. 84, 5568 (2000).
- (42) E. Dagotto and A. Moreo, J. Magn. Magn. Mater. 226-230, 763 (2001).