Vorticity Banding During the Lamellar-to-Onion Transition in a Lyotropic Surfactant Solution in Shear Flow
Abstract
We report on the rheology of a lamellar lyotropic surfactant solution (SDS/dodecane/pentanol/water), and identify a discontinuous transition between two shear thinning regimes which correspond to the low stress lamellar phase and the more viscous shear induced multi-lamellar vesicle, or “onion” phase. We study in detail the flow curve, stress as a function of shear rate, during the transition region, and present evidence that the region consists of a shear banded phase where the material has macroscopically separated into bands of lamellae and onions stacked in the vorticity direction. We infer very slow and irregular transformations from lamellae to onions as the stress is increased through the two phase region, and identify distinct events consistent with the nucleation of small fractions of onions that coexist with sheared lamellae.
pacs:
83.Rheology and 83.60.WcFlow instabilities and 83.80.QrSurfactant and micellar systems, associated polymers1 Introduction
Surfactant lamellar phases have a wide range of flow - induced behaviour including shear thickening RND93 ; Bergenholtz_Langmuir_1996 , shear thinning RND93 ; Diat_JPhys_II_93_2 , shear induced structures RND93 ; Bergenholtz_Langmuir_1996 ; DRN93b and shear-induced phase separation RND93 ; Bergenholtz_Langmuir_1996 ; Hoff94 ; DRN93b ; FMG95 ; Pani+98 ; Kleman96 ; zipfel . In one of the most dramatic transitions, discovered by Diat and Roux, shear flow can transform some lamellar phases can into multi-lamellar vesicles, or “onions” RND93 ; Diat_JPhys_II_93_2 . In the SDS/ dodecane/ pentanol/ water system, stronger shear flow eventually destroys the onion phase in favour of either a highly aligned lamellar phase or multicylindrical “leek-like” structure wunenberger_EurPhysJE_00 . This is an example of a shear induced microstructural phase transition. Other microstructural transitions have also been reported for lamellar phases made from different ingredients. For example, an SDS/ octanol/ brine mixture exhibits a transition from the lamellar to the sponge phase at CHerve93 . At low imposed shear stresses the same system features a transition from a liquid onion phase to an ordered phase of onions organised into flat planes sliding over one another Sierro95 . Conversely, for high enough shear rates, a certain SDS/ decanol/ water mixture undergoes a transition as a function of increasing decanol fraction, from the -orientation, consisting of lamellae that slide over each other with layer normals parallel to the flow gradient direction, to the -orientation, consisting of lamellae that lie in the shear plane with layer normals in the vorticity direction Zipfel99 . Interesting kinetics have been seen in other lyotropic lamellar phases, such as cylindrical or leek-like intermediates during the transition from lamellae to onions zipfel . In this work we revisit the transition originally found by Diat and Roux in SDS/dodecane/pentanol/water, and study the lamellar-to-onion (L-O) transition region in more detail.
The onion phase is of great interest to the chemical industry: onions form in a variety of different surfactants and lipids, and the size is easily controlled by the magnitude of the applied shear rate or shear stress . As a result, onions can be designed for specific tasks such as micro-encapsulation of drugs or colour pigment. From an academic viewpoint, the shear-induced transition from lamellae to onions is a topology-changing transition that is still poorly understood, despite growing knowledge of defects in lamellar and condensed media klemanbook . Unresolved issues about the L-O transition include the mechanism of instability, physical nature of the transformation, possible phase coexistence between sheared lamellae and onions, the compatibility between onions and lamellar orientation, and the role of dislocations. We will argue below that the L-O transition is an example of “shear banding”, or separation of material into macroscopic bands of material. In this case the signatures are consistent with bands stacked along the vorticity direction, rather than the more conventionally seen layering in the flow gradient direction olmsted99c .
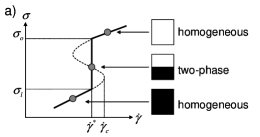
The best studied examples of shear banding are in solutions of entangled wormlike micelles in strong shear flows Khat+93 ; rehage91 ; Cate90 ; Cate96 . Flow induces an instability to a well-aligned and high viscosity state, such that under imposed strain rate conditions the fluid “phase separates” into macroscopic regions of material flowing at different shear rates, along a stress plateau that spans a range of shear rates (Fig. 1)SCM93 . The shear-induced band of lower viscosity material increases in size as the average shear rate is swept across the plateau, and the shear bands are separated along the flow gradient direction (gradient shear banding), consistent with a common stress between bands. Gradient shear banding has been observed in dilute wormlike micelles using techniques such as magnetic resonance Call+96 , ultrasonic velocity profiling Becu04 and optical birefringence microscopy lerouge .
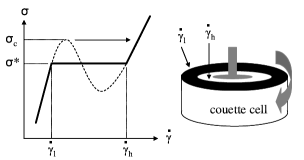

Shear bands can also form along the vorticity direction (Fig. 1) OlmsLu97 . This condition could be realized when two states, such as a fluid and induced gel, have multiple stresses for a range of strain rates. Phases with coexisting shear stresses do not violate the momentum balance as long as neighbouring bands are separated in the vorticity direction, although a normal stress condition must still be satisfied to determine the coexisting strain rate . Thus, vorticity shear bands have different shear stresses whose sum must equal the total applied stress. For a shear thickening transition the corresponding rheological flow curve of such a material would exhibit a characteristic step increase of shear stress at a critical shear rate Olms99 , as shown in Fig. 1.
The original work of Diat and Roux Diat_JPhys_II_93_2 showed a vertical step at a critical shear rate (in their most concentrated surfactant bilayer solution, ), which suggests that the SDS system is a candidate for vorticity banding. They also reported seeing structures along the vorticity direction, but in the range of shear rates associated with the transition between onions and the higher shear rate phase (either multicylindrical “leeks” or well aligned lamellae). Vorticity banding associated with a thinning transition, the alignment of a polydomain colloidal crystal in solution, was also been observed but not noted as such by Chen and Zukoski ChenZAHSBG92 ; ChenCAZ94 . More recently, Callaghan and co-workers, using magnetic resonance imaging, observed what is apparently a combination of vorticity and gradient banding in a semidilute wormlike micelle solution in a cone and plate geometry callaghan . Fisher and co-workers have also observed structure formation along the vorticity direction in another wormlike micelle solution WFF98 .
Here we study the shear induced microstructural L-O transition in the SDS system first studied by Diat and Roux, focusing on vorticity shear banding signatures. The paper is organised as follows. In section 2 we briefly describe the system and the experimental setup for measuring the rheology. In section 3, we summarise the homogeneous flow behaviour of the lamellar phase beginning with the low stress yield behaviour. In section 4 we study the macroscopic nature of the lamellar to onion transition and investigate effects of experimental protocol on the existence of the transition region. We finish with a discussion.
2 System and Experimental Details
2.1 Sample preparation
The lyotropic lamellar phase under study is a quaternary mixture of sodium dodecyl sulphate (SDS), pentanol, dodecane and water. The materials were supplied by Aldrich Chemicals and used without further purification. Millipore multi-Q water with a resistivity better than 18.0 MOhm cm was used throughout. The lamellar phase is most easily obtained by diluting a concentrated lamellar phase (weight fractions of 47.4% water, 22.0% pentanol and 30.6% SDS) with an oil mixture (weight fractions of 92.0% dodecane and 8.00% pentanol). The lamellar phase exists along a very wide range of this dilution line. In Ref. Diat_JPhys_II_93_2 these two mixtures were first prepared separately and then mixed. Since this method often resulted in an inhomogeneous solution we mixed the required proportions of the constituent materials directly by shaking vigorously for several minutes. After shaking, the solution was placed in an oven at for several days.
At equilibrium, this phase comprises layers of water surrounded by surfactant separated by dodecane. Pentanol acts as a co-surfactant and occupies the oil part of the phase. At room temperature, the solution forms a lamellar phase for a large range of dodecane concentrations (, where denotes the weight fraction of dodecane in the mixture) safinya . The bilayers are stabilised by thermal undulations rouxsafinya88 , with a layer spacing ranging from 5 nm to 20 nm depending on the concentration of the phaseDiat_JPhys_II_93_2 . In this work we investigate lamellar phases with dodecane concentrations .
2.2 Rheology
A Rheometrics Scientific SR500 stress controlled rheometer was used throughout. A cone and plate geometry with a 40 mm diameter cone with angle radians was mounted on the rheometer stress head. A home-made Perspex solvent trap was used to minimize solvent evaporation. The plate was thermostatted using a water cooling system, and all experiments were performed at C.
Sweep experiments are performed by imposing an initial stress after sample loading. The shear stress range is . For larger stresses, depending on the concentration, the sample often spurted out of the cell, with the more viscous lamellar phases (lower ) being ejected at a lower stress. During the sweep experiments, successive stresses were imposed for either (a) a prescribed time or (b) until steady state criteria are reached. These criteria (or steady state test) identify an early steady state where the steady state is defined as the point where the shear rate remains within an “acceptance window”.
In the steady state test the measured shear rate is monitored as a function of the elapsed time since the previous stress increment. The steady state is defined according to the RMS fluctuations of the shear rate around the mean shear rate,
| (1) |
where the angle brackets and overbar denote a time average over the previous 5%() of the current duration of the test. Typically the condition or was used. If the sample does not fall below set value for within the maximum delay time , then the stress is incremented to the next stress in the series. Unless otherwise stated, .
3 Non-linear rheology
Previous work on this system suggests the following succession of phases as a function of shear rate for the SDS/dodecane/pentanol mixture RND93 ; Diat_JPhys_II_93_2 ; Pani+98 ; Cristobal.Rouch.ea01 ; Courbin.Delville.ea02 ; Courbin_PhysRevE_04 . An aligned smectic with no defects is solid like for flows that deform the layer spacing or induce bending, and fluid for flows that induce only layer sliding or in-layer flows. In principle a highly defected phase is solid-like with a yield stress due to defects; the yield stress is expected to be history dependent Colby_EuroPhysLet_01 . Upon applying a shear stress above the yield stress the layered phase flows, with layer alignment generally in the orientation, in which layer normals are parallel to the flow gradient direction Diat_JPhys_II_93_2 . The system flows until a critical shear rate or shear stress is reached (see below for a discussion), at which point the flowing lamellar phase is thought to undergo an undulation instability similar to the Helfrich-Hurault instability RND93 ; marlow02 ; wunenberger01 ; zilman99 ; Courbin.Delville.ea02 to an onion phase. Candidate mechanisms for this undulation instability include local dilational stresses due to defects or wall asperities RND93 , “wrinkling out” of fluctuations into long wavelength modes in materials with no defects zilman99 , or a change in preferred layer spacing due to reduced collisions, which leads to an effective dilational strain marlow02 . Following a discontinuous step in the shear rate, the sample is entirely converted to onions.
When the sample reaches a steady state the onions are monodisperse with radii of the order of a few microns RND93 ; meyer . The size can be heuristically understood as a balance of elastic deformation and viscous forces between onions RND93 ,
| (2) |
where and are the mean and Gaussian curvature moduli of the layers, is a viscosity, and is the smectic layer spacing. This approach works best when the viscosity used is the solvent viscosity rather than the apparent viscosity (i.e. flow only occurs between onions)Courbin_PhysRevE_04 . Note that this argument does not address the mechanism by which onion sizes adjust, which involves other processes such as peeling and accretion of layers, internal layer collapse in the onions due to high internal stresses, and expulsion and absorption of solventLeon_JCondMat_02 . Panizza and co-workers measured the size to be
| (3) |
where and when the dodecane oil concentration was Pani+98 . The onions decrease in size with increasing shear rate, and at higher shear rates are unstable with respect to a well-aligned lamellar phase with few defects. The flow curves are consistent with a gradient banding coexistence of states along a stress plateau, although this coexistence has not been well-studied and the flow curves were measured using imposed stresses resulting in a discontinuity between the onion flow branch and the well aligned lamellar flow branch Diat_JPhys_II_93_2 .
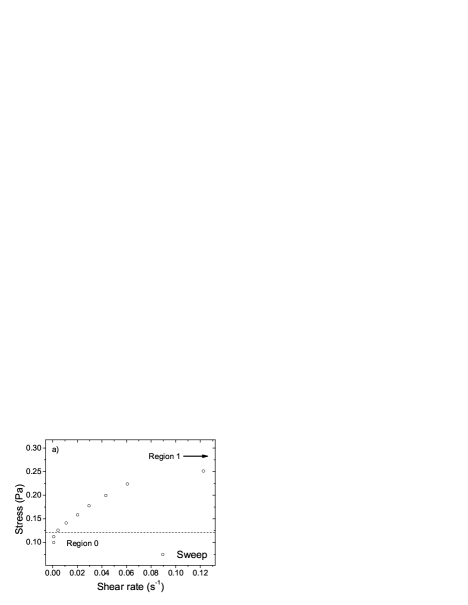
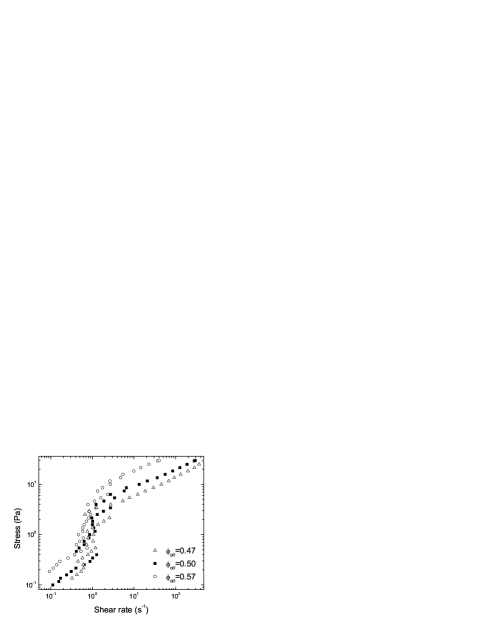
To illustrate these different regimes, figure 2 shows the flow curves measured using the sweep experiment protocol described above for oil concentrations (Fig. 2a and 2b) and (Fig. 2c). The apparent yield stress for the most concentrated membrane phase (, which corresponds to a layer spacing Courbin.Delville.ea02 ) is Pa. Meyer et al. argued that the yield stress is that stress needed to deform a network of dislocations with average spacing meyer :
| (4) |
where is the smectic compression modulus, and , where is the Burger’s vector of the dislocation. This leads to an estimated defect spacing of nm with membranes between defects. Meyer and co-workers estimated for a thermotropic system (8CB), and for a lyotropic system (quasi-ternary ammonium surfactant cetylpyridinium chloride, hexanol and brine), quite close to the value we find in the SDS solution.
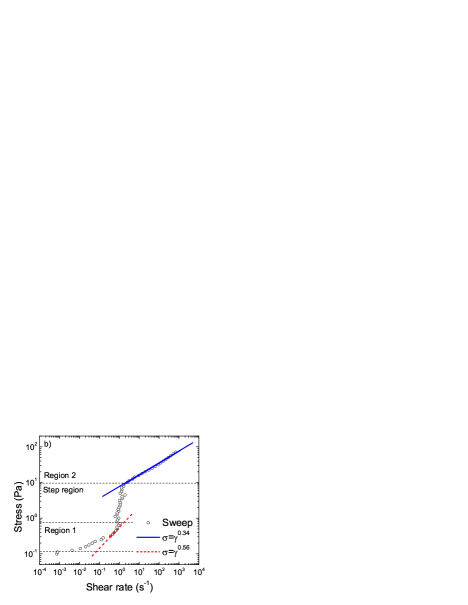
After yielding, the sample flows with severe shear thinning from to Pa (Region 1, Fig. 2 b). Depending on the region of fitting, the flow curve may fit a power law,
| (5) |
where when the data are fit over the range , but if the data are fit over the range . Hence the data do not reliably support one particular power law. The shear thinning behaviour in region 1 exhibits a small yet reproducible discontinuous jump in the shear rate, similar to a stress plateau, that separates the different power law fits. This could be related to wall slip or some complicated yielded banded flow as recently proposed by Picard and co-workers Picard_PhysRevE_05 . This type of complex behaviour could explain the difficulty in reaching a steady state. An exponent of was predicted by Meyer et. al. meyer and Colby Colby_EuroPhysLet_01 for defected lamellar phases by adapting the Orowan equation for high temperature creep due to defects in metals and alloys to describe plastic flow of defected lamellae. Similar arguments were recently used in Ramos_PRL_2004 in a phase of defected hexagonal micelles.
We will argue below that the stress step, or cliff, near corresponds to a coexistence of lamellae and onions. The putative onion-lamellae coexistence region spans stresses Pa to Pa at a strain rate for , followed by the homogeneous onion phase (region 2) at higher stresses. The onion phase shear thins according to
| (6) |
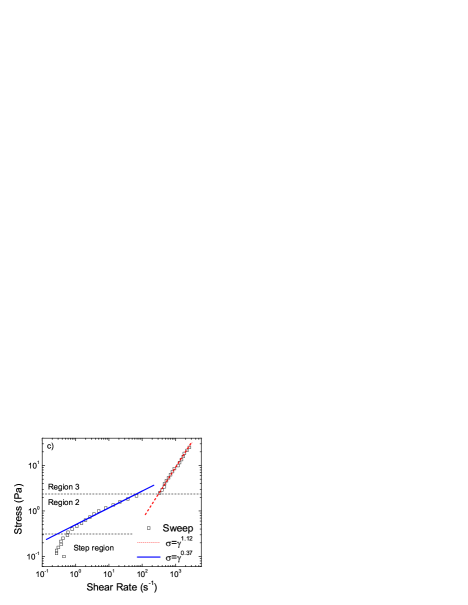
where . This result agrees with studies on similar systems Courbin_PhysRevLett_04 ; Bergenholtz_Langmuir_1996 ; meyer ; RND93 . In the dilute sample the onion microstructure is apparently destroyed at high stresses, and is replaced by a structure (region 3) whose behaviour is closer to Newtonian, Diat_JPhys_II_93_2 . The flow curve in the transition between regions 2 and 3 is consistent with gradient shear banding, but we have not studied this in detail. A stress plateau would only be seen under controlled shear rate conditions . Another possibility is vorticity banding in which the high shear rate phase has a lower stress; in this case a negative apparent flow curve could be seen under controlled strain rate conditions Olms99 . The high shear lamellar phase is only measurable by the SR500 rheometer for the most dilute lamellar phase (). For more concentrated systems the transition occurs at a higher stress Diat_JPhys_II_93_2 and the sample was expelled from the cone and plate geometry before this region was reached. We do not know whether this is an inertial, surface, or normal stress instability.
The stress at which the lamellae to onion transition occurs decreases weakly with increasing oil fraction, or equivalently decreasing layer spacing (Fig. 3). Hence, more dilute lamellar phases appear to require a lower stress to induce the onion phase.
The measured rheology between region 1 (lamellae) and region 2 (onions) depends upon the experimental protocol. Figure 4 shows stress sweeps at increasing sweep times from s to s where is the sweep time calculated from the number of seconds per decade of imposed stresses. The shear rate at which the stress cliff occurs decreases as is increased. The non-monotonic ‘S’ bend present in all the non-equilibrium flow curves. The S bend appears to shift to lower stresses for slower sweeps, which implies that the lamellar phase can lose stability quite slowly, and is broadly similar to nucleated behaviour. Stress sweeps with sweep times s exhibit two features in the shear rate cliff. The first, already noted, is the nonmonotonic S bend and occurs at the termination of region 1. The second is the vertical ‘shoulder’ which occurs before the beginning of region 2. The shoulder is most prominent for the slowest sweeps. The slowest sweeps (s and s) almost superpose during the step region, with the S bend and the shoulders occur at similar shear rates.
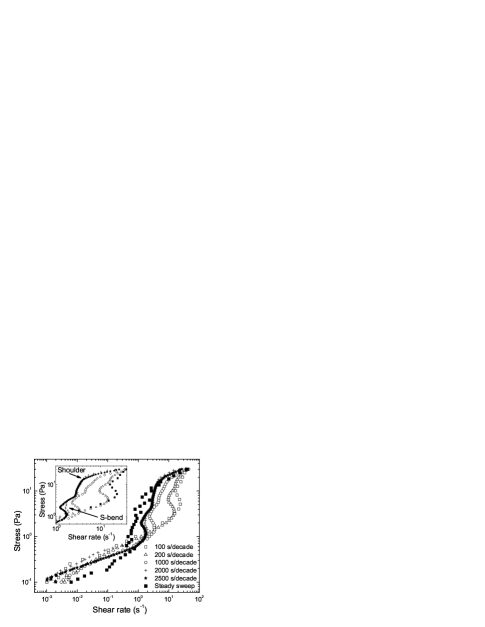
The slope of the low stress lamellar phase branch changes with the sweep time. The branches are fit with the power law where the exponent ranges from depending on the sweep time (Table 1). The slowest stress sweeps shear thin with the smallest exponent, , which could indicate that fewer defects have been produced or that more defects have been removed. The transformation from lamellae to onions is thus very slow. A couple of possible mechanisms could be: (1) a Helfrich-Hurault like undulatory instabilty that grows slowly and takes a long time to convert to onions; or (2) a slow nucleation process. The flow curves measured for the slow stress sweeps reach the onion flow branch at lower shoulder stresses () as shown in the table and figure. Perhaps this is due to the slow conversion to onions, such that for fast sweeps the conversion occurs at larger .
We can also interpret the S bend described above as a feature associated with the formation of onions. The backwards S is consistent with progressive stress inducing more onions hence decreasing the shear rate. The forwards S at higher stresses implies that any contribution to the measured shear rate from conversion of lamellae to onions (which would lead to decreasing shear rate) is overwhelmed by the tendency of the onions to act normally and flow faster. Since there are many more onions at higher stresses their effect is far greater.
| (Pa) | (s-1) | ||
|---|---|---|---|
| 100 | 30.0 | 40.3 | 0.342 |
| 200 | 23.9 | 16.9 | 0.338 |
| 1000 | 19.1 | 10.7 | 0.283 |
| 2000 | 16.3 | 4.2 | 0.246 |
| 2500 | 16.3 | 4.2 | 0.235 |
4 Evidence for vorticity shear banding
4.1 Flow segments and discontinuous shear rate jumps
We have shown above that the measured flow curve is very senstive to the sweep time in the region of the lamellar to onion transition, in the step region. In this section we focus in more detail on the rheology in this region. Stress sweeps were performed with 15 stress increments per decade and a maximum stress step time of giving a maximum sweep time of , which is significantly longer than the sweep times applied above (Fig. 4). The steady state condition was set to .
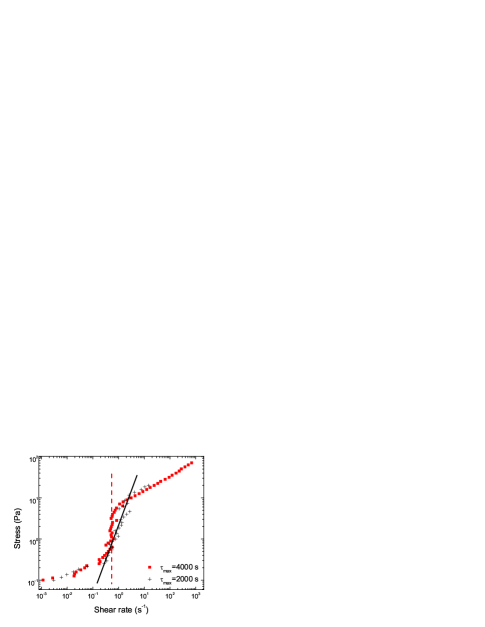
Figure 5 presents flow curves with sweep criteria and . It is clear that slower sweeps (larger ) produces a more vertical step region. However, increasing does not significantly alter the flow curves in region 1 and region 2; this contrasts what we reported for fixed time stress sweeps (see Fig. 4) where altering the sweep time () affected both the slope of the flow curve in region 1 and the step region. Furthermore, the critical shear rate is similar for both sweeps regardless of the duration of ( for the faster sweep and for the slower).
Figure 5 indicates jagged behaviour during the step region, during which the measured shear rate oscillates between and a larger shear rate. The fast stress sweep is more jagged than the slow sweep. On closer inspection of the step region one notices a series of intermediate flow segments with slopes slightly steeper than the lamellar constitutive curve, separated by discontinuous jumps to lower shear rates as the stress is increased.
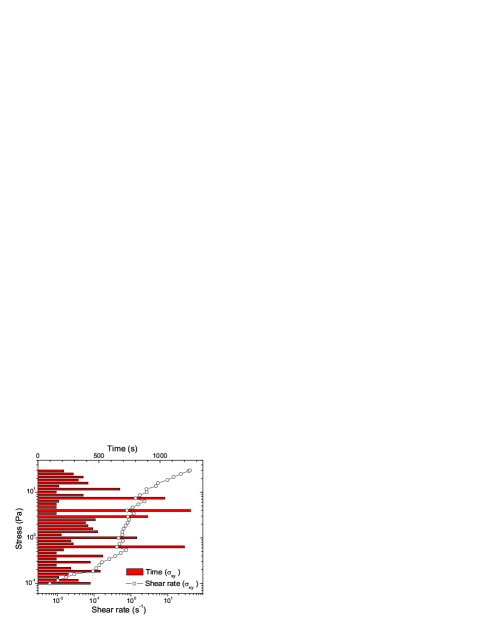
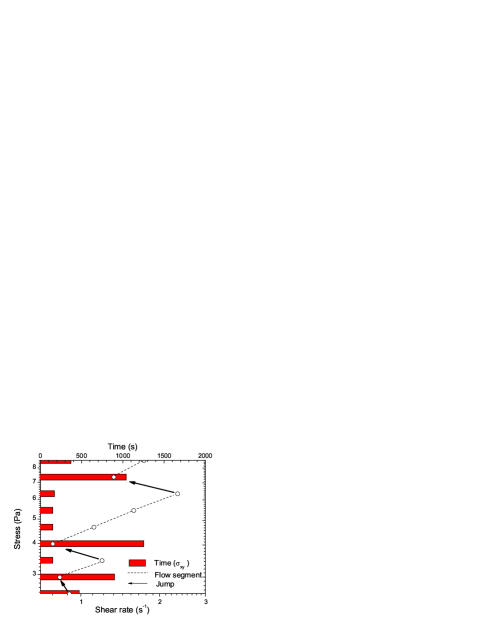
Figures 6 and 7 show the measured flow curves for a stress sweep of a sample with . The jagged behaviour described earlier is apparent in the step region. Also plotted is the steady state time , which is the time neccessary to reach the steady state condition . Along the lamellar and onion flow branches is always a few hundred seconds, and remains fairly constant for subsequent stress increments. However, during the step region varies widely, . There is a strong correlation between and the jagged shape of the step region. Long steady state times occur for jumps, i.e. stress steps that lead to a decrease in shear rate; while the shorter steady state times correspond to moving along the flow segments and increasing the strain rate. This correlation between and jumps and flow segments occurs for stress sweeps of all the concentrations studied and is reproducible.
The step region itself is broadly consistent with vorticity banding between the queiscent lamellar phase and thicker flow-induced onion phase, and we will argue below that the jagged behaviour is due to very slow and complex transformation kinetics between lamellar and onion states.
4.2 Model for stress evolution during vorticity banding
In a vorticity banded state the total imposed stress must equal the sum of the individual stresses in the shear bands,
| (7) |
where is the fraction of material in the onion state (converted from lamellae) and and are the constitutive relations of the onion and lamellae shear band respectively. In true steady state the shear rate at which coexistence between lamellae and onions can occur may be uniquely selected olmsted99c ; olmgov01 , by analogy with the shear stress that is apparently selected in gradient banding olmsted92 ; LOB00 . For materials whose coexisting states have the same concentration the selected shear rate is predicted to be independent of concentration, resulting in a stress “cliff”; while materials in which the coexisting state have different concentrations may have a selected shear rate that depends on stress, or equivalently on olmsted99c ; Olms99 .
For the sake of argument, we first suppose that lamellar-onion coexistence has an ideal constant selected shear rate independent of stress. Consider a vorticity-banded state at a given stress and shear rate , with some fraction of onion material. Upon increasing the stress there are two possibilities:
-
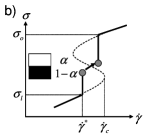
(i)
can remain fixed, with the onion and lamellar phases increasing their shear rates to accommodate the increased stress, and hence following their respective constitutive curves. Successive stresses would lead to a flow branch intermediate between the lamellar and onion branches, given by Eq. (7), as shown in Fig. 8b.
-
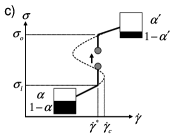
(ii)
can increase as lamellae convert to onions and the shear rate eventually returns to the selected value . This could occur if the lamellar phase no longer “absorbs” the increased strain rate demanded by the stress, but responds either by an instability of by nucleating new onion material (Fig. 8c).
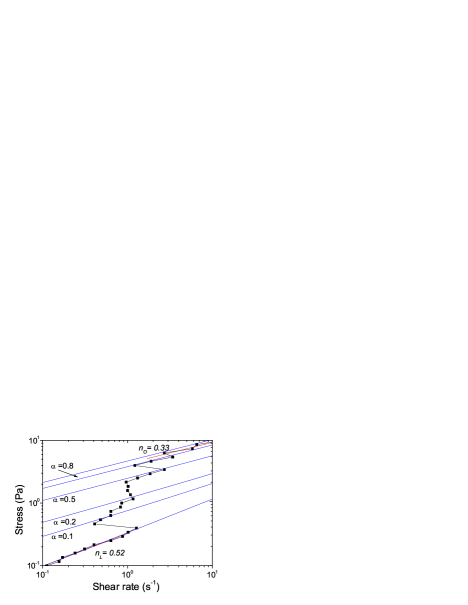
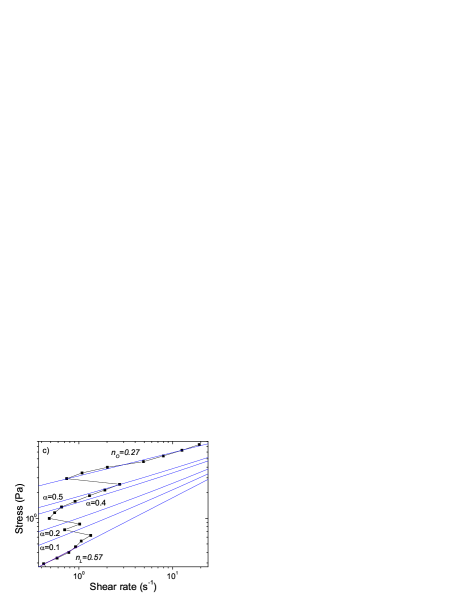
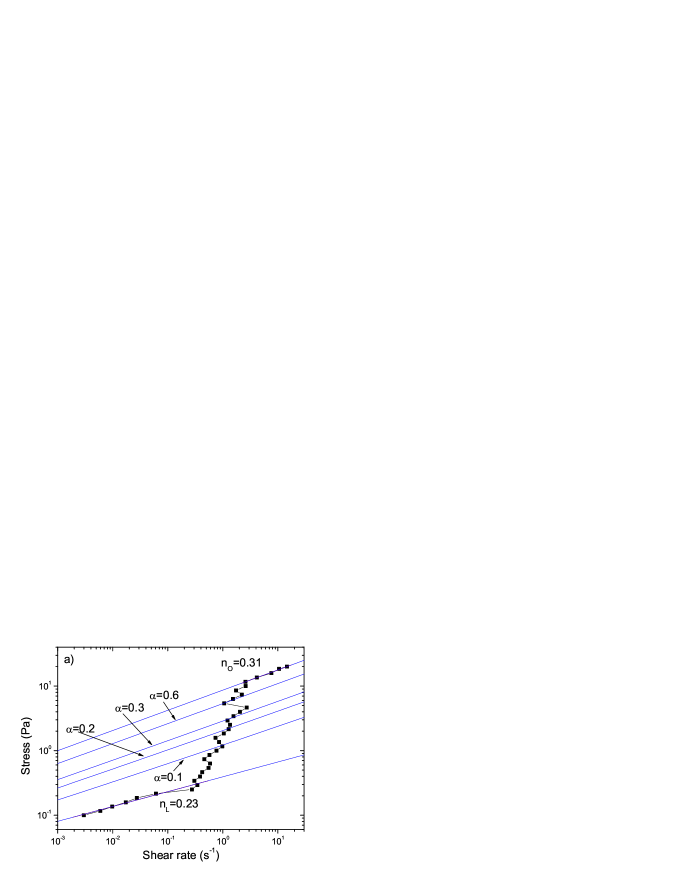
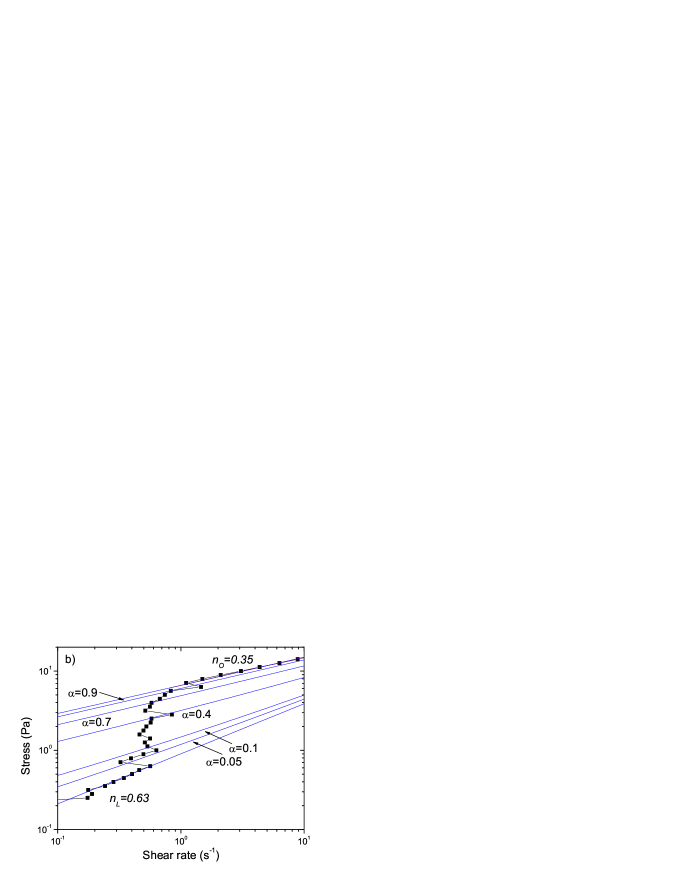
Scenario (i) is consistent with the evolution along flow segments that we find, while scenario (ii) is consistent with the jumps between flow segments. To test this we have extracted the rheology of the lamellar () and onion () branches, and shown the expected rheology of a heterogenous mixture that evolves at constant onion fraction , according to Eq. (7), in Fig. 9 for different onion fractions . It is clear that some of the flow segments follow the fixed flow branches quite well. Fig. 10 shows sweeps with different steady state times ; it is apparent that the two experiments yield similar behavior, but the onset transition is at a lower strain rate for the slower experiment.
This simple picture would, of course, be complicated by very slow transformation kinetics between states. Moreover, it appears that the coexistence strain rate, if there is one, is not constant but slowly increases with stress. This might be expected for a solution, in which the coexistence conditions can be expected to depend on concentration, which leads to a stress-dependent selected strain rate because of a biphasic window in the equivalent non-equilibrium strain rate-concentration phase diagram Olms99 ; OlmsLu97 . We stress the fact that no such phase diagram has been calculated for a lyotropic lamellar system, and that these data are merely consistent with such a phase diagram.

This behaviour of the L-O transition should be contrasted with the well-known kinetic behaviour seen in gradient banding fluids such as wormlike micelles BerrPort99 ; Berr97 ; grand97 ; lerouge2 . Wormlike micelles can phase separate into two bands along a stress plateau for a range of shear rates (Fig. 1a). Upon increasing the shear rate while on the plateau the systems invariably return to the stress plateau, corresponding to an increase in the fraction of the high shear rate phase lerouge2 . By contrast , the SDS mixture we study appears to get “stuck” in the low stress lamellar phase much more easily than the micellar phase gets stuck in the low shear rate phase. There are several possible contributing factors for this:
-
1.
In a vorticity-banded state the interface lies in the shear plane, while in a gradient banded state the shear flow occurs across, rather than within, the interface. The lack of a direct shear force across the interface could lead to slower interface motion.
-
2.
The lamellar and onion phases are not smoothly related by a continuous order parameter; hence one may expect that nucleation-like behavior, should it occur under flow, would be very slow. One candidate for onion formation is a critical shear rate for an undulation instability; it is possible that this instability can be preempted by finite amplitude fluctuations which can nucleate onions below the critical shear rate for the instability, but that these fluctuations are very slow. In the wormlike micellar systems such a nucleation barrier, if there is one, is apparently relatively easy to overcome BerrPort99 ; Berr97 ; grand97 ; lerouge2 .
-
3.
Vorticity banding would present an interface that has no preferred position with reference to the flow geometry. By contrast, gradient banding in cylindrical Couette or cone and plate geometries leads to an interface that lies in a stress gradient set by the curvature of the flow. This stress gradient effectively drives the interface to move until it is at the position of the selected stress olmsted99a ; lerouge2 . There is no such driving force for vorticity banding, which again leads to slow kinetics.
In the steady state tests the times between data points provide further evidence for this interpretation (Fig. 6 shows the time to reach steady state as bars). During flow segments each stress step requires only a few hundred seconds at most before the steady state criteria are satisfied. The discontinuous shear rate “jump” to a lower shear rate takes a long time to reach a steady state within the set criteria. Flow segments are thought to be associated with no or very small changes in microstructure, and shear rate jumps related to events where lamellae are converted to onions. Hence, the time to reach a quasi-steady state at fixed should be governed by the processes associated with moving along the homogeneous flow branches of the lamellar and onion phases. In the lamellar phase this involves changing the steady state defect density meyer , while in the onion phase the onion size should decrease Diat_JPhys_II_93_2 . The very large steady state time indicates a rapid initial change in conditions upon the first thickening event, followed by a slow relaxation to steady state. This would include, in the case of onion formation associated with an increased , the formation of an entire new band of onion phases around the entire circumference of the rheometer, as well as a return of all onion sizes to the larger size expected at the lower shear rate.
To summarise: we suggest that the flow segments correspond to an increasing stress in which the fraction of onion material remains fixed, separated by discrete jump decreases in shear rate that correspond to the formation of new bands of onions. We attribute the slow and irregular /non-reproducible behaviour to the nucleation-like behaviour of onion formation for small increases in stress.
5 Conclusions
In this work we have studied the rheology of a lyotropic lamellar system undergoing a transition between and lamellar and multi-lamellar, or “onion”, phases. The transition is discontinuous, and the flow curves follow distinct forms in the different phases: in the lamellar regime (depending on the region of fitting), and in the onion regime . The latter is consistent with previous measurements Roux_EuroPhysLett_93 , while the former is consistent with theory and experiment Meyer_JPhysEur_2001 . We have also identified a very low strain rate signature consistent with yield due to a defect network, from which we estimate defect spacings consistent with previous work on lyotropic lamellar phases meyer .
The discontinuity in the measured shear stress at a given shear rate rate is a “cliff”, analogous to the stress plateau found in the better understood wormlike micelle system. In shear thinning wormlike micelles the stress plateau indicates macroscopic phase separation into bands of material flowing with different local shear rates; while the cliff in the lamellar/onion case is consistent with bands lamellae and onions stacked in bands along the vorticity axis, which have the same shear rate but different shear stresses. Using a simple model for the superposition of the stresses in the two phases at coexistence, we are able to understand the noisy behaviour along the plateau as due to nucleation (or instability and subsequent slow growth) of onions out of the lamellar phase. Because nothing is expected to break the symmetry along the vorticity axis, we do not expect two large macroscopic bands (of the two phases), but rather a much finer dispersion of bands. Although other groups have reported vorticity banding in colloidal suspensions ChenZAHSBG92 ; ChenCAZ94 and wormlike micelles WFF98 ; callaghan , this is the first explicit attempt to understand the rheology of such a phase separated state.
In another previous study of a lyotropic lamellar system, Bonn et al. visualized vorticity banding in AOT, during transient experiments Bonn+98 . The flow curves in that case exhibited apparent shear thinning, and it is not apparent how the reported bands related to the overall steady state of the materials. Nonetheless, there are probably similar phenomena occuring, at least in part, in the two systems.
Our results thus strongly suggest that the lamellar to onion transition for the quaternary mixture of SDS, water, pentanol and dodecane exhibits vorticity shear banding. Direct observation of the lamellar phase in the vorticity-flow plane during stress controlled shear is necessary to confirm this hypothesis along with further study on the microstructure of the shear bands and this work is currently in progress. Initial birefringence studies indicate vorticity shear bands of differing anisotropies exist in the step region.
We thank the UK EPSRC for financial support, and R. Colby, S. Manneville, J. Dhont and P. Lettinga for advice. We are especially grateful to S. Lerouge for invaluable guidance during the early stages of this work.
References
- (1) D. Roux, F. Nallet, and O. Diat, Europhys. Lett. 24, 53 (1993).
- (2) J. Bergenholtz and N. J. Wagner, Langmuir 12, 3122 (1996).
- (3) O. Diat, D. Roux, and F. Nallet, J. Phys. II (France) 3, 1427 (1993).
- (4) O. Diat, D. Roux, and F. Nallet, J. Phys. I (France)v 3, 193 (1993).
- (5) H. Hoffmann, ACS Symposium Series 578, 2 (1994).
- (6) J. M. Franco, J. Munoz, and C. Gallegos, Langmuir 11, 669 (1995).
- (7) P. Panizza, A. Colin, C. Coulon, and D. Roux, European Physical Journal B 4, 65 (1998).
- (8) H. Mahjoub, K. McGrath, and M. Kleman, Langmuir 12, 3131 (1996).
- (9) F. Nettesheim, J. Zipfel, U. Olsson, F. Renth, P. Lindner, and W. Richtering, Langmuir 19, 3603 (2003).
- (10) A. S. Wunenburger, A. Colin, T. Colin, and D. Roux, Eur. Phys. J. E 2, 277 (2000).
- (11) P. Herve, D. Roux, A. M. Bellocq, F. Nallet, and T. Gulikkrzywicki, J. Phys. II 3, 1255 (1993).
- (12) P. Sierro, Ph.D. thesis, University of Bordeaux, 1995.
- (13) J. Zipfel, P. Berghausen, P. Linder, and W. Richtering, J. Phys. Chem. B 103, 2841 (1999).
- (14) M. Kleman and O. D. Lavrentovich, Soft Matter Physics: an introduction (Springer-Verlag, New York, 2003).
- (15) P. D. Olmsted and C.-Y. D. Lu, Phys. Rev. E60, 4397 (1999).
- (16) A. Khatory, F. Lequeux, F. Kern, and S. J. Candau, Langmuir 9, 1456 (1993).
- (17) H. Rehage and H. Hoffmann, Mol. Phys. 74, 933 (1991).
- (18) M. E. Cates, J. Phys. Chem. 94, 371 (1990).
- (19) M. E. Cates, J. Phys. Cond. Matt. 8, 9167 (1996).
- (20) N. A. Spenley, M. E. Cates, and T. C. B. McLeish, Phys. Rev. Lett. 71, 939 (1993).
- (21) P. T. Callaghan, M. E. Cates, C. J. Rofe, and J. B. A. F. Smeulders, J. Phys. II (France) 6, 375 (1996).
- (22) L. Becu, S. Manneville, and A. Colin, Phys. Rev. Lett 93, 018301 (2004).
- (23) S. Lerouge, J. Decruppe, and C. Humbert, Physical Review Letters 81, 5457 (1998).
- (24) P. D. Olmsted, Europhys. Lett. 48, 339 (1999).
- (25) P. D. Olmsted and C. Y. D. Lu, Phys. Rev. E 56, R55 (1997).
- (26) L. B. Chen, C. F. Zukoski, B. J. Ackerson, H. J. M. Hanley, G. C. Straty, J. Barker, and C. J. Glinka, Phys. Rev. Lett. 69, 688 (1992).
- (27) L. B. Chen, M. K. Chow, B. J. Ackerson, and C. F. Zukoski, Langmuir 10, 2817 (1994).
- (28) M. Britton and P. Callaghan, Eur. Phys. J. B 7, 237 (1999).
- (29) E. K. Wheeler, P. Fischer, and G. G. Fuller, J. Non-Newt. Fl. Mech. 75, 193 (1998).
- (30) C. Safinya, D. Roux, G. Smith, S. Sinha, P. Dimon, N. Clark, and A. Bellocq, Phys. Rev. Lett. 57, 2718 (1986).
- (31) D. Roux and C. R. Safinya, J. Phys (France) 49, 307 (1988).
- (32) C. Cristobal, J. Rouch, P. Panizza, and T. Narayanan, Phys. Rev. E 6401, 011505 (2001).
- (33) L. Courbin, J. P. Delville, J. Rouch, and P. Panizza, Phys. Rev. Lett. 89, 148305 (2002).
- (34) L. Courbin and P. Panizza, Physical Review E 69, 021504 (2004).
- (35) R. H. Colby, L. M. Nentwich, S. R. Clingman, and C. K. Ober, Europhysics Lettters 54, 269 (2001).
- (36) S. W. Marlow and P. D. Olmsted, Eur. Phys. J. E. 8, 485 (2002).
- (37) A. S. Wunenburger, A. Colin, J. Leng, A. Arneodo, and D. Roux, Phys. Rev. Lett. 86, 1374 (2001).
- (38) A. G. Zilman and R. Granek, Eur. Phys. J. B 11, 593 (1999).
- (39) C. Meyer, S. Asnacios, M. Kleman, and C. Bourgaux, Rheologica Acta 39, 223 (2000).
- (40) A. Leon, D. Bonn, and J. Meunier, Journal of Physics: Condensed Matter 14, 4785 (2002).
- (41) G. Picard, A. Ajdari, F. Lequeux, and L. Bocquet, Physical Review E 71, 010501 (2005).
- (42) L. Ramos and F. Molino, Physical Review Letters 92, 018301 (2004).
- (43) L. Courbin, P. Panizza, and J. B. Salmon, Physical Review Letters 92, 018305 (2004).
- (44) J. L. Goveas and P. D. Olmsted, Eur. Phys. J. E6, 79 (2001).
- (45) P. D. Olmsted and P. M. Goldbart, Phys. Rev. A46, 4966 (1992).
- (46) C. Y. D. Lu, P. D. Olmsted, and R. C. Ball, Phys. Rev. Lett. 84, 642 (2000).
- (47) J. F. Berret and G. Porte, Phys. Rev. E 60, 4268 (1999).
- (48) J. F. Berret, Langmuir 13, 2227 (1997).
- (49) C. Grand, J. Arrault, and M. E. Cates, J. Phys. II (France) 7, 1071 (1997).
- (50) O. Radulescu, P. Olmsted, J. Decruppe, S. Lerouge, J.-F. Berret, and G. Porte, Europhysics Letters 62, 230 (2003).
- (51) P. D. Olmsted, O. Radulescu, and C.-Y. D. Lu, J. Rheology 44, 257 (2000).
- (52) D. Roux, F. Nallet, and O. Diat, Europhys. Lett. 24, 53 (1993).
- (53) C. Meyer, S. Asnacios, and M. Kleman, Eur. Phys. J. E 6, 245 (2001).
- (54) D. Bonn, J. Meunier, O. Greffier, A. Alkahwaji, and H. Kellay, Phys. Rev. E 58, 2115 (1998).