Phenomenology of -axis and -axis charge dynamics from microwave spectroscopy of highly ordered YBa2Cu3O6.50 and YBa2Cu3O6.993
Abstract
Extensive measurements of the microwave conductivity of highly pure and oxygen-ordered YBa2Cu3O6+y single crystals have been performed as a means of exploring the intrinsic charge dynamics of a -wave superconductor. Broadband and fixed-frequency microwave apparatus together provide a very clear picture of the electrodynamics of the superconducting condensate and its thermally excited nodal quasiparticles. The measurements reveal the existence of very long-lived excitations deep in the superconducting state, as evidenced by sharp cusp-like conductivity spectra with widths that fall well within our experimental bandwidth. We present a phenomenological model of the microwave conductivity that captures the physics of energy-dependent quasiparticle dynamics in a -wave superconductor which, in turn, allows us to examine the scattering rate and oscillator strength of the thermally excited quasiparticles as functions of temperature. Our results are in close agreement with the Ferrell-Glover-Tinkham sum rule, giving confidence in both our experiments and the phenomenological model. Separate experiments for currents along the and directions of detwinned crystals allow us to isolate the role of the CuO chain layers in YBa2Cu3O6+y, and a model is presented that incorporates both one-dimensional conduction from the chain electrons and two-dimensional transport associated with the CuO2 plane layers.
I Introduction
Microwave conductivity measurements have provided a powerful method for investigating the low energy charge dynamics of high temperature cuprate superconductors. Early on, the observation of a linear temperature dependence of the magnetic penetration depth in YBa2Cu3O6.95 provided some of the first evidence of -wave pairing in these materials.Hardy1 Over a decade later, the -wave superconducting phase remains one of the cornerstones of our understanding of the cuprate problem. Surprisingly, the physics of the superconducting state seems to be well described as a BCS instability of a two-dimensional Fermi liquid. However, it is essential that this conjecture be thoroughly tested, and one of the best ways to do this is through detailed measurements of charge transport in high quality single crystals. In this work we report on microwave spectroscopy of two gold-standard cuprate materials — Ortho-I YBa2Cu3O6.993 and Ortho-II YBa2Cu3O6.50 — and develop a simple phenomenology that describes their low-energy charge dynamics.
Understanding the role of impurities in the cuprate superconductors has taken many years of great effort. The materials have complicated chemistry — containing at least four elements — and have much greater sensitivity to disorder than conventional superconductors due to finite-angular-momentum Cooper pairing. Early measurements on the temperature dependence of the magnetic penetration depth of YBa2Cu3O6+y showed deviations from the linear temperature dependence expected for a clean -wave superconductor. It was later suggested that these effects could be the result of pair-breaking disorder,Annett ; Scalapino a conjecture that was confirmed by showing that the controlled addition of Zn impurities to high quality YBa2Cu3O6+y crystals caused a crossover in from to behaviour.BonnZn ; achkir93 ; BonnCzech Ongoing efforts to uncover the intrinsic physics of the cuprates depend on continued improvements in sample quality. The samples used in this work are the most well-ordered cuprates available, and are of such exceedingly high purity and crystallinity that even the off-plane dopant oxygen atoms are highly-ordered.Ruixing ; Ruixing2 ; Ruixing3
Some of the earliest measurements of the low energy electromagnetic response of the cuprates were made by Nuss et al., who measured the conductivity of YBa2Cu3O7 thin films using terahertz spectroscopy over the frequency range 0.5 THz to 2.5 THz.Nuss The observation of a peak in below the critical temperature was attributed to a strong decrease in inelastic scattering, rather than the conductivity coherence peak that occurs in -wave BCS superconductors. Shortly afterward, Bonn et al. measured a similar peak in in the microwave range.Bonn92 ; Bonn93 They proposed that this was the result of a competition between the rapid increase in quasiparticle lifetime and the decaying quasiparticle density as the temperature was reduced. This analysis was carried out within the context of a Drude model characterized by an energy-independent transport relaxation rate . Other transport measurements including thermal conductivity yu92 and higher frequency electromagnetic measurements romero92 have also confirmed the rapid collapse in scattering on entering the superconducting state.
In a more recent publication, our group presented a series of microwave measurements that confirmed and extended these earlier findings.Hosseini1 This was made possible by two experimental developments: the advent of higher purity YBa2Cu3O6+y crystals grown in BaZrO3 crucibles and the development of a sufficient number of fixed-frequency cavity perturbation systems to map out a coarse microwave conductivity spectrum. Five superconducting resonators, operating between 1 GHz and 75 GHz, were used to examine the surface impedance of the same single crystal sample of fully-doped YBa2Cu3O6.993 over the temperature range 2 K to 100 K (the conductivity inferred from these data is shown in Fig. 6 of the present article). At each temperature the conductivity spectrum was fit to a simple Drude model, which captured the features of the data well, thus supporting the assumptions used in the earlier work. The temperature dependent quasiparticle scattering rate derived from these fits was seen to decrease rapidly below and saturate at a constant value of 6 s-1 below 20 K, corresponding to a spectral width of approximately 9 GHz. Assuming a Fermi velocity cm/s,Zhou the residual scattering rate implies a quasiparticle mean free path of 4 m, a very large distance for a complicated quaternary oxide.
However, the observation of a temperature independent transport relaxation rate is at odds with standard models for the electrical conductivity of a -wave superconductorBerlinsky and resolving this elastic scattering problem is a major goal of the work presented in this article. The strong temperature dependence of the transport relaxation rate at higher temperatures, where the scattering processes are inelastic, has motivated models in which the opening of a gap in the spectrum of electronic excitations in the system leads to a collapse of the inelastic transport relaxation rate.walker00 ; duffy01 Finally, the same set of fixed frequency resonators was used to probe the conductivity for currents along the crystal -axis of Ortho-I YBa2Cu3O6.993. In these measurements, currents are parallel to the CuO chains and reveal an anisotropy in charge conduction that can be attributed to the sum of a narrow CuO2 plane quasiparticle spectrum and a very broad spectral feature arising from the one-dimensional CuO chains.Harris1
Greater insight into the low temperature charge dynamics of YBa2Cu3O6+y was gained following the development of a novel low temperature microwave spectrometer that could measure the conductivity spectrum as a continuous function of frequency.TurnerPRL ; TurnerRSI Spectroscopy of Ortho-II YBa2Cu3O6.50 revealed that the nodal quasiparticle spectrum did in fact contain most of the features expected for weak-limit impurity scattering in a clean -wave superconductor, namely a sharp cusp-like spectrum and a linear-in-temperature spectral width. In contrast, similar spectroscopy of Ortho-I YBa2Cu3O6.993 material displayed much more Drude-like spectra, except at the very lowest temperatures. We return to examining these features in the present article, presenting a complete body of microwave data on Ortho-I and Ortho-II YBa2Cu3O6+y, and show how these data can be described by a simple phenomenlogy that captures the physics of energy-dependent charge dynamics.
The paper is organized as follows. Section II begins with a brief discussion of the two main experimental techniques, fixed-frequency microwave cavity perturbation and broadband bolometric surface resistance spectroscopy. In Sec. IV we use the broadband bolometric surface resistance data to extract detailed conductivity spectra and present a simple phenomenological model of the conductivity. With this in hand, in Sec. V we process data from the five fixed-frequency experiments, which provide a means of capturing the conductivity spectrum at higher temperatures than can be reached with the bolometric experiment. Finally, we examine the two key parameters that emerge from fitting to the experimental data: the width of the conductivity spectrum, which measures the thermally-averaged transport relaxation rate (Sec. V.1) and the total integrated spectral weight or ‘quasiparticle oscillator strength’ (Sec. V.2). Throughout this article we use recently revised absolute values of the penetration depths obtained using a newly developed zero-field ESR absorption method.TamiPRB The revised penetration depths are considerably shorter than existing values in the literature and result in substantial quantitative changes to the previously published quasiparticle conductivity and superfluid density. However, we emphasize that neither the qualitative form of the conductivity data nor the main conclusions drawn from it are affected.
II Experimental Techniques
In this paper we focus on the microwave conductivity, , in the long wavelength limit and in the linear response regime. In experiments that probe the conductivity, the quantity that is inferred from measurements is the microwave surface impedance . When the applied microwave fields are screened on a length scale that is large compared to the characteristic size of the wavefunctions of both the Cooper pairs and the single-particle excitations (the coherence length and mean free path , respectively) it is possible to describe the charge response by local electrodynamics, in which case:
| (1) |
In very clean cuprate samples the mean free path will exceed the penetration depth and the electrodynamics will not necessarily remain in the local limit. However, it is possible to take advantage of the two dimensional electronic structure of the cuprates, which gives rise to a short coherence length and mean free path along the crystal direction, to ensure that the charge response is local.Kosztin-Leggett ; Chang-Scalapino In the work reported here we have exclusively used such geometries.
As pairs condense in a superconductor, the reactive response of the superfluid quickly overwhelms the dissipative response of the quasiparticle excitations, and over most of the temperature range . The local electrodynamic relation then simplifies to the following approximate forms:
| (2) | |||||
From these expressions it is clear that a measurement of the surface resistance contains information about the real part of the conductivity , while a measurement of the surface reactance is a direct probe of the penetration depth . As with nearly all forms of spectroscopy, technical limitations require one to work with incomplete spectroscopic information and subsequently to rely on causality to extract the quantities of interest. Our present work is no exception. However, in this article we present a wide range of measurements that not only allow us to extract the frequency-dependent conductivity, but also provide a set of checks and balances through the oscillator-strength sum rule that let us verify our results in detail.
In these measurements, a well-defined electromagnetic geometry must be used for three reasons: to separate the individual components of the conductivity tensor, to ensure that demagnetization effects are well controlled, and to enforce local electrodynamics. A particularly clean approach that has been widely used is to place the sample in a microwave enclosure near a position of high symmetry, where there is an electric node and the microwave magnetic field is quasi-homogeneous.
Single crystal samples of many of the cuprate superconductors grow naturally as platelets having a broad – plane crystal face and thin -axis dimension. In this case, demagnetization effects are minimized if the broad face of the sample is aligned parallel to the microwave magnetic field. In response to the microwave fields, screening currents flow near the surface of the sample, across the broad – face, closing along the direction to complete a loop. All measurements presented in this article employ thin crystals with negligible -axis contribution, and were carried out in this low-demagnetizing factor orientation.
An experimental feature common to each of the seven sets of apparatus employed in this work is the use of a sapphire hot finger.HotFinger This arrangement allows a sample to be held at an elevated temperature in the microwave fields, while the resonator remains at base temperature. For the field configuration we utilize, the sapphire plate is transparent to microwaves and makes a negligible contribution to the dissipation. The sample is affixed to the sapphire plate (with a very small amount of silicone grease) that is then inserted into the microwave field through a hole in the metal end-wall that is small enough to cut off microwave propagation at the operating frequency. The thermometer and heater are located outside the cut-off hole, in intimate thermal contact with the sapphire isothermal stage, which is in turn weakly linked to the 1.2 K pumped helium bath.
Resolving the microwave surface impedance of small single-crystal cuprate samples over a wide temperature range has been achieved by the use of cavity-perturbation techniques.Bonn-Hardy ; Ormeno In these experiments the sample under test is brought into the microwave fields of a high quality-factor (high-) resonant structure such as a superconducting cavity or a loop–gap resonator. In cavity perturbation, shifts in the resonant frequency and quality factor are related to the surface impedance via:Waldron
| (3) |
The quantity , where is the quality factor of the resonator when it contains the sample at temperature , and is the quality factor of the empty resonator. is the shift in frequency of the loaded resonator on warming the sample from base temperature to temperature . Similarly, . is the absolute surface resistance, and the geometric factor depends on the dimensions of both the cavity and the sample, as well as the geometry of the fields that are being perturbed, and is determined empirically.
The direct relationship in Eq. 3 assumes that the sample is much thicker than the length scale of the electromagnetic screening — either the superconducting penetration depth or the normal-state skin depth. In situations when the screening currents penetrate to a depth approaching the sample thickness, Eq. 3 must be modified. For our YBa2Cu3O6+y samples, which have a thickness , this becomes important only in a very narrow temperature region just below , and in the normal state where the skin depth is large. To account for this effect, we use a model that solves the electromagnetic field equations in our one-dimensional geometry with the microwave field applied parallel to the broad face of the sample.KamalPhD The result is a more complete version of Eq. 3 that explicitly involves the sample thickness :
| (4) |
where is the sample volume, is the effective cavity volume, is a constant set by the type of cavity and its field configuration, and is the complex propagation constant for the electromagnetic field in the sample. For this expression, is modified and is now the shift in frequency on inserting the sample into the empty resonator, . The physical quantities of interest, including , , , and are determined from measurements of and and the relationships and .
While it is possible to calibrate measurements to very good accuracy, cavity-perturbation techniques do not easily yield an absolute value for since a measurement of the absolute penetration depth amounts to a comparison of the total volume of the sample to the volume of the sample minus the small field-penetrated region at the surface of the sample. It is impossible to measure the dimensions of a single crystal sample precisely enough to achieve an absolute measure of the in-plane this way. Recent Gd ESR measurements have provided a breakthrough in absolute penetration depth measurements by using the characteristic microwave absorption of Gd ions lightly doped through the crystal as a magnetic tracer to measure the field-penetrated volume at the surface of the sample directly.TamiPRB
The calibration procedure for the superconducting resonators relies on measurements of well-characterized PbSn samples of similar dimensions as the YBa2Cu3O6+y crystal, as well as runs without any sample at all. These measurements allow for the small corrections necessary to account for background losses and the finite volume of the crystal. Each resonator experiment must be calibrated independently. As a result, there is up to a 10% systematic uncertainty in the overall scale factor at each frequency. Stochastic noise is typically much less than 5% for measurements well below .
In cavity perturbation experiments, the resonator is generally restricted to operate at a single fixed frequency, requiring the use of many separate sets of experimental apparatus to capture a frequency spectrum. Furthermore, the cavity perturbation method requires that the dissipation of the unknown sample be comparable to the dissipation of the cavity itself in order for the absorption to be measured with high precision. This is a strong requirement on the cavity when the sample is a high quality superconductor in the limit. The measurement of the residual absorption in superconductors is challenging at any frequency: in the case of infra-red spectroscopy the problem becomes that of measuring values of reflectance that are very close to unity. In microwave cavity perturbation measurements there is a similar problem of discerning the small difference in cavity Q with the sample in and out. Both techniques have problems with calibration and discerning small differences between two large numbers.
These sensitivity problems are circumvented in a direct absorption measurement. We have recently developed an apparatus capable of obtaining continuous-frequency measurements of the absolute microwave surface resistance in low-loss single crystal samples, which has been described in detail elsewhere.TurnerRSI The instrument employs a bolometric method of detection in which the sample of interest is exposed to a microwave frequency magnetic field whose frequency can be varied, and the corresponding temperature rise is measured. This method relies on the fact that the power absorption in a microwave magnetic field is directly proportional to the surface resistance :
| (5) |
where is the root-mean-square magnitude of the magnetic field at the surface . Measurements of the temperature rise of the sample as a function of frequency directly give . To enhance rejection of spurious temperature variations, the rf power is amplitude modulated at low frequency and the resulting temperature oscillations of the sample are detected synchronously. To provide a frequency-tunable microwave magnetic field, the sample is placed in a custom-made rectangular coaxial transmission line that supports a TEM mode in which the fields lie in the transverse plane and form closed loops around the centre conductor. The line is terminated by shorting the center conductor and outer conductor with a flat, metallic endwall, thus enforcing an electric field node at the end of the waveguide. The sample is positioned with its flat face parallel and very close to the endwall such that it experiences spatially uniform fields over its dimensions. A second metallic reference sample of known absorption is placed in an electrically equivalent position that serves to calibrate the absolute field strength, which varies considerably across the frequency range due to standing waves in the transmission line. This technique has provided a very sensitive means of measuring the broadband surface resistance spectrum in superconducting crystals over the range 0.5 GHz to 21 GHz, permitting the first exploration of the detailed low temperature conductivity line shape in a number of compounds.TurnerPRL ; SibelCeCoIn5 ; DavePrOs4Sb12 The conductivity spectrum can be extracted very simply from using Eq. 2. Our full analysis is slightly more detailed, allowing for the small frequency dependence of the penetration depth that comes from thermally excited quasiparticles.
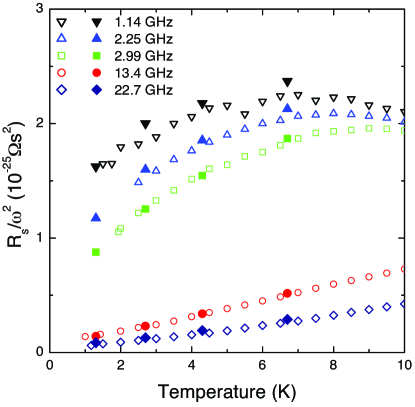
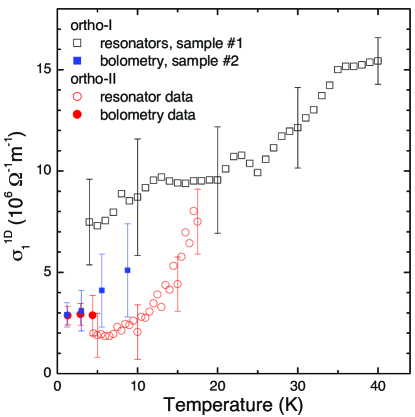
A very convincing verification of the results from multiple sets of experimental apparatus is provided by a comparison of the broadband data with measurements of the same sample in five different superconducting resonators. As seen in Fig. 1, the agreement between the experiments is excellent. In each of the six experiments the absolute value of is determined to better than 10%, with the principle uncertainty coming from the calibration procedure.
III Samples
The bilayer cuprate compound YBa2Cu3O6+y has the distinct advantage that it has a stoichiometric cation composition with a very low level of cross-substitution, less than one part in . Tunable hole doping of the CuO2 planes is achieved by varying the oxygen content of CuO chain layers, which act as a reservoir for oxygen dopants. However, the chains add the complication of an extra one-dimensional conduction channel that acts in parallel with the two-dimensional channel associated with the CuO2 planes. Varying the oxygen content of YBa2Cu3O6+y usually occurs at the expense of introducing off-plane disorder. Fortunately there are several highly-ordered phases for the chain oxygen atoms that are stable at room temperature, and we exploit two of these here. The first is the fully-oxygenated YBa2Cu3O6.993, with Ortho-I order in which every CuO chain is nearly completely filled and K. Optimal doping for YBa2Cu3O6+y occurs at , corresponding to K. Increasing the oxygen content beyond 6.93 reduces . Since adding oxygen to the CuO chains is a diffusion-limited process, filling a millimetre-sized crystal beyond is impractical. For this publication, we have combined measurements on two different Ortho-I crystals to provide a complete data set: sample #1 has =89 K and sample #2 has =91 K. The two samples provided very similar results but with some interesting differences that we attribute to the small difference in oxygen contained in the CuO chains.
The other ordered phase we have studied is Ortho-II, in which the CuO chains alternate between full and empty. Ortho-II order is seen to exist over a wide range of doping, from to , however the most complete chain filling has been found to occur at .Ruixing2 ; Andersen The particular sample used for the present microwave study is very close to this, having and K.
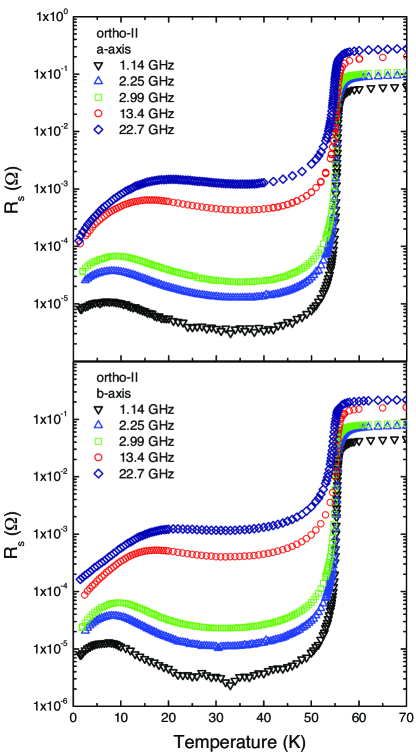
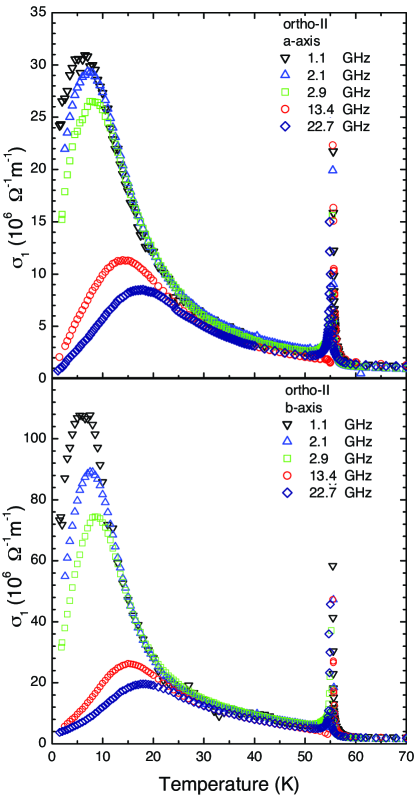
Figure 2 presents fixed-frequency microwave absorption measurements for a high quality crystal of YBa2Cu3O6.50 made in a geometry where the screening currents are along either the or the crystal direction. The surface resistance is seen to drop rapidly, by up to four orders of magnitude, on cooling below , and displays a strong frequency dependence in the microwave range. Much of the frequency dependence of is due to the factor of in Eq. 2 that results from screening by the superfluid. The remaining frequency dependence is due to the quasiparticle conductivity itself. The raw surface impedance data for fully doped YBa2Cu3O6.993 have already been published and are not reproduced here.Hosseini1 ; Harris1
IV Phenomenology
For a superconductor, the conductivity can be expressed as the sum of two conduction mechanisms acting in parallel: one due to charge carriers in the superconducting condensate (denoted by ) and another due to thermally excited quasiparticles (denoted by ):
| (6) |
The superfluid conductivity can be parameterized using the London phenomenology:London
| (7) |
where the temperature dependent superfluid spectral weight is represented by . This is an experimentally accessible quantity that is related to the London penetration depth in the following manner:
| (8) |
The goal of this work is to explore the phenomenology of the superconducting state without assuming a microscopic model for the conductivity of thermally excited d-wave quasiparticles. We extract from our measurements of the real and imaginary components of using Eq. 1, to obtain both the spectral lineshape and its temperature dependence. This process would be straightforward if we could measure both and at each frequency. However, measurements of the frequency dependence of are very difficult to carry out, for reasons that are closely related to the difficulty in measuring absolute penetration depth at a fixed frequency. To carry out the analysis of our broadband data, we therefore use measurements of at one low frequency only (1 GHz) and extend this to higher frequencies using a self-consistent analysis of the surface resistance data. We are helped greatly by the fact that the frequency dependence of is very slight, due to the dominant contribution from the superfluid. The small frequency dependence of is due solely to the weak screening contributions from the thermally excited quasiparticles. Note that we distinguish between the magnetic penetration depth and the London penetration depth that appears in Eq. 12.
IV.1 -axis Phenomenology
We begin by analyzing the microwave conductivity for currents parallel to the crystal -axis. This is perpendicular to the CuO chains, so these should make a negligible contribution to the -axis conductivity. In addition, we expect that the CuO2 bilayer should lead to two nearly identical contributions to , since the splitting between bonding and antibonding combinations of the planar wavefunctions is expected to be weak.Atkinson We will therefore model the -axis conductivity by a single conductivity spectrum due to one effective two-dimensional band.
There is currently no accepted phenomenology to describe the detailed quasiparticle conductivity of a CuO2 plane. Several authors Berlinsky2 ; Waldram97 ; Bonn93 have assumed a Drude-like form:
| (9) |
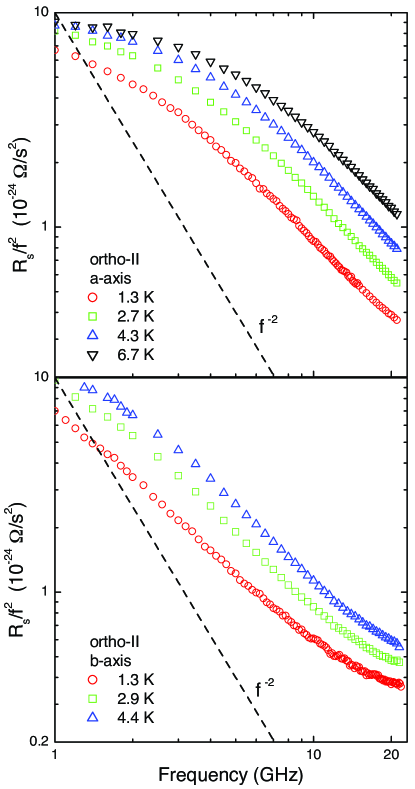
where is the temperature dependent quasiparticle spectral weight (often referred to as ‘normal fluid’) and is the thermally-weighted and energy-averaged quasiparticle transport relaxation rate. While this particular model has proven useful for interpreting qualitative features of the electrodynamics, there is no a priori reason why it should model the quasiparticle conductivity correctly. In fact, broadband measurements demonstrate that the lineshape is distinctly non-Drude-like.TurnerPRL ; corson00 A very clear and simple demonstration of this is obtained by plotting at fixed temperature , as shown in figure Fig. 3 for YBa2Cu3O6.50. Within the low temperature approximation of Eq. 2, is proportional to . The key point is that does not follow a power law at high frequencies, as would a Drude spectrum. The data are much closer to following a power law. Consequently, we have proposed a more realistic phenomenological lineshape to describe the -axis quasiparticle conductivity spectrum in YBa2Cu3O6+y:TurnerPRL
| (10) |
where represents the zero frequency limit of the quasiparticle conductivity, the inverse spectral width, and the anomalous power. Note that this is equivalent to a Drude model if we set .
For the spectrum with , several conditions apply to the use of Eq. 10.Ozcan The expression applies to positive frequencies only, and must be greater than one or the oscillator-strength sum rule will not be satisfied (i.e. will not be integrable). A more subtle point is that the exponent must always eventually reach a high frequency value of 2 since the energy-dependent relaxation rate is cut off by the thermal windowing. However, Eq. 10 provides excellent fits to the spectra presented in this article. Furthermore, Eq. 10 is very useful in modeling the quasiparticle contribution to the imaginary part of the conductivity, because it can be extrapolated and integrated beyond the frequency range of our measurements. It will be shown below that success in preserving the oscillator strength sum rule in the superconducting state supports the use of this phenomenological form as a means of accounting for the normal fluid contribution to screening. Since the electrical conductivity is a causal response function, the real part of the conductivity determines the imaginary part via a Kramers-Kronig relation:OrlandoDelin
| (11) |
where denotes the principal part of the integral.
Using this in conjunction with the measured superfluid response (via Eq. 7) yields a complete expression for the imaginary part of in Eq. 1:
| (12) |
The strategy is to fit broadband data at a given using the phenomenological model for the quasiparticle conductivity (Eqs. 10 and 11) along with measurements of the magnetic penetration depth to parameterize the superfluid conductivity (Eq. 7). For the spectrum at each temperature, we obtain best-fit parameters for , and . Finally, we generate experimental estimates for the real part of the quasiparticle conductivity by solving Eq. 1 for and assuming as given by the best-fit parameters. In many respects this procedure is akin to that used in infrared spectroscopy studies of superconductors, where one needs to extrapolate the measured reflectance to zero frequency in order to utilize Kramers-Kronig relations.Basov The difference is that we need a model lineshape to effectively extrapolate our measurements beyond our maximum measurement frequency , but we do so ultimately for the same purpose. This technique requires sufficient curvature within the experimental bandwidth (i.e. ) for a reliable extrapolation. This approach will be best for low data, where will be governed by elastic scattering of d-wave quasiparticles from very dilute defects in our high purity samples. As we turn to modeling the data at higher , inelastic scattering processes ought to push well beyond . Fortunately, as the spectrum broadens, the quasiparticle contribution to becomes negligible throughout our bandwidth. In this case, one can set and extract from and without requiring any of the corrections discussed above.
IV.2 -axis Phenomenology
Figure 3 shows the broadband -axis surface resistance data for YBa2Cu3O6.50 plotted as versus . While the -axis data seem to asymptotically follow at high frequencies, the -axis data show a change in beyond 10 GHz. In a previous publication we argued that YBa2Cu3O6+y should have a quasi-one-dimensional band whose low energy excitations in the superconducting state are primarily chain-like, and will therefore only contribute to charge conduction along the -axis.Harris1 The chain scattering rate is expected to be much larger than that for the CuO2 planes, and should therefore give rise to a very broad contribution to that can be approximated as a temperature dependent constant over the experimental bandwidth in our analysis. The change in observed above 10 GHz in the -axis spectra, but not in the -axis, is due to this very broad component. In this case the -axis microwave conductivity can then be expressed as a sum of contributions from the two-dimensional bands (a term identical in form to Eq. 10) plus a constant attributed to the quasi-one-dimensional band:
| (13) |
In general, the parameters , and for -axis currents will not be required to match those used to fit -axis data. We extract from data using measurements of and the modeled as described in the previous section (a constant in Eq. 13 will give no contribution to ). The procedure will have limitations similar to those for the -axis case, but the addition of a fourth parameter renders the analysis less reliable as approaches the experimental bandwidth at higher .
V Quasiparticle Conductivity
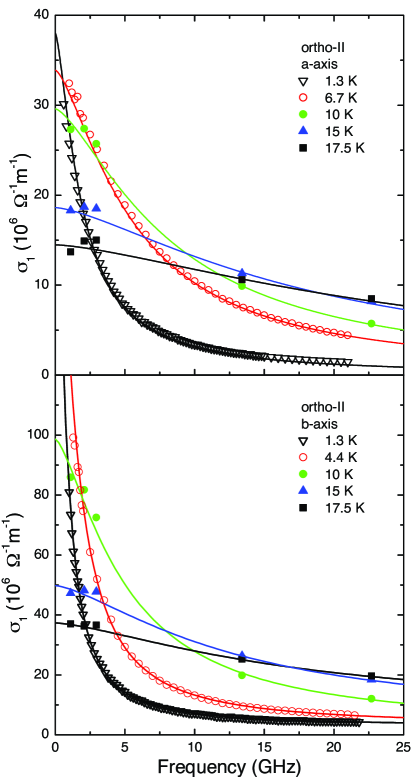
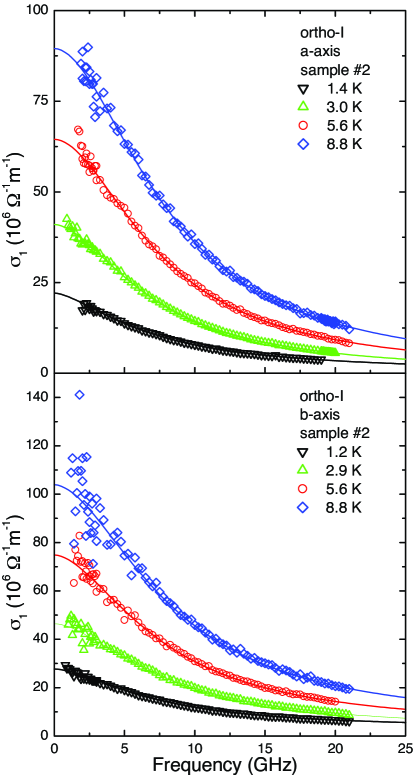
We show the real part of the quasiparticle conductivity spectrum for both in-plane principle directions at representative temperatures for both dopings in Figs. 4–6, as obtained from our surface impedance measurements using the procedures described above. The figures are comprised of data from the broadband experiment (open symbols) and the microwave resonators (solid symbols). We include results from two different Ortho-I samples, denoted sample #1(=89 K) and sample #2 (=91 K), because we did not have a complete set of data (both crystal directions, all sets of apparatus) for a single sample. As will be shown below, the two samples provided very similar results but with some interesting differences that we attribute to the small difference in oxygen contained in the CuO chains. In Figs. 4–6 the smooth lines represent the best fit lineshapes obtained using Eqs. 10 and 13 to describe the and -axis results, respectively. At each temperature our model lineshape appears to reliably capture the high frequency behaviour, however our expressions do not accurately follow the data at the very lowest frequencies, particularly at K. Note that our model for the two-dimensional conductivity term is necessarily concave downwards at low frequency while the lowest temperature bolometry data clearly suggest a cusp. Nonetheless, we argue that our model lineshape provides a reliable means of extrapolating our measurements to high frequency and provides a reasonable measure of the width and spectral weight of the conductivity peaks.
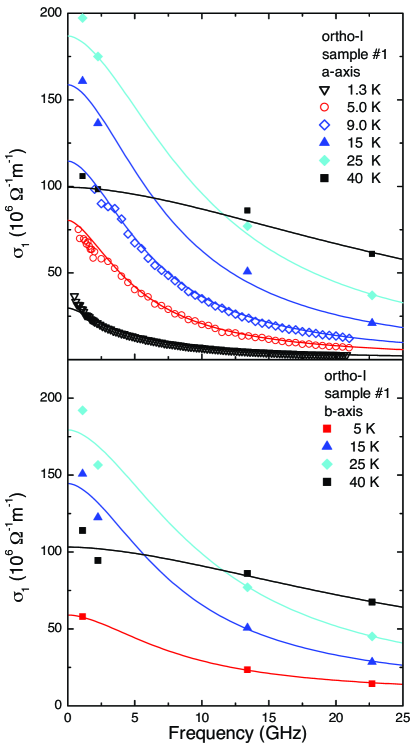
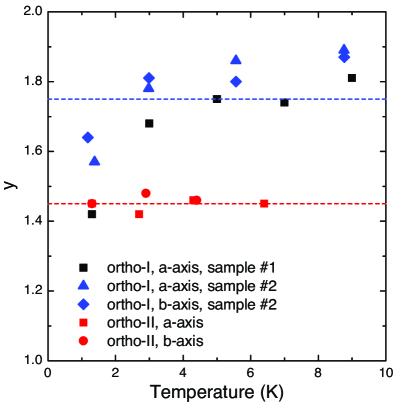
A key point made in the preceding section is that the quasiparticle conductivity spectra we have measured are distinctly more cusp-like than the Lorentzian line shape of a Drude model. In Fig. 8 we present the best-fit values of that were used in Eq. 10 to describe the conductivity data extracted from the bolometry data. Error bars indicate the standard deviation obtained from fitting to as a function of at each given temperature. Two key features are important to observe: First, appears to be crudely isotropic for each doping. Second, displays a relatively weak temperature dependence characterized by a slow increase with increasing temperature, and appears to saturate at approximately and for the overdoped and underdoped samples, respectively.
We now turn to the problem of extracting the real part of the quasiparticle conductivity from our cavity perturbation experiments. In this case we only have measurements at discrete frequencies, from independently calibrated experiments. To help constrain the fits when using such a sparse set of frequencies, we choose to fix at the asymptotic high-temperature values of Fig. 8 before proceeding to extract the real part of the microwave conductivity from . We note that changing ultimately leads to negligible changes in the extracted values of within our experimental bandwidth. However, we will show below that the choice of has implications for the integrated quasiparticle spectral weight and that the values obtained are consistent with the oscillator strength sum rule.Tinkham Representative spectra from the resonator measurements with fits are included in Figs. 4–6.
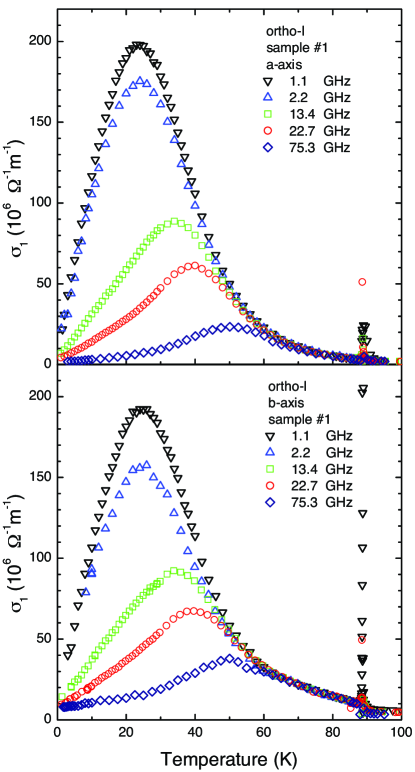
We show extracted from all of the cavity perturbation measurements in Figs. 8 and 9. Note in each plot there is a sharp peak in the curves at due to superconducting fluctuations,Kamal3DXY ; KamalHP in addition to the large, broad peak which shifts to higher temperatures as the measurement frequency is increased. These results can be interpreted in the same qualitative manner as in previous work.Hosseini1 ; Harris1 Neglecting the sharp peaks at , increases smoothly on cooling from the normal state into the superconducting state. The large increase in below can be attributed to a rapid decline in the quasiparticle transport relaxation rate below , combined with an increase in the condensate fraction.Bonn92 ; Bonn93 The frequency dependence of becomes apparent at our measurement frequencies for temperatures below 55 K for the Ortho-I sample and 24 K for the Ortho-II sample. This is in accord with the idea that the peak in the temperature dependence comes from the development of long quasiparticle transport lifetimes.
| Phase | (K) | 6+y | (nm) | (nm) | (nm) |
|---|---|---|---|---|---|
| Ortho-I | 89 | 6.995 | |||
| Ortho-II | 56 | 6.50 |
The degree to which the extraction of from is affected by uncertainties in is an important issue that must be addressed. From Eq. 2, it is clear that . A 20% uncertainty in the absolute value of therefore produces almost a factor of two error in the conductivity although it does not affect qualitative features in . In previous work, we have taken our values from the literature, usually from infrared reflectivity experiments,Basov which are able to resolve the – plane anisotropy. Very recently we have developed an accurate means of determining from broadband zero-field ESR absorption spectroscopy of Gd3+ ions in GdxY1-xBa2Cu3O6+y.TamiPRB The low temperature limiting values of the London penetration depth are quoted in Table 1 for samples of the same quality as those studied in this article, and they differ significantly from the values used previously.Hosseini1 ; Harris1 Note that we quote our values of in Table 1 to better than 10% accuracy based on the redundant measurements and self-consistency checks that were built into our analysis protocol for that work.TamiPRB We have reprocessed the previously publishedHosseini1 ; Harris1 and -axis conductivity data for YBa2Cu3O6.993 and graphed the updated data in Fig. 8.
V.1 Spectral Width
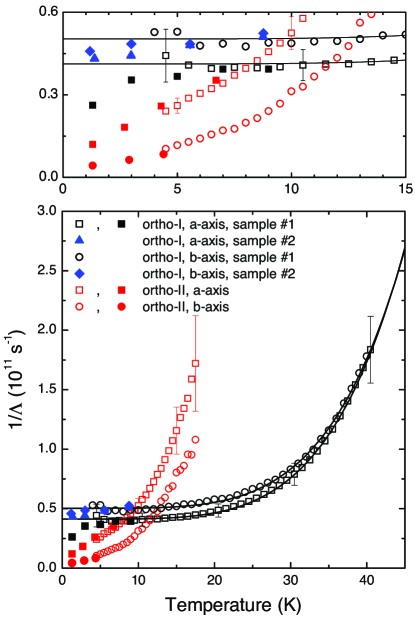
Having extracted the real part of the quasiparticle conductivity from all of our surface impedance measurements, we now turn to a detailed discussion of the best-fit parameters arising from the model in Eqs. 10 and 13 for the -axis and -axis data respectively. To begin, we show the spectral width parameter for both in-plane orientations and both oxygen dopings in Fig. 10. Representative error bars have been included at select temperatures and indicate the standard deviation from fitting to spectra as a function of at each given . The phenomenological parameter is a measure of the energy-averaged quasiparticle transport relaxation rate, even though the energetics of the d-wave superconducting state enter in a nontrivial manner.HPS1 ; HPS2 ; HarrisPhD ; schachinger02 Ultimately, a full microscopic treatment of the charge transport should be used to fit the details of . In the meantime, the phenomenological parameters provide useful insight.
Upon examining the data for the Ortho-I sample in Fig. 10, four key conclusions can be drawn. First, appears to be : isotropic to within our experimental uncertainties. Second, fitting to the parameters arising from the resonator data indicates an average for the low temperature limit of and a temperature dependent component that grows rapidly, either as with , as indicated by the solid lines in the plot, or even exponentially. These observations are consistent with those made in our previous publications.Hosseini1 ; Harris1 ; TurnerPRL Third, we note that the absolute values of the damping reported here (with ) are essentially identical to the values of the Drude scattering rate (with ) reported in our previous work. We can therefore regard the parameter in our phenomenological expression for the conductivity as a meaningful measure of the average quasiparticle transport lifetime. The fourth and final point is that sample #1, with more complete oxygen filling, reveals lower values, while the increased number of oxygen vacancies in sample #2 seem to cause a small broadening of the spectra. However, although the spectra are broader, the approximate isotropy of is retained.
Turning now to the Ortho-II results presented in Fig. 9, a quite different scenario is observed. First, the spectral width parameter is evidently : anisotropic. Furthermore, remains strongly temperature-dependent all the way down to 1.2 K. This latter observation was a critical piece of evidence that led to the conclusion that the -axis quasiparticle conductivity of Ortho-II ordered YBa2Cu3O6.50 is dominated by relatively weak (or Born-limit) scattering from static crystalline defects at low temperature.TurnerPRL ; HPS1 On the other hand, the linear-in-temperature regime apparently extrapolates back to a nonzero value of , which is not in agreement with simple pictures of elastic scattering from weak point-like Coulomb potentials. Rather than scaling with , we shoed that the width of the quasiparticle conductivityspectrum scales as with K.TurnerPRL
The contrast between the overdoped and underdoped values of is striking. As stated above, the spectral width gives the thermally-averaged quasiparticle relaxation rate. Given that the chemical purity and crystallinity of all of the samples studied here are nominally the same, it is somewhat surprising that the conductivity spectra for the two different dopings evolve in a very different manner. In fact, this observation suggests that oxygen doping in the CuO chain layer of YBa2Cu3O6+y has significant influence on the scattering of d-wave quasiparticles in the adjacent CuO2 planes. In addition, the large : anisotropy of the relaxation rate in Ortho-II is a surprising contrast to the approximate istotropy of Ortho-I. The anisotropy is puzzling since the low energy excitations reside near the four -wave nodes along the diagonals of the Brillouin zone, and these excitations must carry both the and -axis currents.
V.2 Spectral Weight
Our phenomenological fits to the conductivity spectra yield the parameters , and . Rather than plot , the zero-frequency intercept of the conductivity, it is instead more insightful to present the integrated spectral weight of the quasiparticle conductivity. This quantity is often referred to as the normal fluid oscillator strength. We obtain the spectral weight by integrating the fitted phenomenological form associated with the two-dimensional bands, and denote this quantity by .
The phenomenological spectrum in Eq. 10 can be integrated in closed form to give:
Values for are given in Fig. 8 for the fits to bolometric measurements and values of (sample #1, Ortho-I) and (Ortho-II) are used for the fits to the cavity perturbation measurements. We use the values of plotted in Fig. 9. By plotting the spectral weight we carry out an important check on both the experiments and the subsequent analysis of the data. The Ferrel-Tinkham-Glover sum ruleTinkham states that the quasiparticle spectral weight and the superfluid spectral weight must add to a temperature-independent constant :
| (15) |
Here, the London penetration depth of Eq. 8 is related to the superfluid spectral weight defined as the sum over all bands that participate in superconductivity:
| (16) |
It should be possible to observe the transfer of spectral weight between the quasiparticles and the superconducting condensate as a function of temperature. The sum rule does not require complete condensation — it is entirely possible that residual quasiparticle oscillator strength will remain as . We will demonstrate that in our YBa2Cu3O6+y samples, up to 3% of the low frequency spectral weight fails to condense. A similar conclusion has been drawn from microwave measurements on Tl2Ba2CuO6±δ and , where at least 10% of the oscillator strength remains as .Ozcan
In Figs. 10 and 11 we show the integrated quasiparticle spectral weight from the two-dimensional bands of YBa2Cu3O6+y. Representative error bars are shown at selected temperatures and were calculated from the standard deviation of the best fit parameters. In addition, we show the corresponding loss of superfluid spectral weight, defined to be:
| (17) |
for both dopings and for and directions.
Errors in the choice of will have a strong effect on the absolute values of spectral weight obtained from our analysis. However, by fortunate coincidence, the uncertainty in affects the the quasiparticle oscillator strength and the superfluid spectral weight in the same way. This can be seen by first noting that at low temperature and low frequency . Second, at low temperature one can write the following approximation for Eq. 17:
| (18) |
where . Therefore the change with temperature of the integrated quasiparticle spectral weight and the superfluid spectral weight both scale as . This is an important result because it allows us to test our data and analysis for consistency with the oscillator strength sum rule in a manner that is insensitive to uncertainties in .
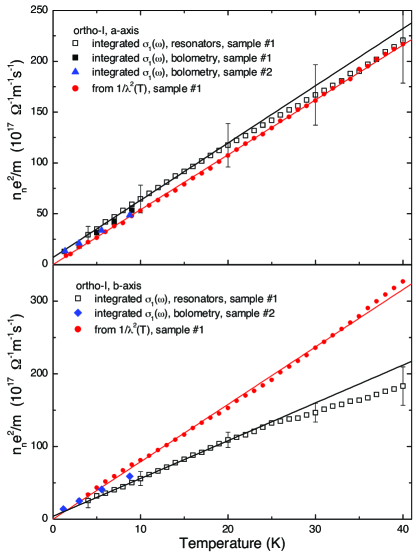
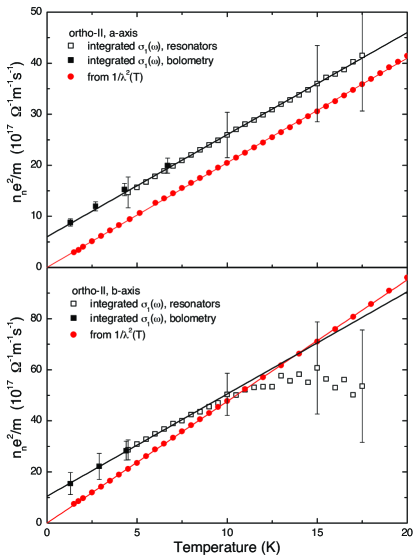
There are three features common to all panels in Figs. 11 and 12. First, the superfluid spectral weight determined from measurements of varies linearly with temperature at low . This is a general consequence of having line nodes in the superconducting order parameter.Scalapino Second, the quasiparticle spectral weight attributed to the two-dimensional bands also varies linearly with temperature at low . The low slopes were obtained by linear fitting to the data of Figs. 11 and 12, and the results are tabulated in Table 2. Third, all of the integrated quasiparticle spectral weight data extrapolate to nonzero values at indicating that a finite fraction of the spectral weight does not condense. Our estimates of the intercepts are tabulated in Table 3. Approximately 0.5% and 3% of the total spectral weight remains uncondensed for the Ortho-I YBa2Cu3O6.993 and Ortho-II YBa2Cu3O6.50 material respectively. The large error bars for the -axis results in Tables 2 and 3 are due to the uncertainty in the fit parameter used to capture contributions from the CuO chain electrons.
| Doping | Orientation | Spectral Weight | Slope |
| () | |||
| Ortho-I | 2D-QP | ||
| sample #1 | from | ||
| 2D-QP | |||
| from | |||
| Ortho-I | 2D-QP | ||
| sample #2 | 2D-QP | ||
| Ortho-II | 2D-QP | ||
| from | |||
| 2D-QP | |||
| from |
The results in Table 2 lead to a critical conclusion: along the -axis, for both dopings, the rate at which the superfluid spectral weight decreases with temperature is equal in magnitude to the rate at which quasiparticle spectral weight increases with temperature. Our results are therefore consistent with the Ferrel-Tinkham-Glover sum rule in both Ortho-I YBa2Cu3O6.993 and Ortho-II YBa2Cu3O6.50. This gives considerable support for the general correctness of the phenomenological lineshape of Eq. 10. Again, we emphasize that this agreement is independent of the exact choice of .
The -axis results in Table 2 reveal that the rate at which the quasiparticle spectral weight attributed to the two-dimensional bands increases with temperature is less than the rate at which superfluid spectral weight decreases with temperature for both dopings. This observation is consistent with the idea that part of the quasiparticle spectral weight resides in the broad spectral feature associated with the quasi-one-dimensional chain-like band. PreviouslyHarris1 we have shown that this is a very broad feature and therefore we cannot estimate its spectral weight. The fit parameter for both dopings is plotted in Fig. 13. Error bars are shown at selected temperatures and indicate one standard deviation in this fit parameter. The resonator measurements on Ortho-I suggest that varies roughly linearly with and extrapolates to a intercept of . The bolometry results on sample #2 suggest a much lower intercept, although the error estimates are substantial. The differences between sample #1 and sample #2 are most likely due to the different filling of the CuO chains in the two samples. Sample #1 with K has an oxygen content of , while sample #2 with was not so carefully controlled. The extent to which the off-plane oxygen atoms affect the microwave conductivity is unclear and will be the subject of future studies.
Extracting precise values of from the Ortho-I bolometry data is difficult since the spectral width of the narrow component is a sizeable fraction of the experiment’s bandwidth at all temperatures. In the Ortho-II case we observe much narrower low spectra which allow more unambiguous extractions of . For Ortho-II, varies nonlinearly with and approaches a low limiting value of . Despite these differences, does not vanish as for either Ortho-I or Ortho-II YBa2Cu3O6+y. This observation is consistent with the theoretical work of AtkinsonAtkinson that suggests oxygen vacancies in the CuO chains of YBa2Cu3O6+y may serve as strong pair breakers.
VI Conclusions
The similarities and differences between the data shown for YBa2Cu3O6.50 and YBa2Cu3O6.993 offer insight into the nature of the in-plane anisotropy in this system, the doping dependence of the inelastic scattering, and the elastic scattering of nodal quasiparticles by defects. Both materials show a very broad component in in the direction parallel to the CuO chains, which is presumably due to the quasi-one-dimensional Fermi surface sheet derived from a CuO chain band hybridized with the CuO2 plane bands. Atkinson showed that such a mechanism is needed to explain the anisotropy of the in-plane superfluid density.Atkinson He also needed to invoke strong pair-breaking by O defects to explain the lack of a low temperature upturn in the -axis superfluid density, an upturn expected if the superconductivity on the chains arises from the proximity effect. This strong scattering would likely explain the broad spectrum of quasiparticle excitations on this Fermi surface sheet.
An important and puzzling issue arises by examining the anisotropy of the transport relaxation rate and temperature dependent spectral weight. In the cuprates, the CuO2 plane currents are carried by nodal quasiparticles. Since the gap nodes lie close to the diagonals of the Brilloiun zone, these excitations carry both and -axis currents. We might therefore expect the transport relaxation rate, as measured by the width of the spectra, to be – plane isotropic. This is indeed the case in the Ortho-I sample: the conductivity spectra have approximately the same width in the and directions, and the temperature-dependent spectral weights agree to within experimental uncertainty. The latter conclusion is sensitive to the choice of , but we conclude that Ortho-I YBa2Cu3O6.993 is well described by a 3-band model consisting of a CuO chain-like band acting in parallel with the bonding/antibonding CuO2 plane bands. However, the Ortho-II results present a surprising contrast. The widths of the conductivity spectra and the temperature-dependent quasiparticle spectral weights differ by a factor of two between the and directions. One of the possible explanations for this anisotropy may be the effect of Ortho-II ordering on the electronic structure of the material. Ortho-II ordering doubles the unit cell of YBa2Cu3O6+y in the -axis direction, and can therefore substantially alter the Fermi surface topology with respect to the fully-doped compound. In particular, Bascones et al. have predicted that Ortho-II ordering can generate two new quasi-one-dimensional bands that are derived entirely from the CuO2 plane state.Bascones This might generate additional nodal quasiparticles derived from the new quasi-one-dimensional bands, increasing the anisotropy of the in-plane conductivity. We leave this issue as an open question for future work in this area, and as a feature that must be kept in mind for any theoretical treatment of this phase.
Figure 10 demonstrates that the rapid collapse of the inelastic scattering below occurs in both of these highly-ordered phases of YBa2Cu3O6+y. One theoretical proposal treats the opening of a gap in the spectrum of excitations that scatters the nodal quasiparticles, including the key detail that Umklapp processes are needed to relax charge currents.walker00 ; duffy01 The dependence of the damping is consistent with exponentially-activated behaviour, the expectation for Umklapp scattering. The activated behaviour arises because there is a minimum threshold quasiparticle wave vector that satisfies the Umklapp requirement. The new results for the Ortho-II phase YBa2Cu3O6.50 are qualitatively consistent with this picture. The damping rises even more quickly, broadening out of the microwave range by 20 K. This could result not only from the lower , but also because changes in the Fermi surface at this lower doping would enhance Umklapp processes by moving the required excitation closer to the nodes as compared to YBa2Cu3O6.993. Unfortunately, a quantitative fit is difficult because of the strong linear term in the elastic scattering in this sample.
Quasiparticle scattering in YBa2Cu3O6.993 and YBa2Cu3O6.50 samples is likely dominated by elastic scattering below about 20 and 10 K, respectively. In both cases, the lowest temperature spectrum at 1.3 K has the cusp-like shape expected for weak scattering.TurnerPRL ; schachinger03 ; Kim However, the YBa2Cu3O6.50 spectra retain the weak-scattering cusp-like form up to higher temperatures where inelastic scattering takes over, but the YBa2Cu3O6.993 spectra take on a more Drude like shape and do not show the temperature independent expected for weak limit scattering. One possible explanation is that the scatterers are neither in the Born nor the unitary limit, something also suggested by recent thermal conductivity measurements.Hill04 In such a case, the shape and temperature evolution depend on the strength of the scattering, the density of scatterers and the size of the superconducting energy gap. Detailed fits to the spectra will be the subject of future work, but one can qualitatively state that the scattering in YBa2Cu3O6.993 appears to be slightly farther from the Born limit than it is in YBa2Cu3O6.50. It has also been suggested that the nearly linear temperature dependence of for any given fixed frequency at low T is also a consequence of intermediate scattering phase shifts.schachinger02 ; hensen97
In attempting to generate a microscopic description of conductivity data many researchers have focused on models of quasiparticle scattering from point-like defects. This is a logical starting point, but it has become apparent that such models are incapable of simultaneously accounting for the observed spectral lineshapes and the significant amount of oscillator strength that remains uncondensed at 1.2 K, more than would be expected as the conductivity evolves towards the limit. Schachinger et al. tried to invoke intermediate scattering phase shifts for point scatterers to explain experimental results, but did not present a quantitative set of parameters that could simultaneously describe the spectral shape, its temperature dependence, and the uncondensed oscillator strength at 1.2 K.schachinger03 This problem is widespread and far more severe in other cuprates. In for instance there is much greater uncondensed oscillator strength observed in both terahertz measurements of films corson00 and microwave measurements of single crystals.lee96 In these cases, residual oscillator strength as high as 30 % of the superfluid density was observed, compared to the few percent seen in the YBa2Cu3O6+y samples discussed here. Motivated by the spectroscopic inhomogeneity observed in scanning tunneling spectroscopy,pan01 Orenstein orenstein03 has suggested that this oscillator strength was due to a collective mode in the presence of inhomogeneity. More recently, Nunner et al. have been driven by tunneling results to suggest that randomly distributed interstitial O dopants may be the source of the electronic inhomogeneity in .nunner05 This has suggested that rather than focussing on point scatterers, a better approach is to study extended scatterers, which give rise to slowly varying potentials on the CuO2 planes created by off-plane disorder. Such models start from knowledge of the actual defects in the system and have had considerable success in fitting both the microwave data and the YBa2Cu3O6.993 data presented here. The basic suggestion is that off-plane disorder is a controlling feature of all cuprates and that even though the relative amount disorder is much smaller in the oxygen-ordered phases of YBa2Cu3O6+y, it still plays an important role in understanding its electronic properties. The new spectroscopic data presented here, together with that on other materialslee96 ; broun97 provides a testing ground for the different models: collective modes in an inhomogeneous superconductor, point scatterers with intermediate phase shifts, and scattering by off-plane disorder.
Acknowledgements.
The authors gratefully acknowledge financial support from the Natural Science and Engineering Research Council of Canada and the Canadian Institute for Advanced Research.References
- (1) W. N. Hardy, D. A. Bonn, D. C. Morgan, Ruixing Liang and Kuan Zhang, Phys. Rev. Lett. 70, 3999 (1993).
- (2) James Annett, Nigel Goldenfeld, and S. R. Renn, Phys. Rev. B43, 2778 (1991).
- (3) D. J. Scalapino, Phys. Rep. 250, 329 (1995).
- (4) D. A. Bonn, S. Kamal, Kuan Zhang, Ruixing Liang, D. J. Baar, E. Klein, and W. N. Hardy, Phys. Rev. B50, 4051 (1994).
- (5) D. Achkir, M. Poirier, D. A. Bonn, Ruixing Liang and W. N. Hardy, Phys. Rev. B 48, 13184 (1993).
- (6) D. A. Bonn, S. Kamal, A. Bonakdarpour, R. Liang, W. N. Hardy, C. C. Homes, D. N. Basov, and T. Timusk, Czech. J. Phys. 46 3195 (1996).
- (7) Ruixing Liang, W. N. Hardy, and D. A. Bonn, Physica (Amsterdam) 304C, 105 (1998).
- (8) Ruixing Liang, W. N. Hardy, and D. A. Bonn, Physica (Amsterdam) 336C, 57 (2000).
- (9) R. Liang, D. A. Bonn, W. N. Hardy, J. C. Wynn, K. A. Moler, L. Lu, S. Larochelle, L. Zhou, M. Greven, L. Lurio and S. G. J. Mochrie, Physica (Amsterdam) 383C, 1 (2002).
- (10) M. C. Nuss, P. M. Mankiewich, M. L. O’Malley, E. H. Westerwick and P. B. Littlewood, Phys. Rev. Lett. 66, 3305 (1991).
- (11) D. A. Bonn, P. Dosanjh, R. Liang and W. N. Hardy, Phys. Rev. Lett. 68, 2390 (1992).
- (12) D. A. Bonn, R. Liang, T. M. Riseman, D. J. Baar, D. C. Morgan, K. Zhang, P. Dosanjh, T. L. Duty, A. MacFarlane, G. D. Morris, J. H. Brewer, W. N. Hardy, C. Kallin and A. J. Berlinsky, Phys. Rev. B47, 11314 (1993).
- (13) R. C. Yu, M. B. Salamon, Jian Ping Lu and W. C. Lee, Phys. Rev. Lett. 69, 1431 (1992).
- (14) D. B. Romero, C. D. Porter, D. B. Tanner, L. Forro, D. Mandrus, L. Mihaly, G. L. Carr, and G. P. Williams, Phys. Rev. Lett. 68, 1590 (1992).
- (15) A. Hosseini, R. Harris, Saeid Kamal, P. Dosanjh, J. Preston, Ruixing Liang, W. N. Hardy, and D. A. Bonn, Phys. Rev. B60, 1349 (1999).
- (16) X. J. Zhou, T. Yoshida, A. Lanzara, P. V. Bogdanov, S. A. Kellar, K. M. Shen, W. L. Yang, F. Ronning, T. Sasagawa, T. Kakeshita, T. Noda, H. Eisaki, S. Uchida, C. T. Lin, F. Zhou, J. W. Xiong, W. X. Ti, Z. X. Zhao, A. Fujimori, Z. Hussain, and Z. X. Shen, Nature 423, 398 (2003).
- (17) A. J. Berlinsky, D. A. Bonn, R. Harris, and C. Kallin, Phys. Rev. B61, 9088 (2000).
- (18) M.B. Walker and M.F. Smith, Phys. Rev. B 61, 11285 (2000).
- (19) D. Duffy, P.J. Hirschfeld and D.J. Scalapino, Phys. Rev. B 64, 224522 (2001).
- (20) R. Harris, A. Hosseini, Saeid Kamal, P. Dosanjh, Ruixing Liang, W. N. Hardy, and D. A. Bonn, Phys. Rev. B64, 64509 (2001).
- (21) P. J. Turner, D. M. Broun, Saeid Kamal, M. E. Hayden, J. S. Bobowski, R. Harris, D. C. Morgan, J. S. Preston, D. A. Bonn, and W. N. Hardy, Rev. Sci. Instrum 75, 124 (2004).
- (22) P. J. Turner, R. Harris, Saeid Kamal, M. E. Hayden, D. M. Broun, D. C. Morgan, A. Hosseini, P. Dosanjh, G. Mullins, J. S. Preston, Ruixing Liang, D. A. Bonn, and W. N. Hardy, Phys. Rev. Lett. 90, 237005 (2003).
- (23) T. Pereg-Barnea, P. J. Turner, R. Harris, G. K. Mullins, J. S. Bobowski, M. Raudsepp, R. Liang, D. A. Bonn, and W. N. Hardy, Phys. Rev. B69, 184513 (2004).
- (24) I. Kosztin and A. J. Leggett, Phys. Rev. Lett. 79, 135 (1997).
- (25) J. J. Chang and D. J. Scalapino, Phys. Rev. B 40, 4299 (1989).
- (26) S. Sridar and W. L. Kennedy, Rev. Sci. Instrum 59, 531 (1998).
- (27) D.A. Bonn and W.N. Hardy, in Physical Properties of High Temperature Superconductors, Vol. V, ed. D.M. Ginsberg (World Scientific, Singapore, 1996).
- (28) R. J. Ormeno, D. C. Morgan, D. M. Broun, S. F. Lee and J. R. Waldram, Rev. Sci. Instrum 68, 2121 (1997).
- (29) R. A. Waldron,Theory of Guided Electromagnetic Waves, Van Nostrand, New York (1970).
- (30) Saeid Kamal, Ph.D. thesis, University of British Columbia (2002).
- (31) S. Ozcan, D. M. Broun, B. Morgan, R. K. W. Haselwimmer, J. R. Waldram, J. L. Sarrao, Saeid Kamal, C. P. Bidinosti, and P. J. Turner, Europhys. Lett. 62, 412 (2003).
- (32) D. M. Broun, P. J. Turner, G. K. Mullins, D. E. Sheehy, X. G. Zheng, S. K. Kim, N. A. Frederick, M. B. Maple, W. N. Hardy, and D. A. Bonn, Europhys. Lett. 62, 412 (2003).
- (33) N. H. Andersen, M. von Zimmermann, T. Frello, M. Kall, D. Monster, P. A. Lindgard, J. Madsen, T. Niemoller, H. F. Poulsen, O. Schmidt, J. R. Schneider, Th. Wolf, P. Dosanjh, R. Liang, and W. N. Hardy, Physica (Amsterdam) 317C, 259 (1999).
- (34) F. and H. London, Proc. Roy. Soc. A149, 71 (1935).
- (35) W. A. Atkinson, Phys. Rev. B 59, 3377 (1999).
- (36) J. R. Waldram, P. Theopistou, A. Porch, and H. M. Cheah, Phys. Rev. B55, 3222 (1997).
- (37) A. J. Berlinsky, C. Kallin, G. Rose, and A. C. Shi, Phys. Rev. B48, 4074 (1993).
- (38) J. Corson, J. Orenstein, Seongshik Oh, J. O’Donnell and J. N. Eckstein, Phys. Rev. Lett. 85, 2569 (2000).
- (39) S. Ozcan, P. J. Turner, J. R. Waldram, R. J. Drost, P. H. Kes and D. M. Broun, Phys. Rev. B 73, 64506 (2006).
- (40) T. P. Orlando and K. A. Delin, Foundations of Applied Superconductivity , (Addison-Wesley, New York, New York., 1991).
- (41) D. N. Basov, R. Liang, D. A. Bonn, W. N. Hardy, B. Dabrowski, M. Quijada, D. B. Tanner, J. P. Rice, D. M. Ginsberg and T. Timusk, Phys. Rev. Lett. 74, 598 (1995).
- (42) M. Tinkham, Introduction to Superconductivity , (McGraw Hill Inc., Toronto, Canada, 1996).
- (43) S. Kamal, D. A. Bonn, Nigel Goldenfeld, P. J. Hirschfeld, R. Liang, W. N. Hardy, Phys. Rev. Lett. 73, 1845 (1994).
- (44) S. Kamal, R. Liang, A. Hosseini, D. A. Bonn and W. N. Hardy, Phys. Rev. B58, R8933 (1998).
- (45) P. J. Hirschfeld, W. O. Putikka and D. J. Scalapino, Phys. Rev. Lett. 71, 3705 (1993).
- (46) P. J. Hirschfeld, W. O. Putikka and D. J. Scalapino, Phys. Rev. B50, 10250 (1994).
- (47) R. Harris, Ph.D. thesis, University of British Columbia (2004).
- (48) E. Schachinger and J. P. Carbotte, Phys. Rev. B 65, 64514 (2002).
- (49) E. Bascones, T. M. Rice, A. O. Shorikov, A. V. Lukoyanov, and V. I. Anisimov, Phys. Rev. B71 012505 (2005).
- (50) E. Schachinger and J. P. Carbotte, Phys. Rev. B 67, 134509 (2003).
- (51) Wonkee Kim, F. Marsiglio and J. P. Carbotte, Phys. Rev. B 70, 060505(R) (2004).
- (52) R. W. Hill, Christian Lupien, M. Sutherland, Etienne Boaknin, D. G. Hawthorn, Cyril Proust, F. Ronning, Louis Taillefer, Ruixing Liang, D. A. Bonn, and W. N. Hardy, Phys. Rev. Lett. 92, 27001 (2004).
- (53) S. Hensen and G. Muller and C. T. Rieck and K. Scharnberg, Phys. Rev. B 56, 6237 (1997).
- (54) Shih-Fu Lee, D. C. Morgan, R. J. Ormeno, D. Broun, R. A. Doyle, J. R. Waldram, and K. Kadowaki, Phys. Rev. Lett. 77, 735 (1996).
- (55) S. H. Pan, J. P. O’Neal, R. L. Badzey, C. Chamon, H. Ding, J. R. Engelbrecht, Z. Wang, H. Eisaki, S. Uchida, A. K. Gupta, K.-W. Ng, E. W. Hudson, K. M. Lang, and J. C. Davis, Nature 413, 282 (2001).
- (56) Joseph Orenstein, Physica C 390, 243 (2003).
- (57) Tamara S. Nunner and P.J. Hirschfeld, Phys. Rev. B 72, 014514 (2005).
- (58) D. M. Broun, D. C. Morgan, R. J. Ormeno, S. F. Lee, A. W. Tyler, A. P. Mackenzie, and J. R. Waldram, Phys. Rev. B 56, R11443 (1997).